


New setups
TICKERS: MSTR(NASDAQ), MARA(NASDAQ), DUOL(NASDAQ), DNLI(NASDAQ), KNTK(NYSE), 7532(TSE)
MicroStrategy Incorporated-(MSTR/NASDAQ)-Long Idea
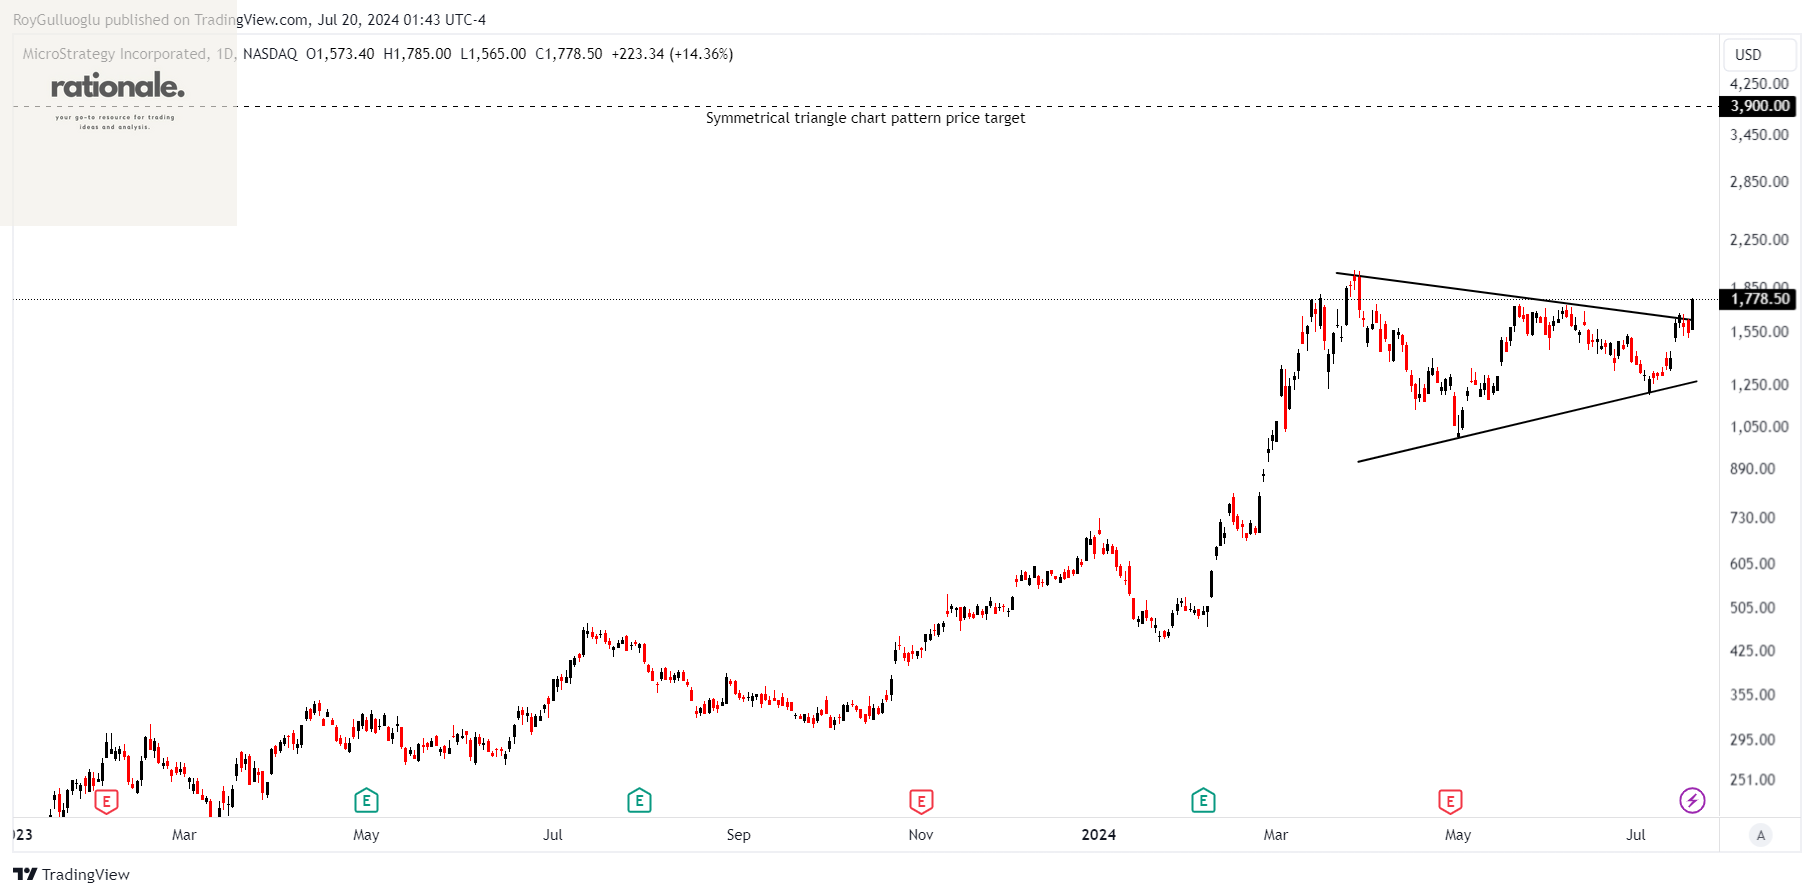
MicroStrategy Incorporated offers artificial intelligence-driven enterprise analytics software and services across the United States, Europe, the Middle East, Africa, and globally.
The above daily chart formed an approximately 3-month-long symmetrical triangle chart pattern as a bullish continuation after an uptrend.
A daily close above 1720 levels validated the breakout from the 3-month-long symmetrical triangle chart pattern.
Based on this chart pattern, the potential price target is 3900 levels.
Marathon Digital Holdings, Inc.-(MARA/NASDAQ)-Long Idea
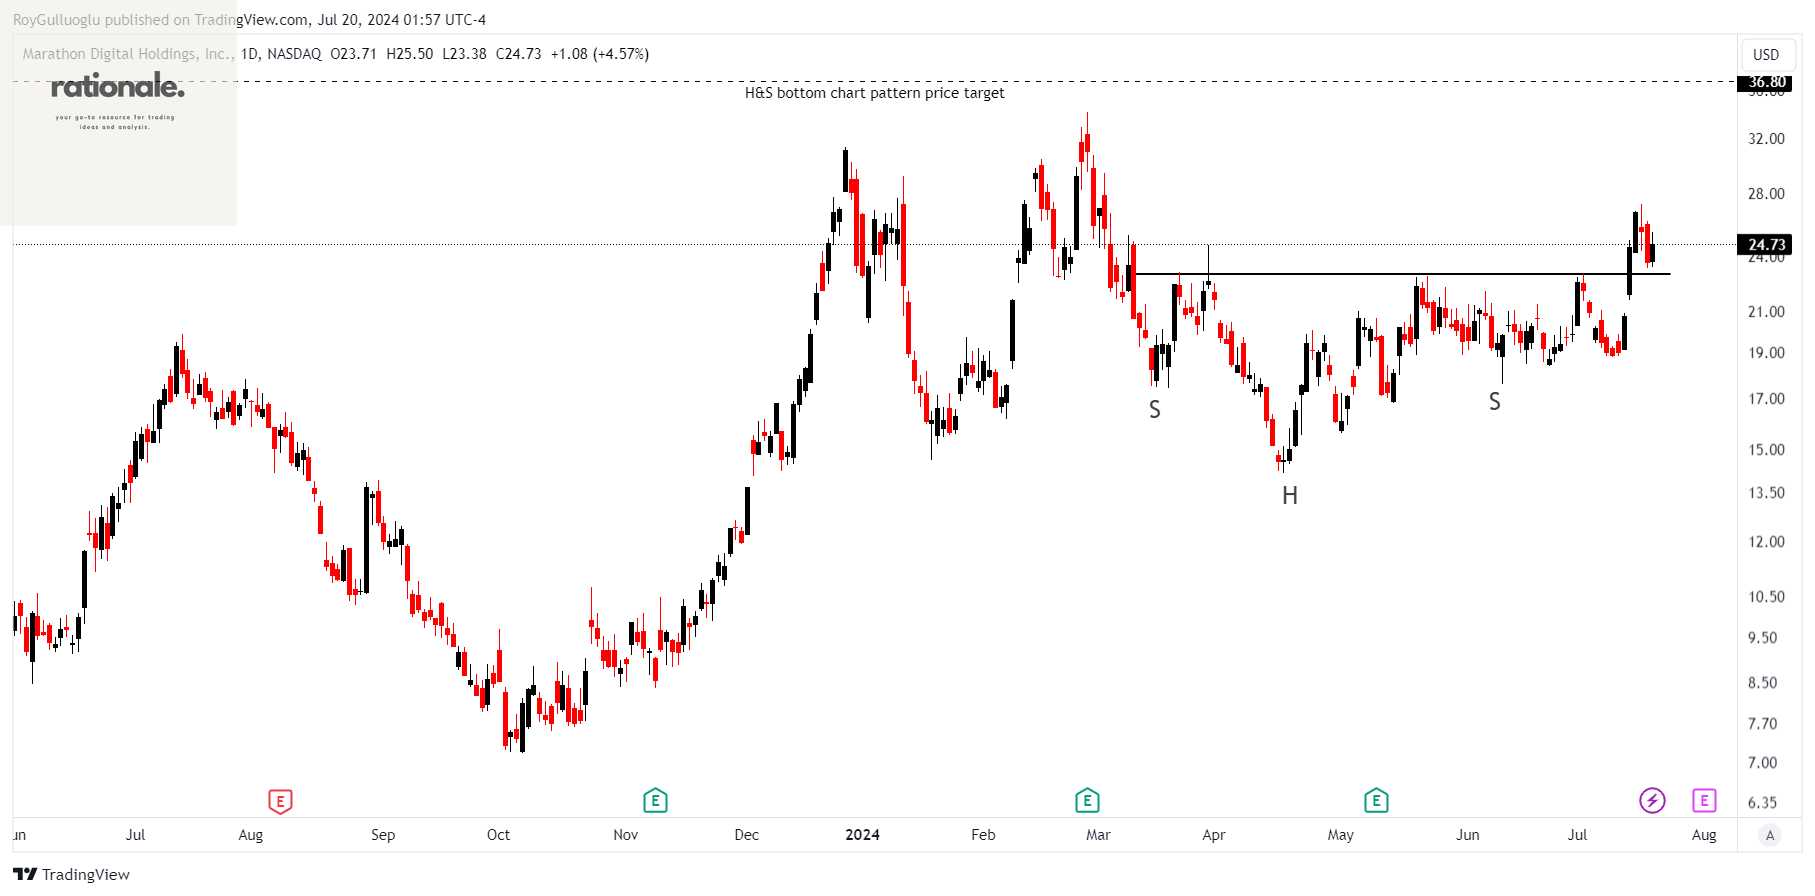
Marathon Digital Holdings, Inc. is a digital asset technology company that specializes in mining digital assets, primarily within the Bitcoin ecosystem, in the United States.
The above daily chart formed an approximately 3-month-long H&S bottom chart pattern as a bullish reversal after a downtrend.
The horizontal boundary at 23 levels acts as a resistance within this pattern.
A daily close above 23.7 levels validated the breakout from the 3-month-long H&S bottom chart pattern and pulled back to the resistance level of the chart pattern.
It’s good to see a low selling volume during the pullback.
Based on this chart pattern, the potential price target is 36.8 levels.
Duolingo, Inc.-(DUOL/NASDAQ)-Short Idea
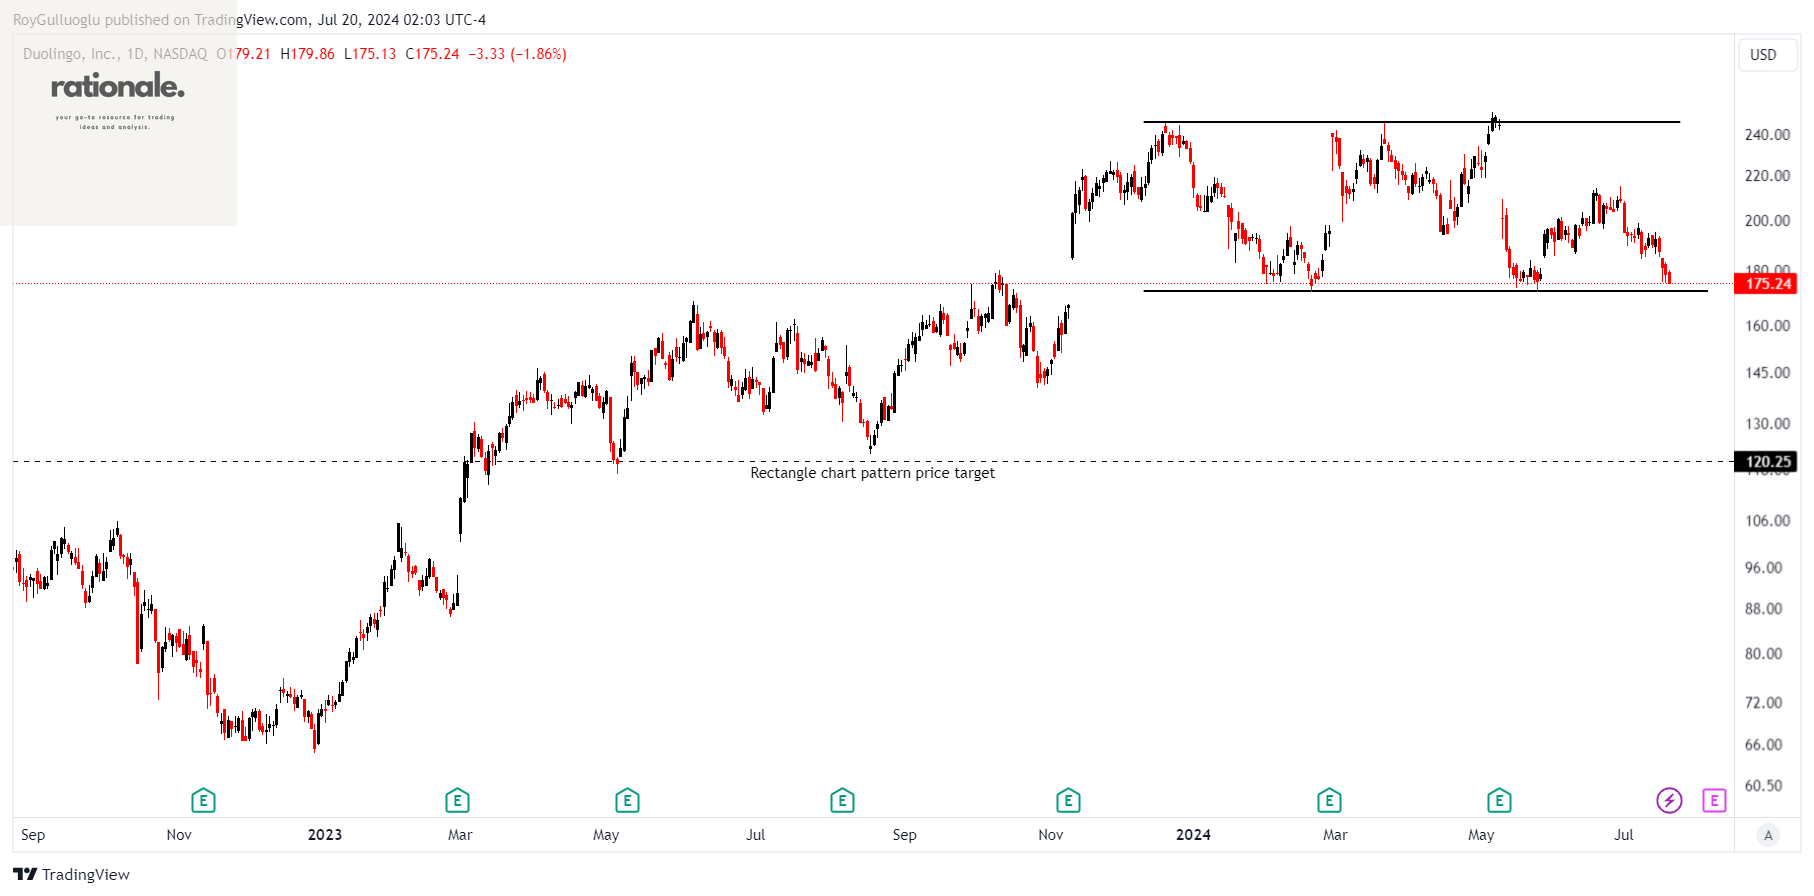
Duolingo, Inc. is a mobile learning platform operating in the United States, the United Kingdom, and internationally. The company provides courses in 40 languages, including Spanish, English, French, German, Italian, Portuguese, Japanese, and Chinese, through its Duolingo app.
The above daily chart formed an approximately 5-month-long rectangle chart pattern as a bullish reversal after an uptrend.
The horizontal boundary at 172 levels acts as a support within this pattern.
A daily close below 166.84 levels would validate the breakdown from the 5-month-long rectangle chart pattern.
Based on this chart pattern, the potential price target is 120.25 levels.
Denali Therapeutics Inc.-(DNLI/NASDAQ)-Long Idea
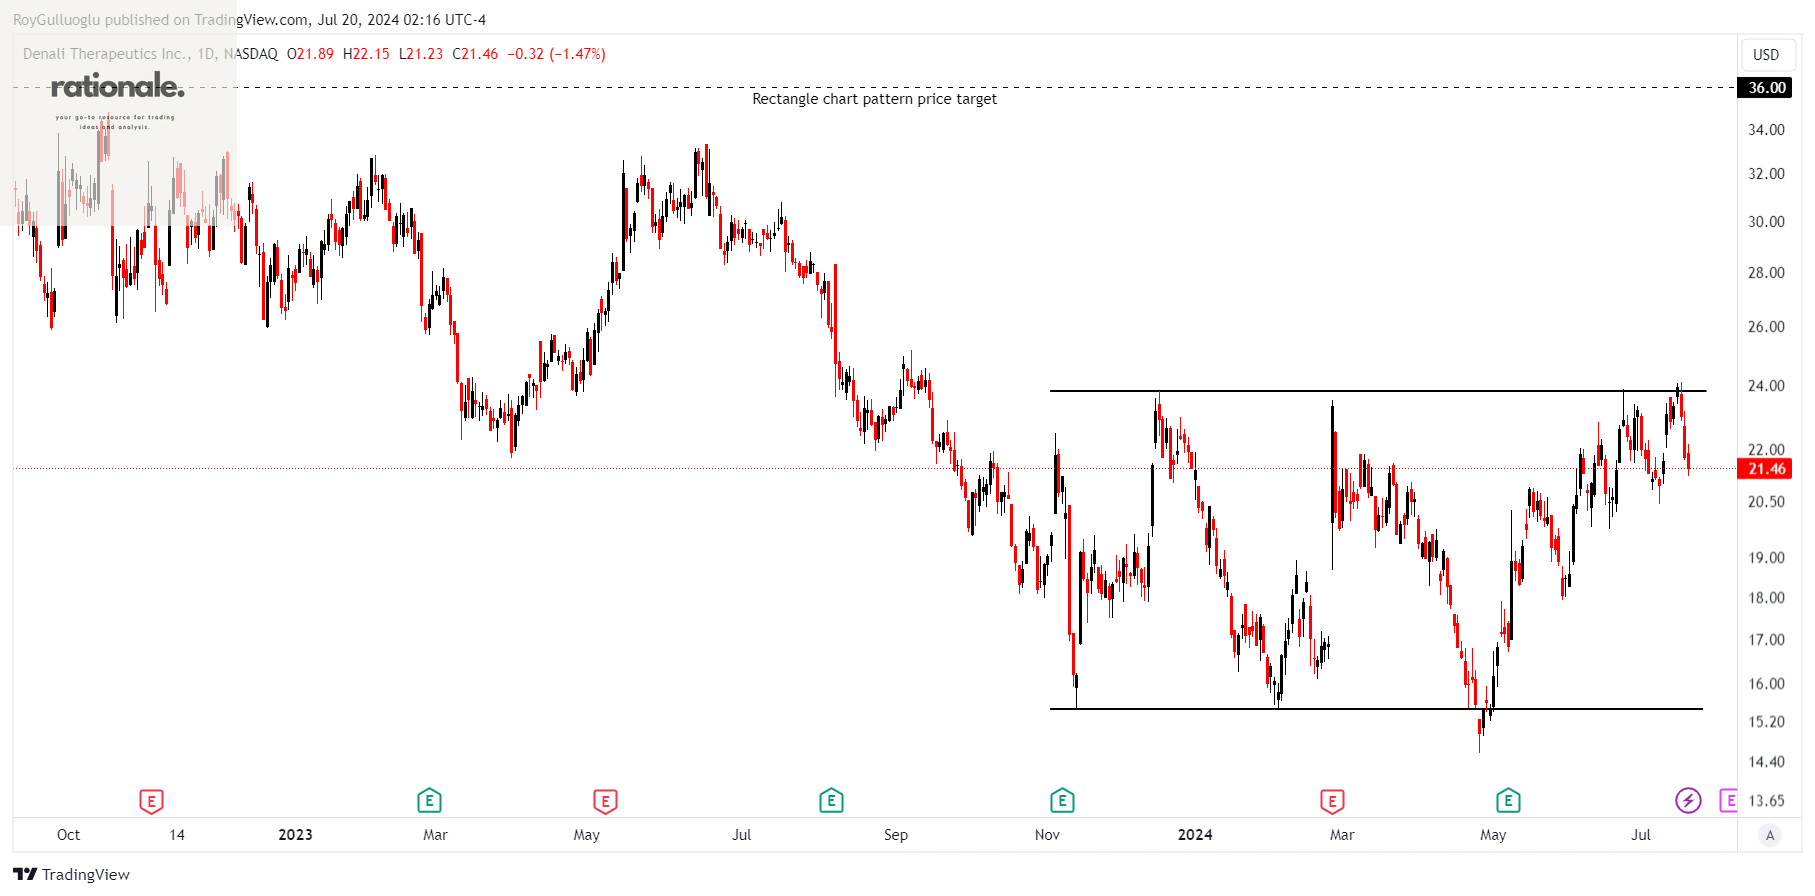
Denali Therapeutics Inc. is a biopharmaceutical company that develops a portfolio of product candidates designed to cross the blood-brain barrier, targeting neurodegenerative diseases and lysosomal storage diseases in the United States.
The above daily chart formed an approximately 6-month-long rectangle chart pattern as a bullish reversal after a downtrend.
The horizontal boundary at 23.8 levels acts as a resistance within this pattern.
A daily close above 24.51 levels would validate the breakdown from the 6-month-long rectangle chart pattern.
Based on this chart pattern, the potential price target is 36 levels.
Kinetik Holdings Inc.-(KNTK/NYSE)-Long Idea
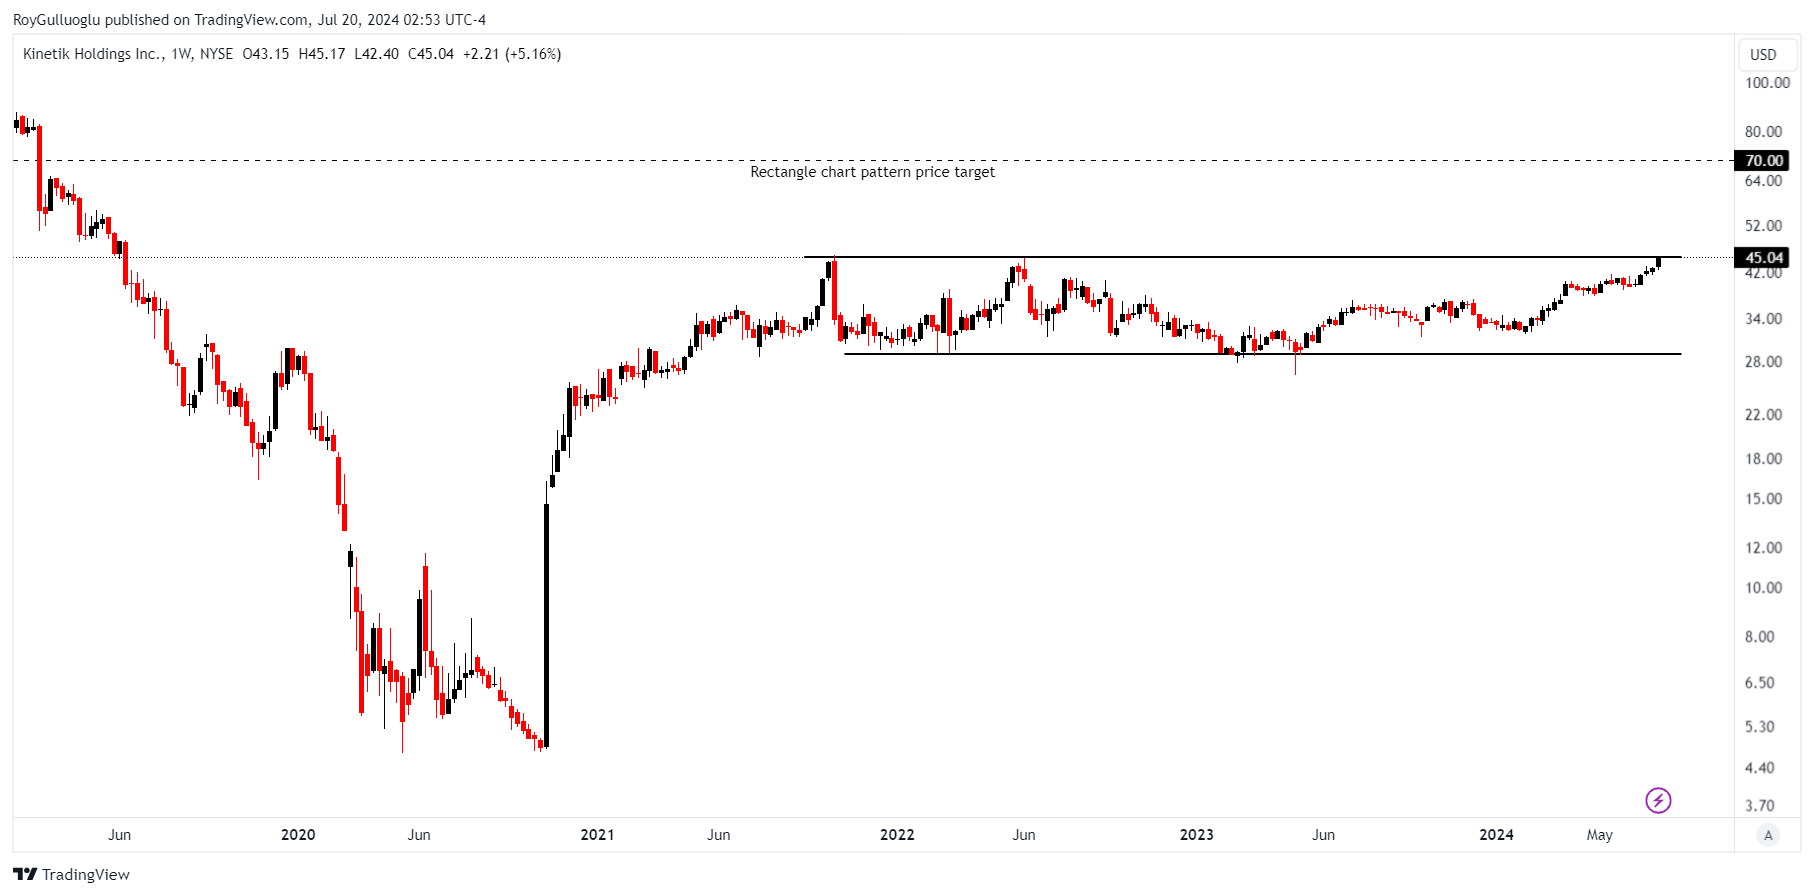
Kinetik Holdings Inc. operates as a midstream company in the Texas Delaware Basin, functioning through two segments: Midstream Logistics and Pipeline Transportation.
The above daily chart formed an approximately 36-month-long rectangle chart pattern as a bullish continuation after an uptrend.
The horizontal boundary at 45 levels acts as a resistance within this pattern.
A daily close above 46.35 levels would validate the breakout from the 36-month-long rectangle chart pattern.
Based on this chart pattern, the potential price target is 70 levels.
Pan Pacific International Holdings Corporation-(7532/TSE)-Long Idea
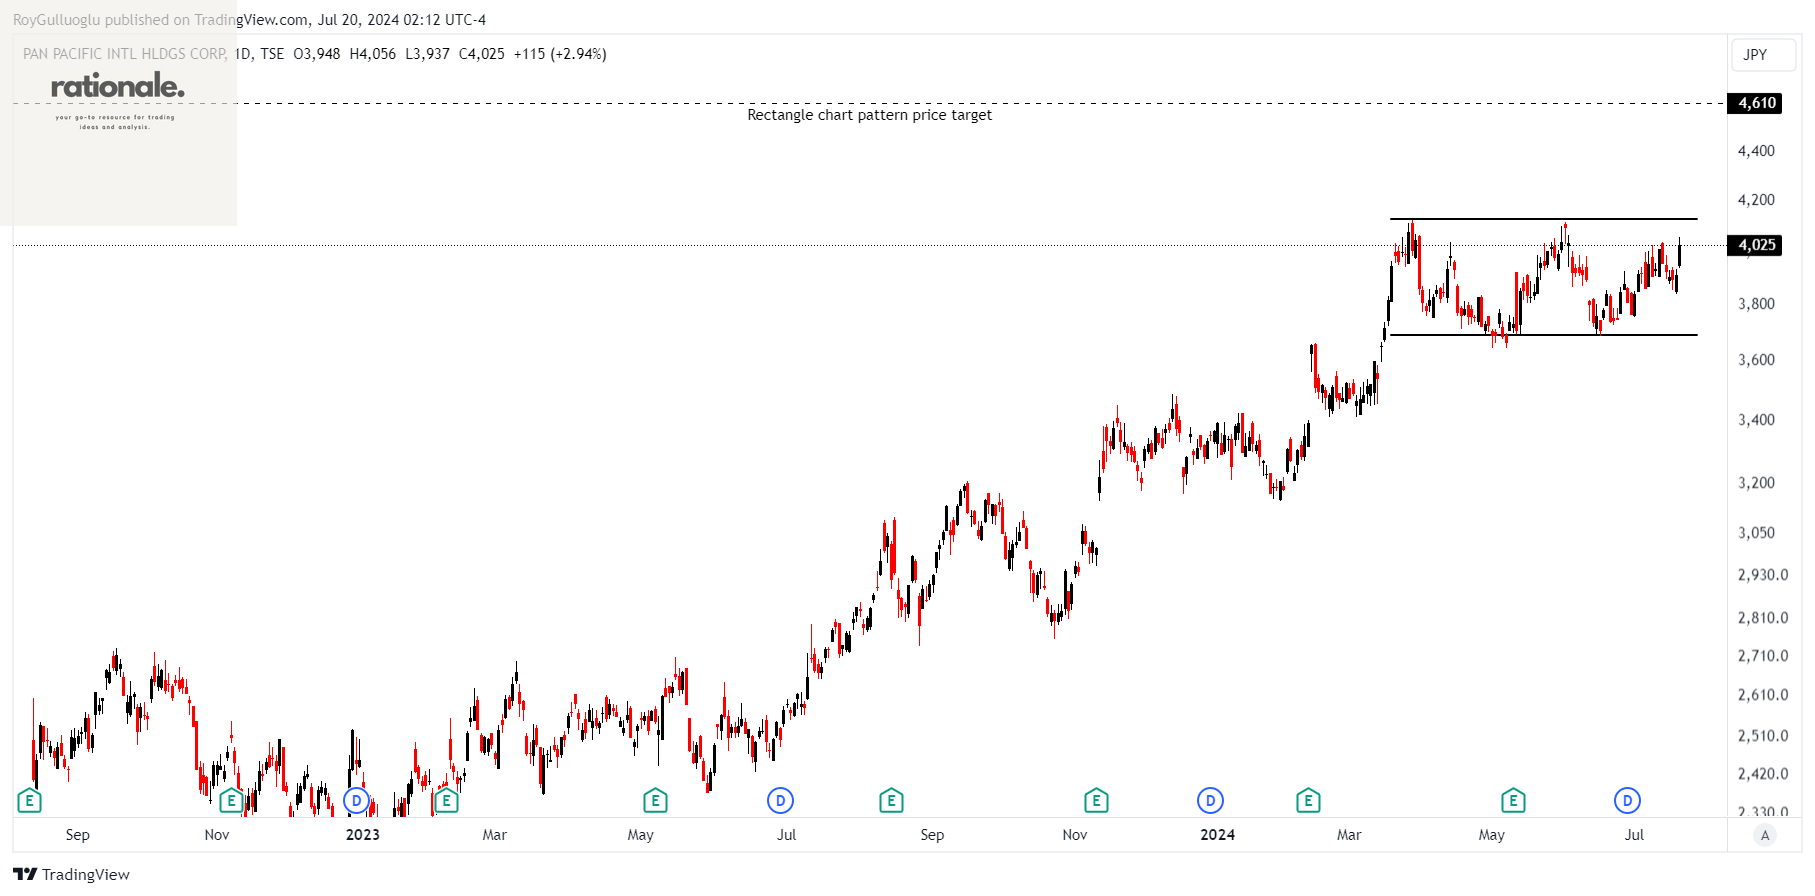
Pan Pacific International Holdings Corporation, along with its subsidiaries, operates retail stores.
The above daily chart formed an approximately 3-month-long rectangle chart pattern as a bullish continuation after an uptrend.
The horizontal boundary at 4126 levels acts as a resistance within this pattern.
A daily close above 4250 levels would validate the breakout from the 3-month-long rectangle chart pattern.
Based on this chart pattern, the potential price target is 4610 levels.
Thank you Roy