


New setups
TICKERS: CSTL(NASDAQ), OMC(NYSE), PH(NYSE), DNTH(NASDAQ), RARE(NASDAQ), UNH(NYSE), EUREN(BIST), SOKM(BIST), KOZAL(BIST), ALK.B(OMXCOP)
Castle Biosciences, Inc.-(CSTL/NASDAQ)-Long Idea
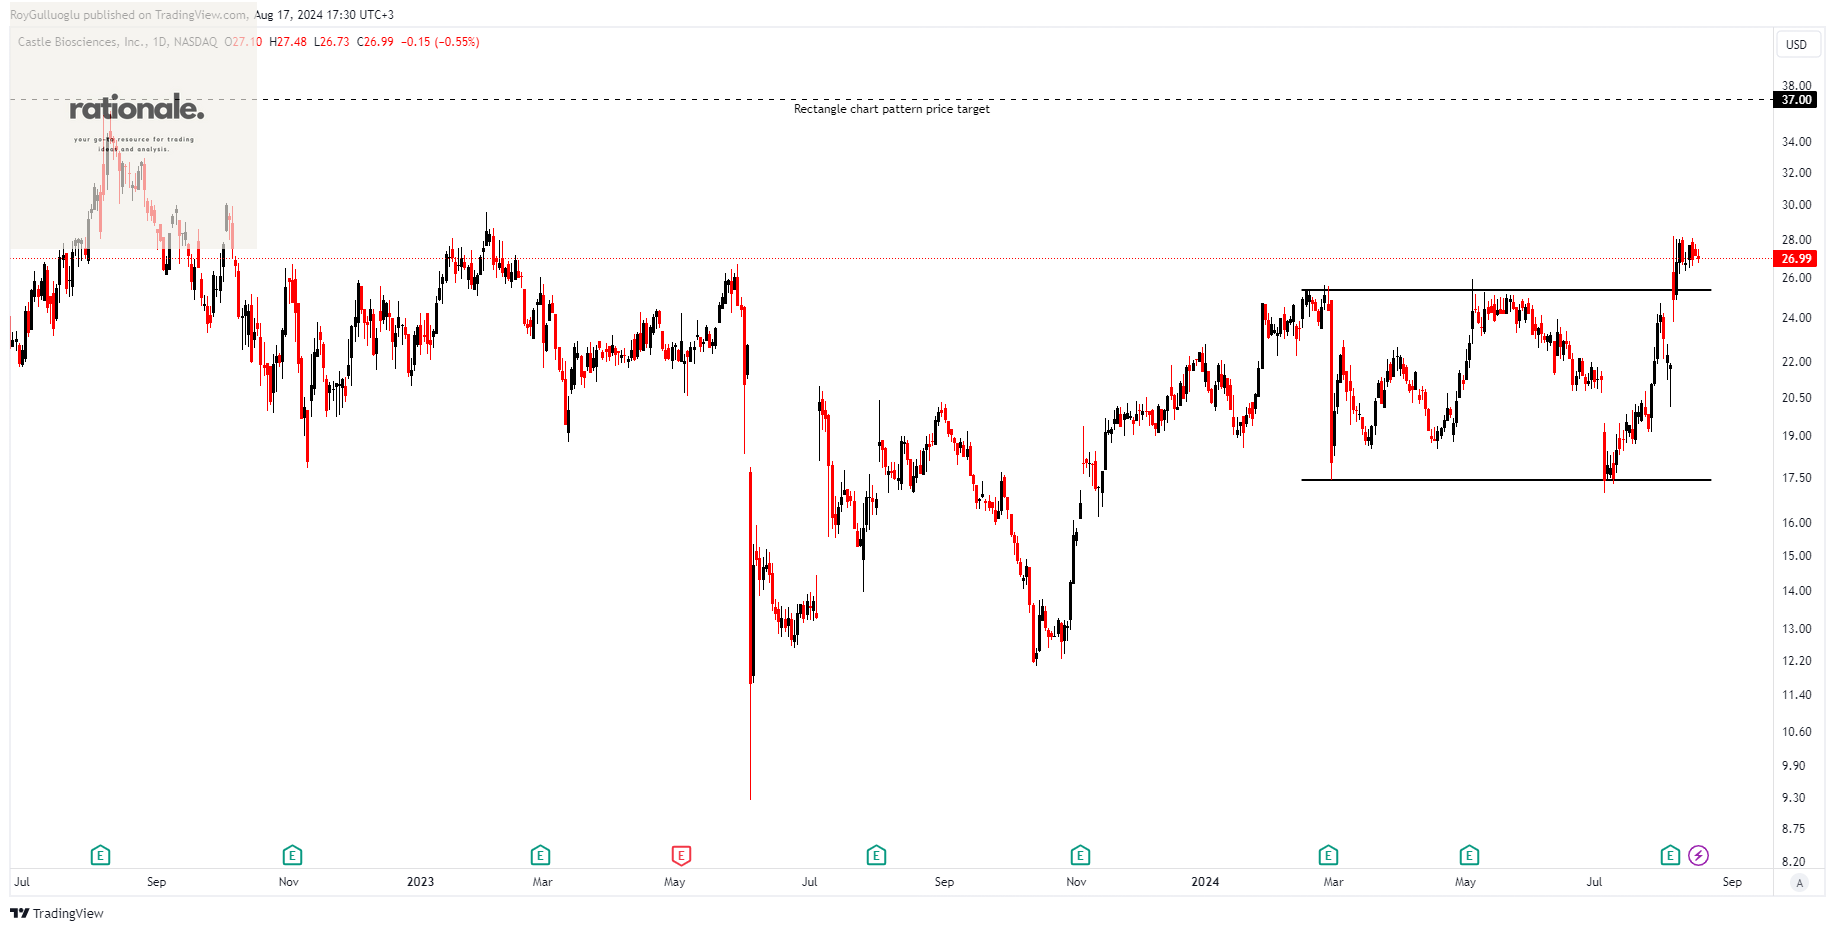
Castle Biosciences, Inc., a molecular diagnostics company, offers testing solutions for diagnosing and treating dermatologic cancers, Barrett's esophagus, uveal melanoma, and mental health conditions.
The above daily chart formed an approximately 4-month-long rectangle chart pattern as a bullish continuation after an uptrend.
The horizontal boundary at 25.36 levels acted as a resistance within this pattern.
A daily close above 26.12 levels validated the breakout from the 4-month-long rectangle chart pattern.
Based on this chart pattern, the potential price target is 37 levels.
CSTL, classified under the "healthcare" sector, falls under the “Small Cap - Value” stock category.
Omnicom Group Inc.-(OMC/NYSE)-Long Idea
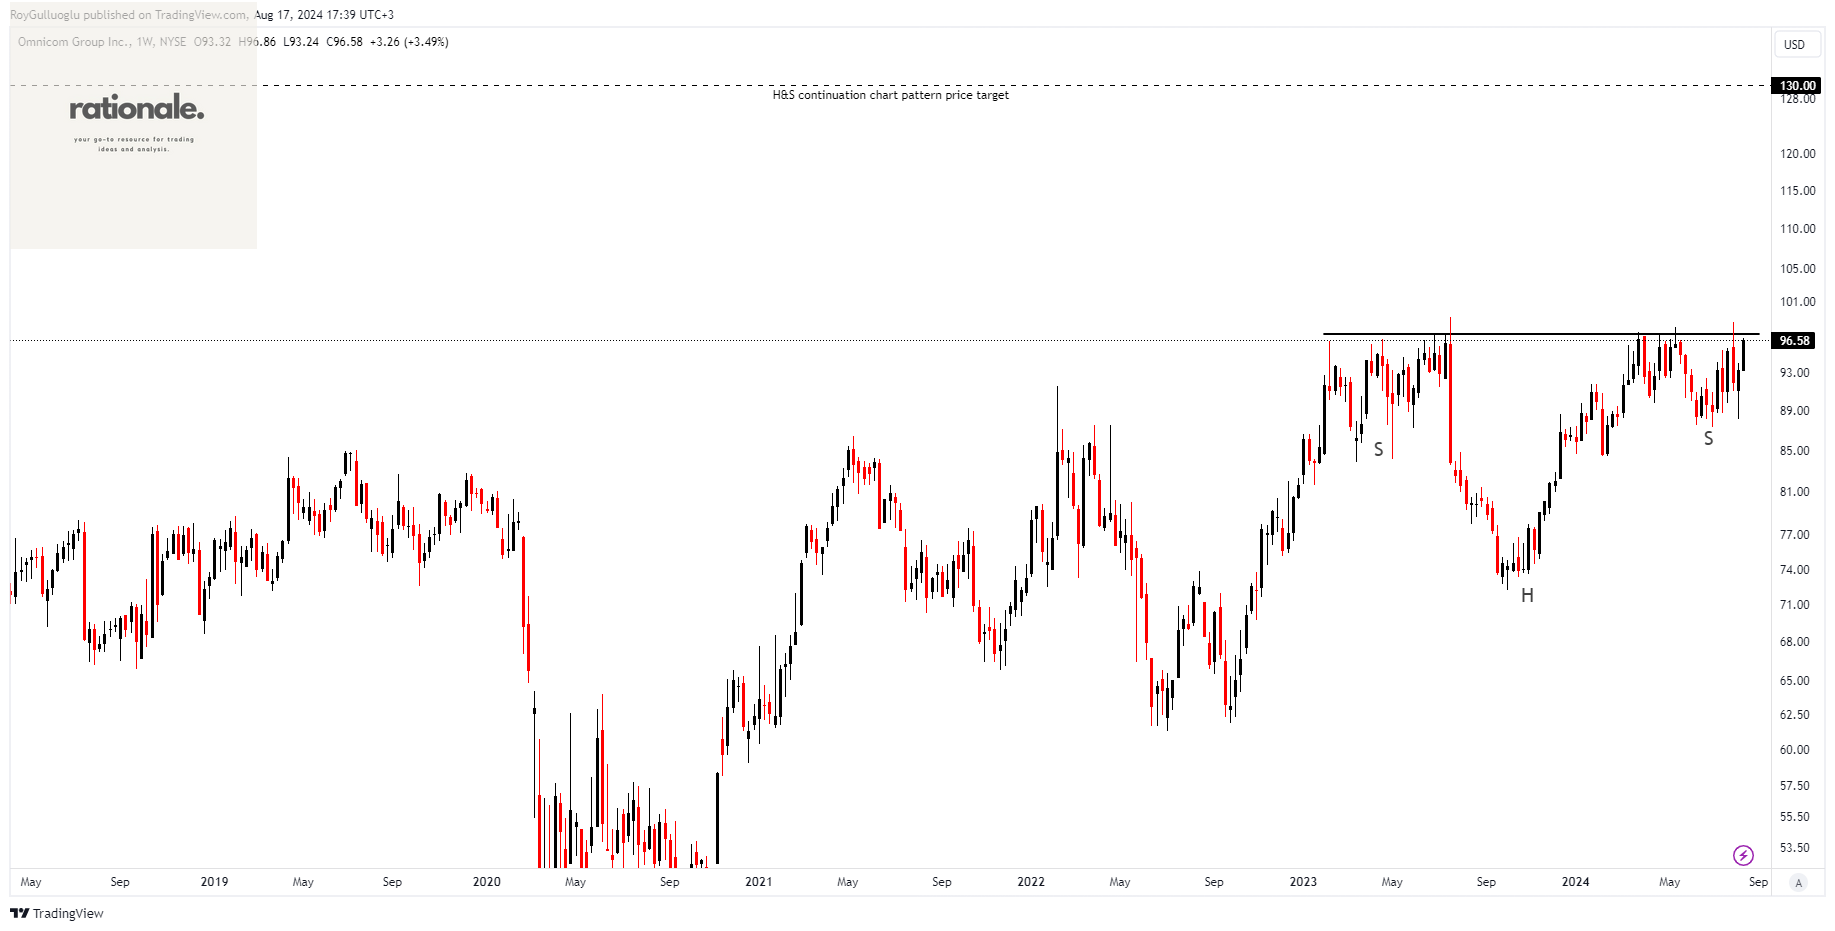
Omnicom Group Inc. and its subsidiaries provide advertising, marketing, and corporate communications services.
The above weekly chart formed an approximately 20-month-long H&S continuation chart pattern as a bullish continuation after an uptrend.
The horizontal boundary at 97.3 levels acts as a resistance within this pattern.
A daily close above 100.21 levels would validate the breakout from the 20-month-long H&S continuation chart pattern.
Based on this chart pattern, the potential price target is 130 levels.
OMC, classified under the "communication services" sector, falls under the “Large Cap - Growth” stock category.
Parker-Hannifin Corporation-(PH/NYSE)-Long Idea
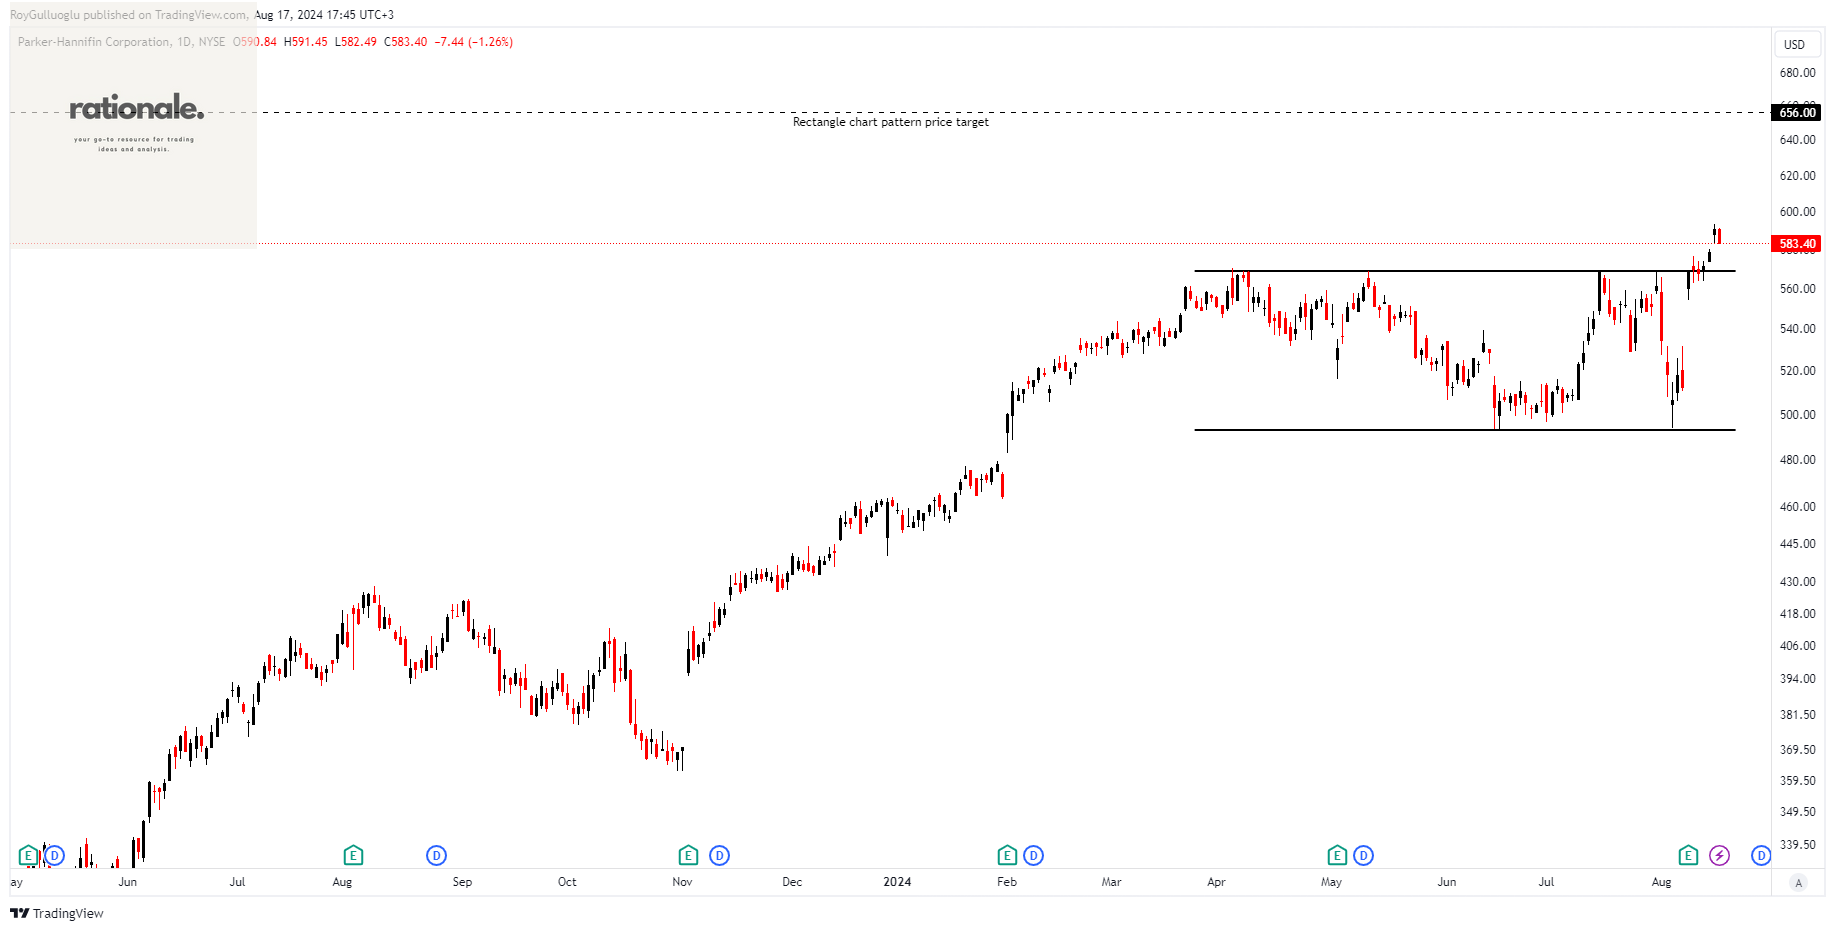
Parker-Hannifin Corporation designs and sells motion and control technologies and systems for diverse mobile, industrial, and aerospace markets globally. The company operates through two segments: Diversified Industrial and Aerospace Systems.
The above daily chart formed an approximately 3-month-long rectangle chart pattern as a bullish continuation after an uptrend.
The horizontal boundary at 569 levels acted as a resistance within this pattern.
A daily close above 586 levels validated the breakout from the 3-month-long rectangle chart pattern.
Based on this chart pattern, the potential price target is 656 levels.
PH, classified under the "industrials" sector, falls under the “Large Cap - Value” stock category.
Dianthus Therapeutics, Inc.-(DNTH/NASDAQ)-Long Idea
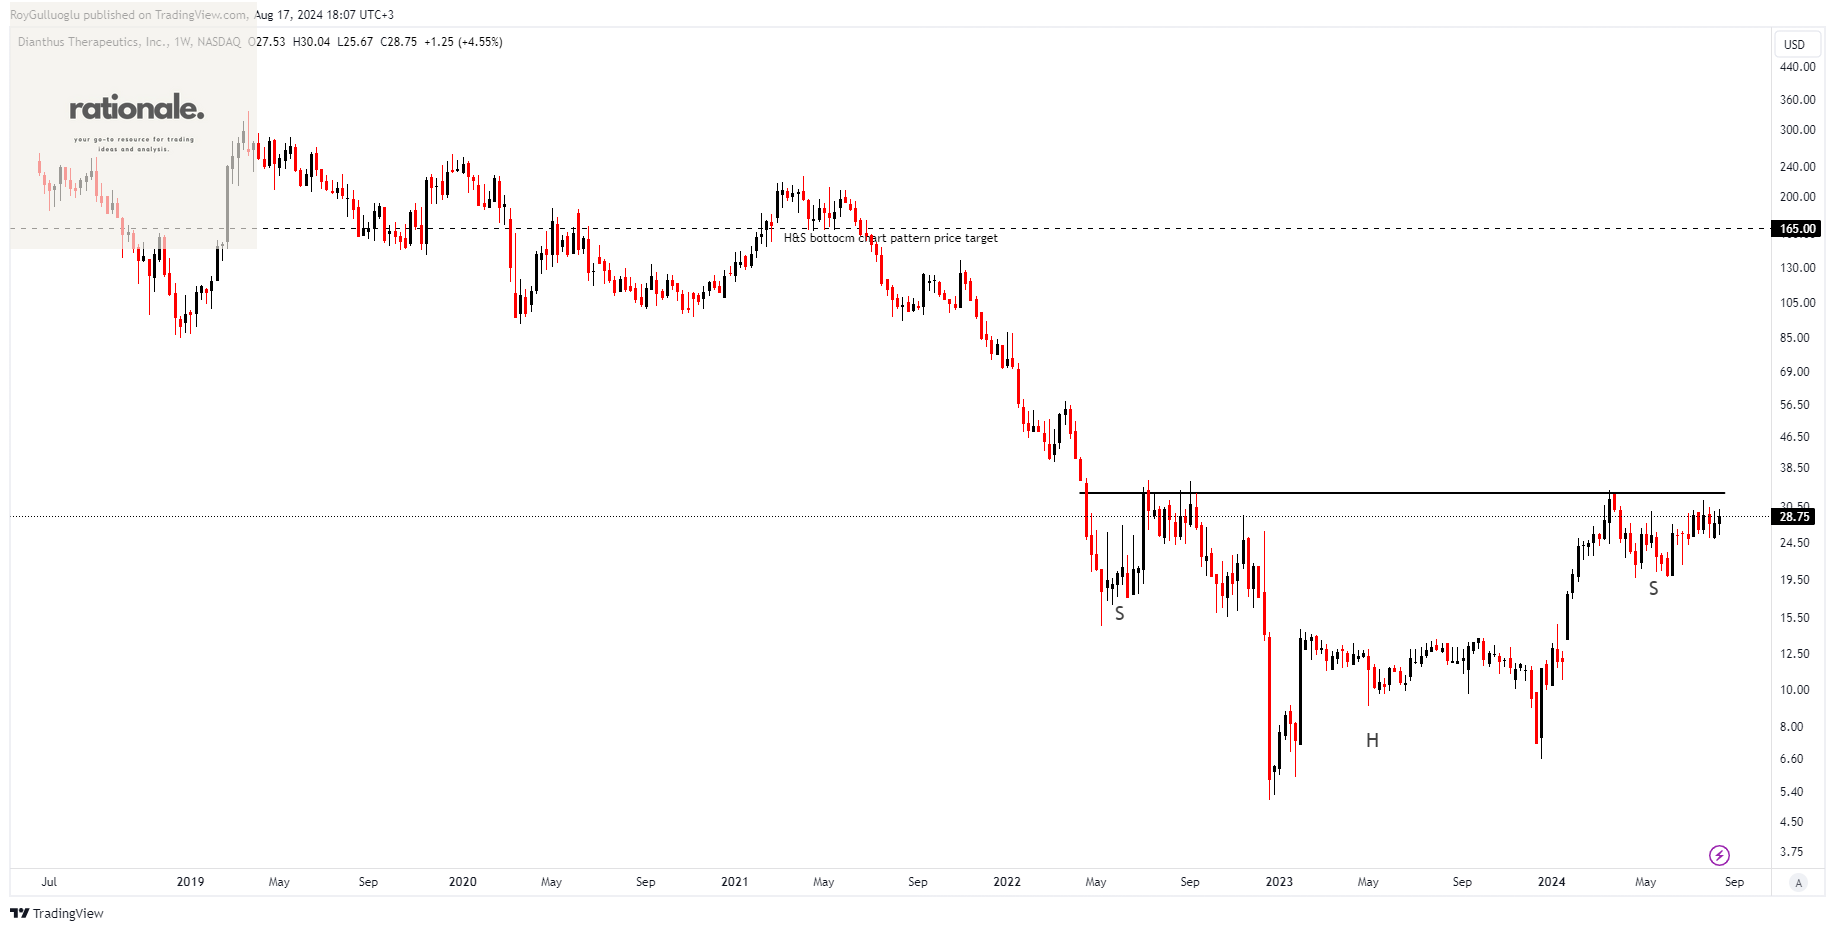
Dianthus Therapeutics, Inc., a clinical-stage biotechnology company, develops complement-based therapeutics for patients with severe autoimmune and inflammatory diseases.
The above weekly chart formed an approximately 30-month-long H&S bottom chart pattern as a bullish reversal after a downtrend.
The horizontal boundary at 33.11 levels acts as a resistance within this pattern.
A daily close above 34.1 levels would validate the breakout from the 30-month-long H&S bottom chart pattern.
Based on this chart pattern, the potential price target is 165 levels.
Ultragenyx Pharmaceutical Inc.-(RARE/NASDAQ)-Long Idea
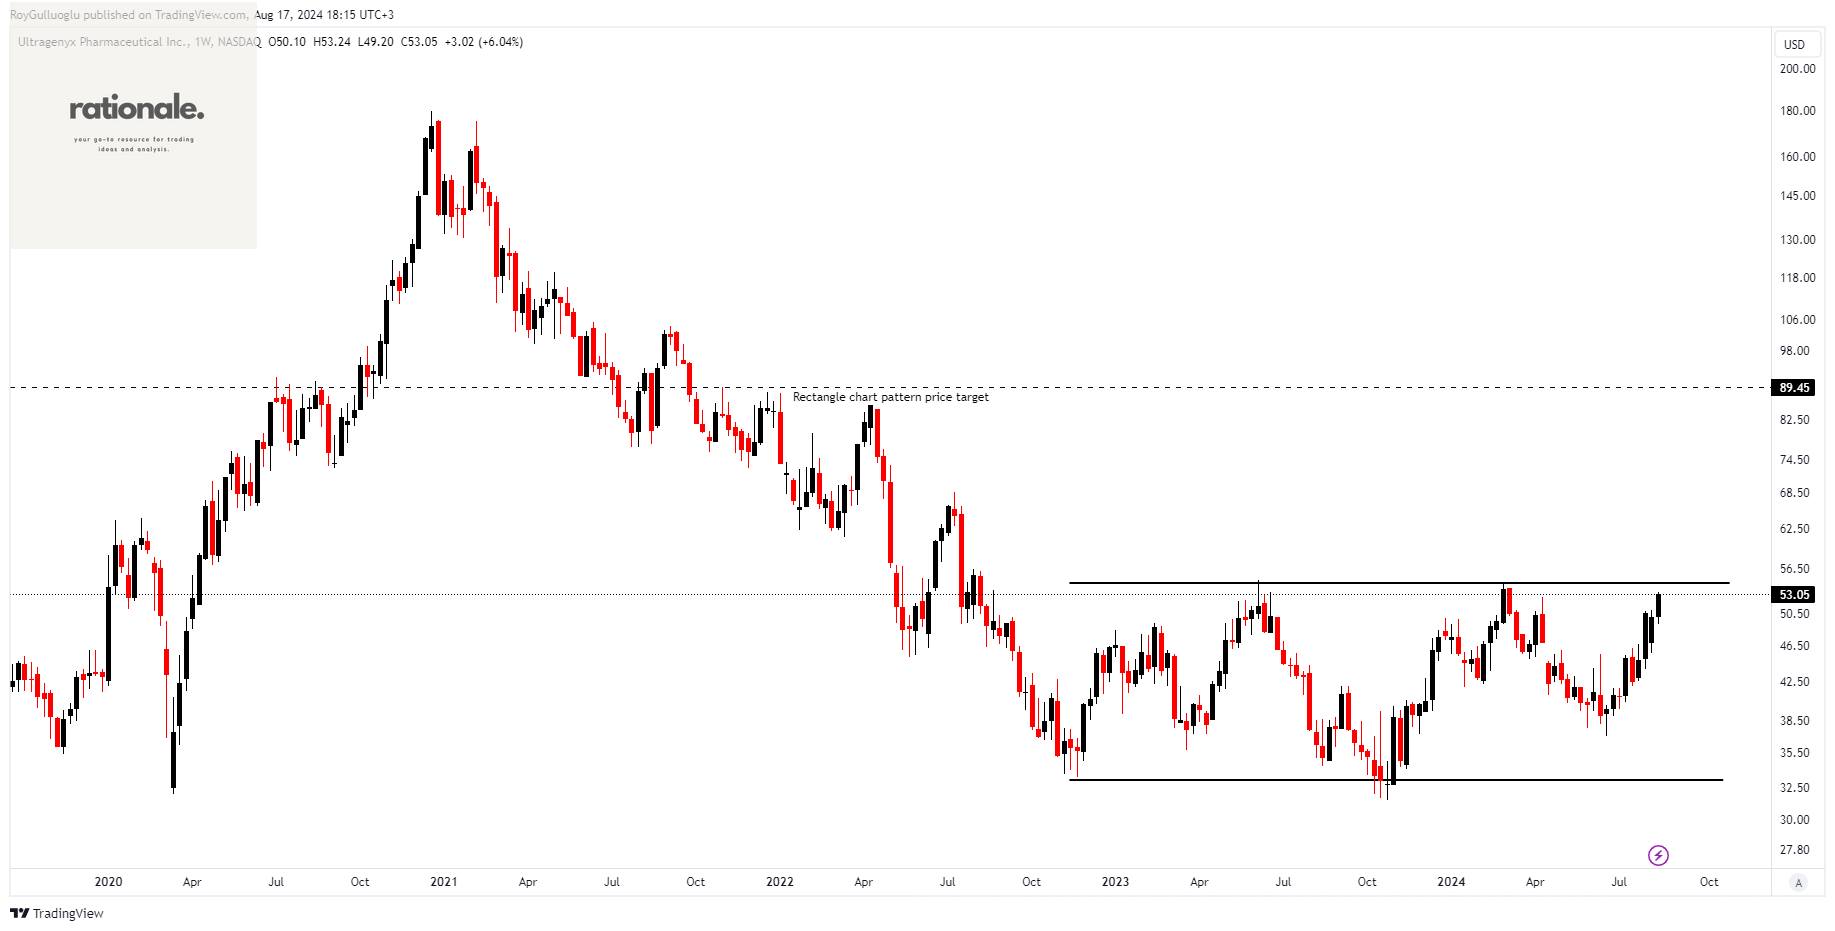
Ultragenyx Pharmaceutical Inc., a biopharmaceutical company, specializes in identifying, acquiring, developing, and commercializing novel treatments for rare and ultra-rare genetic diseases across North America, Latin America, Japan, Europe, and other international markets.
The above weekly chart formed an approximately 22-month-long rectangle chart pattern as a bullish reversal after a downtrend.
The horizontal boundary at 54.5 levels acts as a resistance within this pattern.
A daily close above 56.13 levels would validate the breakout from the 22-month-long rectangle chart pattern.
Based on this chart pattern, the potential price target is 89.45 levels.
RARE, classified under the "healthcare" sector, falls under the “Mid Cap - Value” stock category.
UnitedHealth Group Incorporated-(UNH/NYSE)-Long Idea
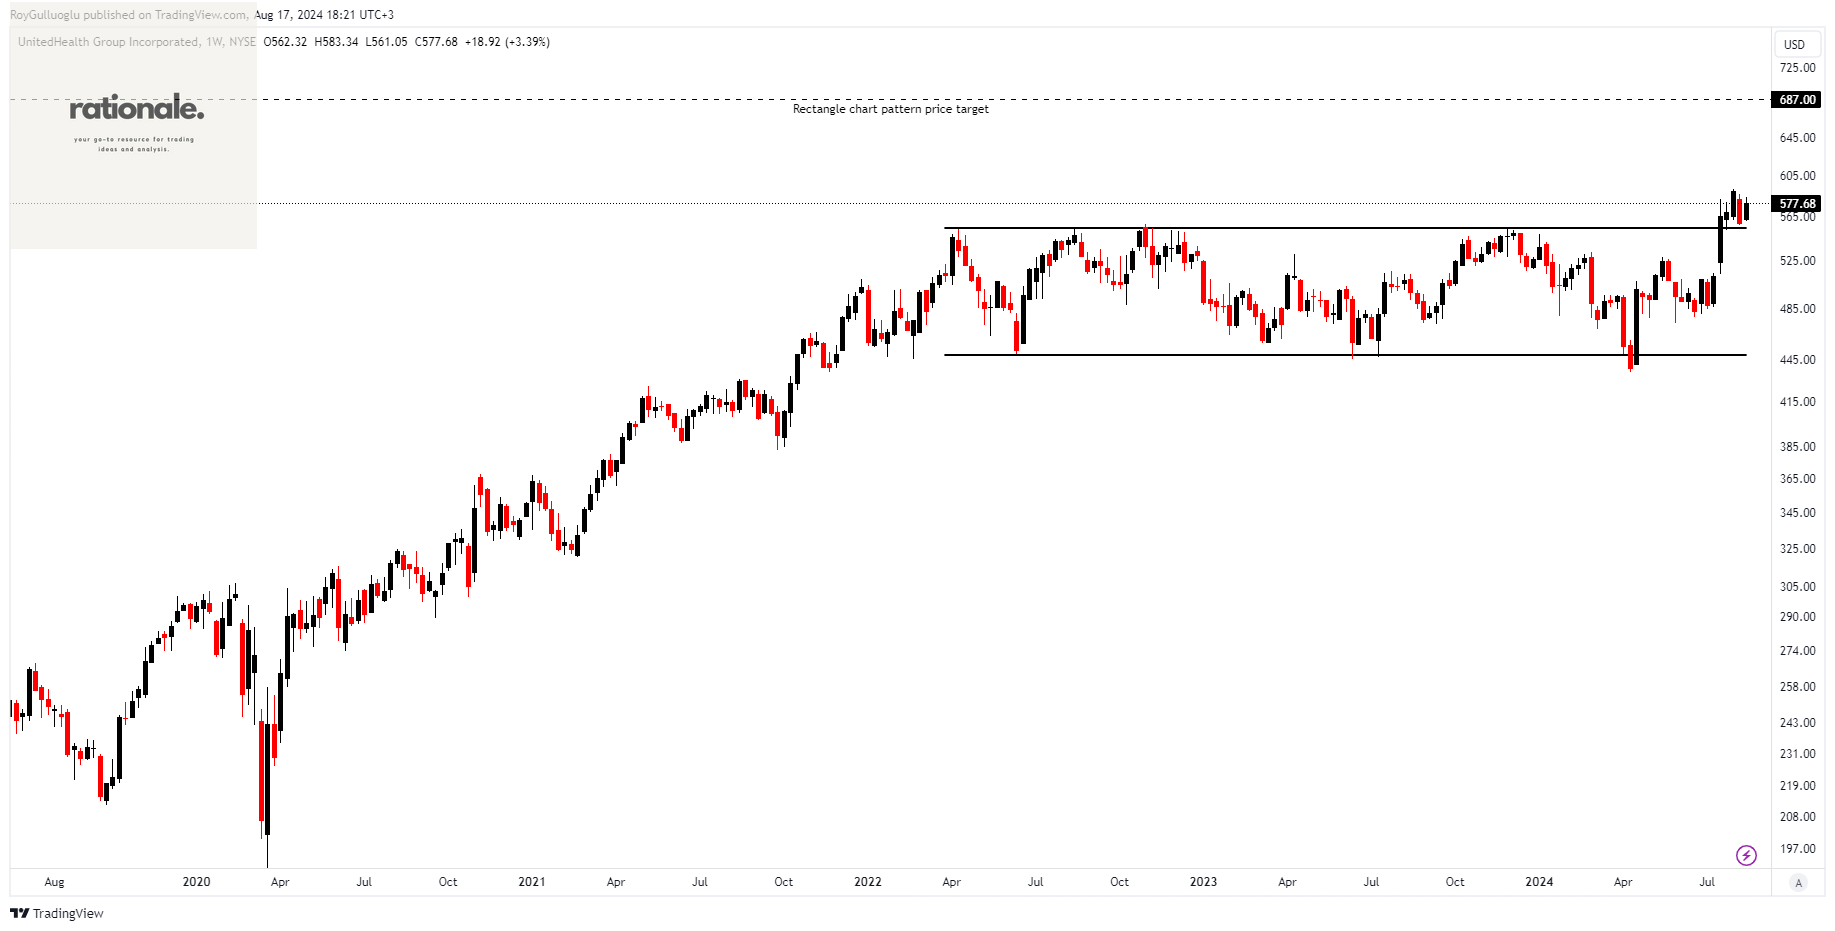
UnitedHealth Group Incorporated operates as a diversified healthcare company in the United States.
The above weekly chart formed an approximately 22-month-long rectangle chart pattern as a bullish reversal after a downtrend.
The horizontal boundary at 554 levels acted as a resistance within this pattern.
A daily close above 570 levels validated the breakout from the 30-month-long rectangle chart pattern.
Based on this chart pattern, the potential price target is 687 levels.
UNH, classified under the "healthcare" sector, falls under the “Large Cap - Value” stock category.
Europen Endustri Insaat Sanayi ve Ticaret A.S.-(EUREN/BIST)-Short Idea
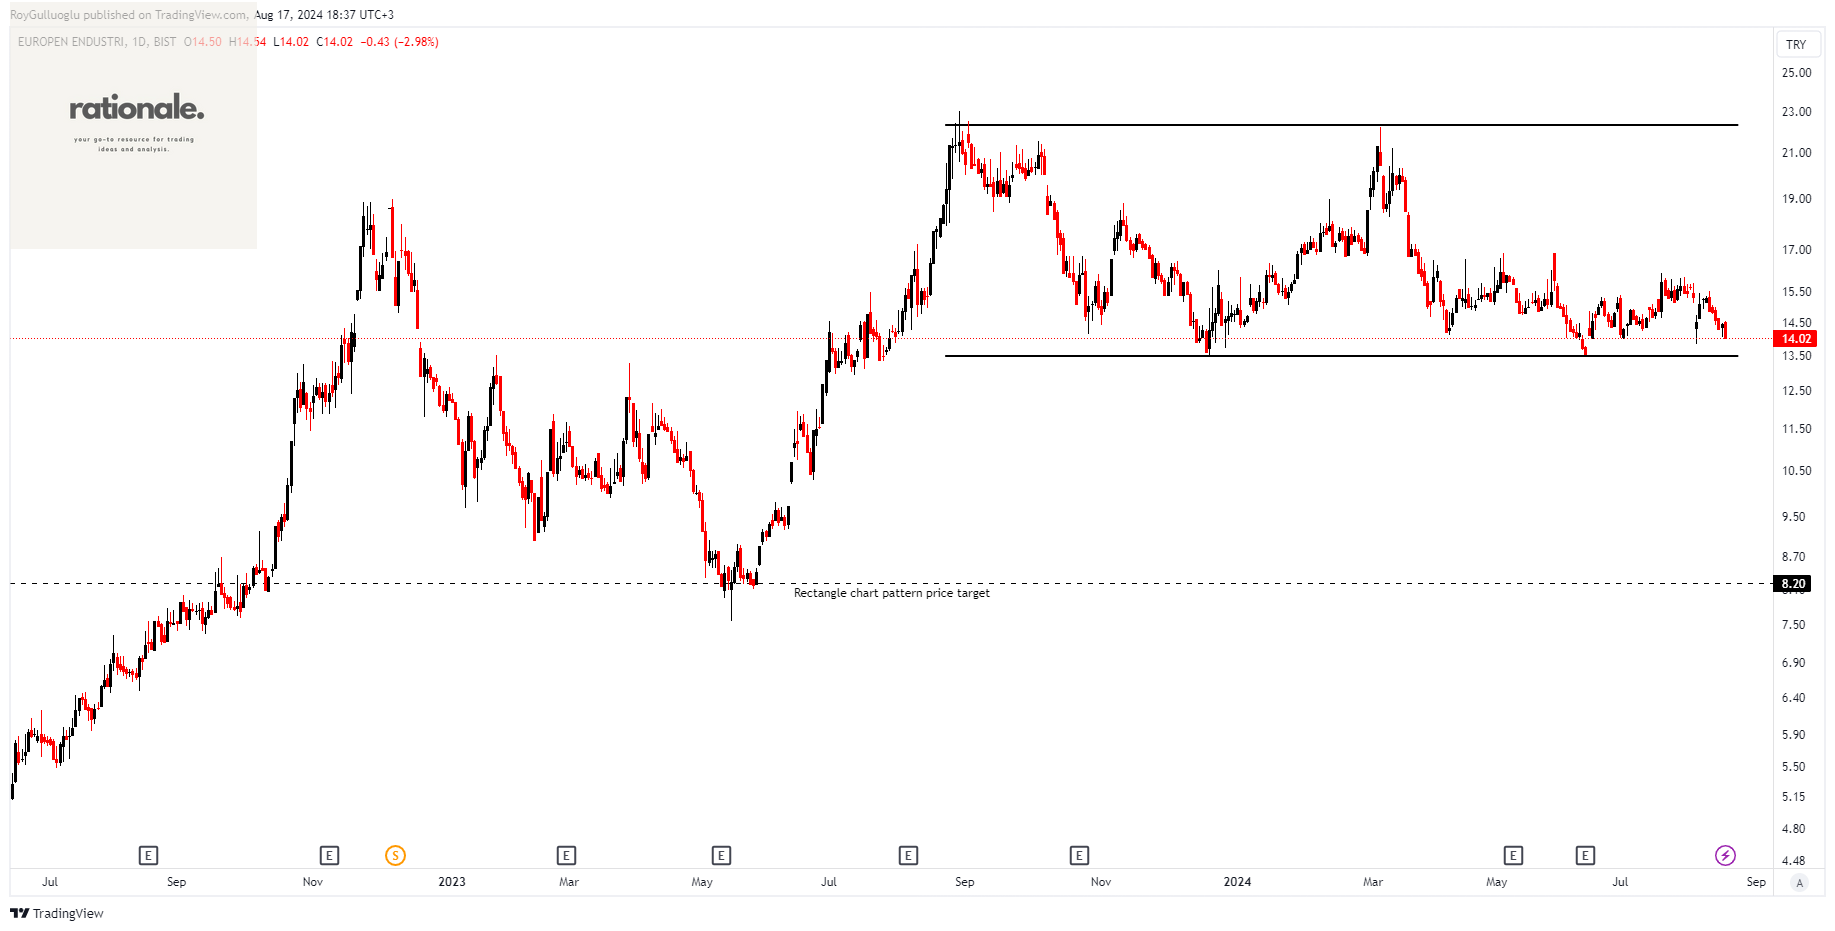
Europen Endustri Insaat Sanayi ve Ticaret A.S. manufactures and wholesales PVC window and door profiles in Turkey.
The above daily chart formed an approximately 8-month-long rectangle chart pattern as a bullish reversal after an uptrend.
The horizontal boundary at 13.49 levels acts as a support within this pattern.
A daily close below 13.08 levels would validate the breakdown from the 8-month-long rectangle chart pattern.
Based on this chart pattern, the potential price target is 8.2 levels.
EUREN, classified under the "industrials" sector, falls under the “Small Cap - Value” stock category.
Sok Marketler Ticaret A.S.-(SOKM/BIST)-Short Idea
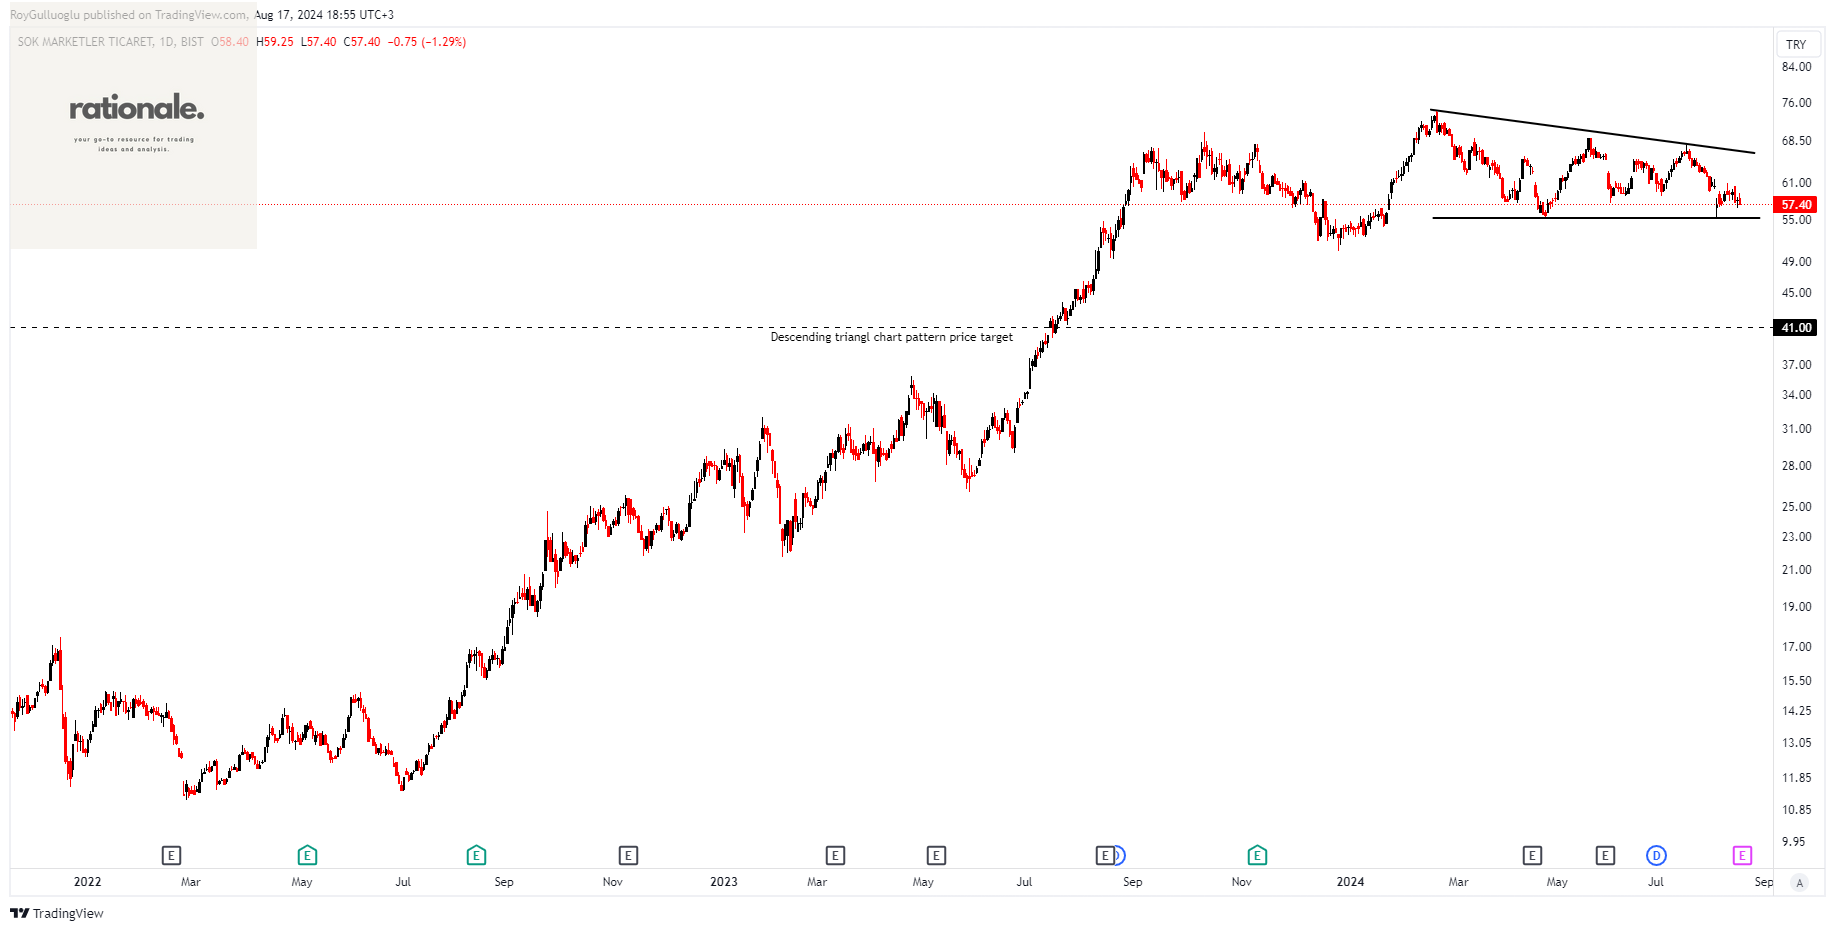
Sok Marketler Ticaret A.S. operates in Turkey's retail sector, selling fast-moving consumer goods.
The above daily chart formed an approximately 4-month-long descending triangle chart pattern as a bullish reversal after an uptrend.
The horizontal boundary at 55.25 levels acts as a support within this pattern.
A daily close below 53.6 levels would validate the breakdown from the 4-month-long descending triangle chart pattern.
Based on this chart pattern, the potential price target is 41 levels.
SOKM, classified under the "consumer cyclical" sector, falls under the “Small Cap - Growth” stock category.
Koza Altin Isletmeleri A.S.-(KOZAL/BIST)-Long Idea
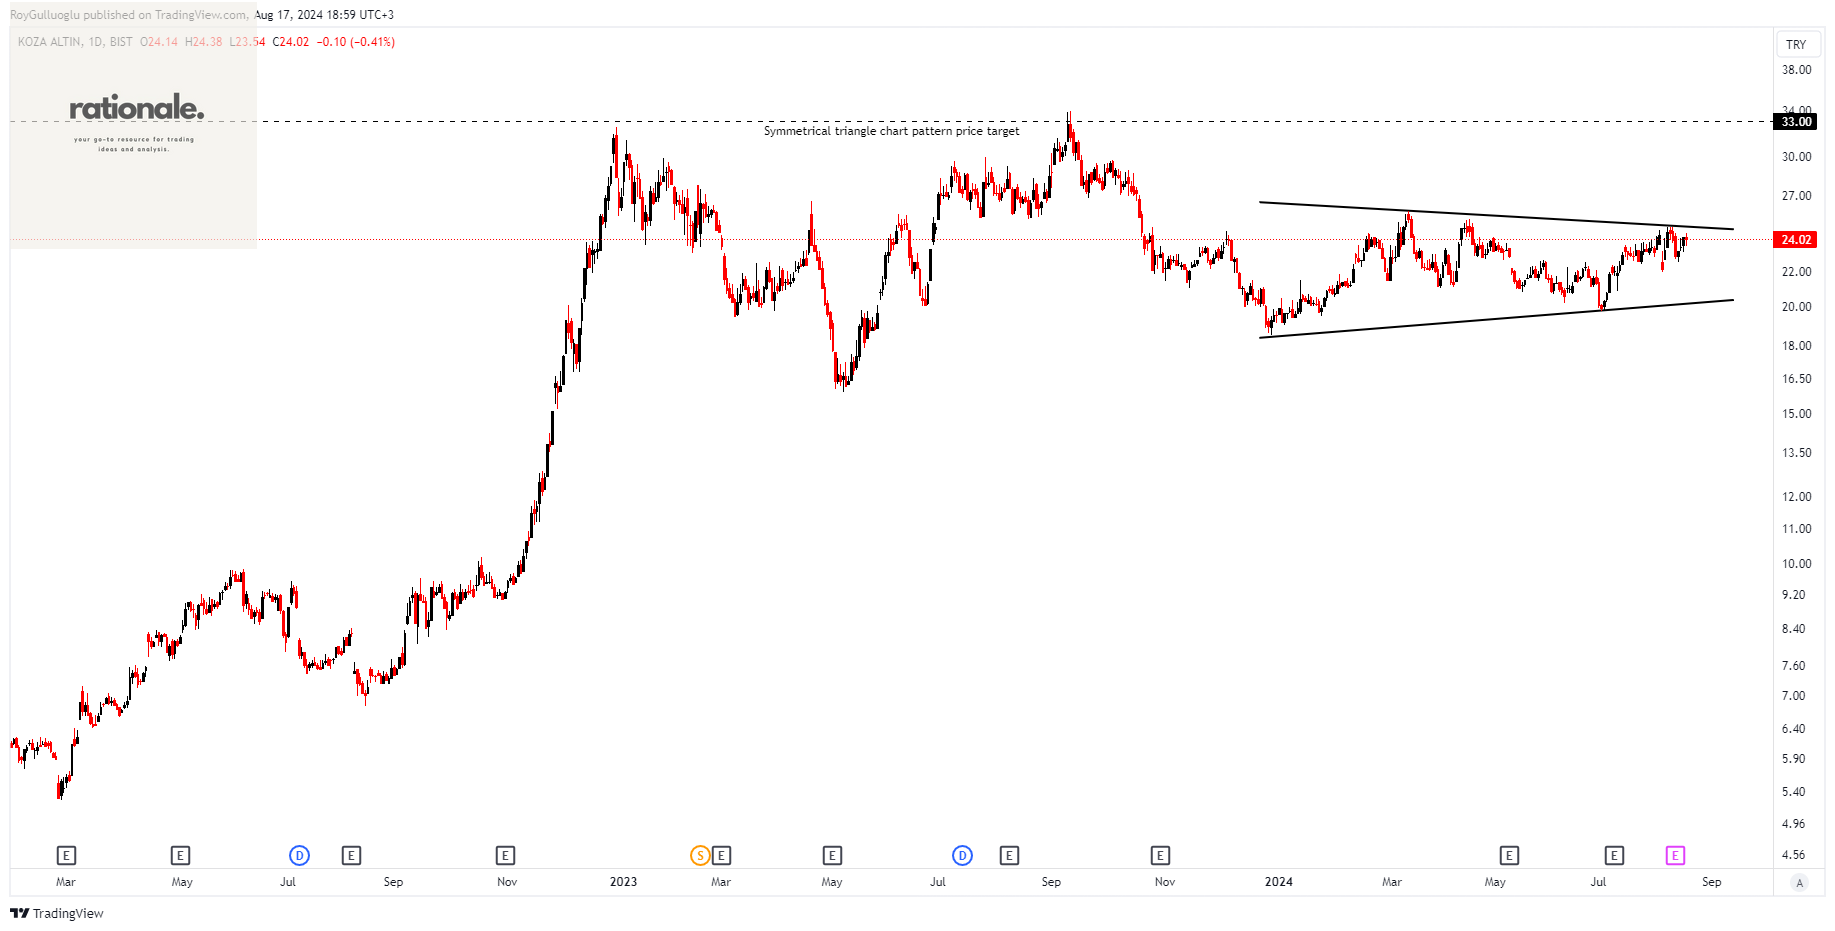
Koza Altın İşletmeleri A.Ş. explores and operates gold mines in Turkey.
The above daily chart formed an approximately 5-month-long symmetrical triangle chart pattern as a bullish reversal after a downtrend.
A daily close above 25.75 levels would validate the breakout from the 5-month-long symmetrical triangle chart pattern.
Based on this chart pattern, the potential price target is 33 levels.
KOZAL, classified under the "basic materials" sector, falls under the “Mid Cap - Value” stock category.
ALK-Abelló A/S-(ALK.B/OMXCOP)-Long Idea
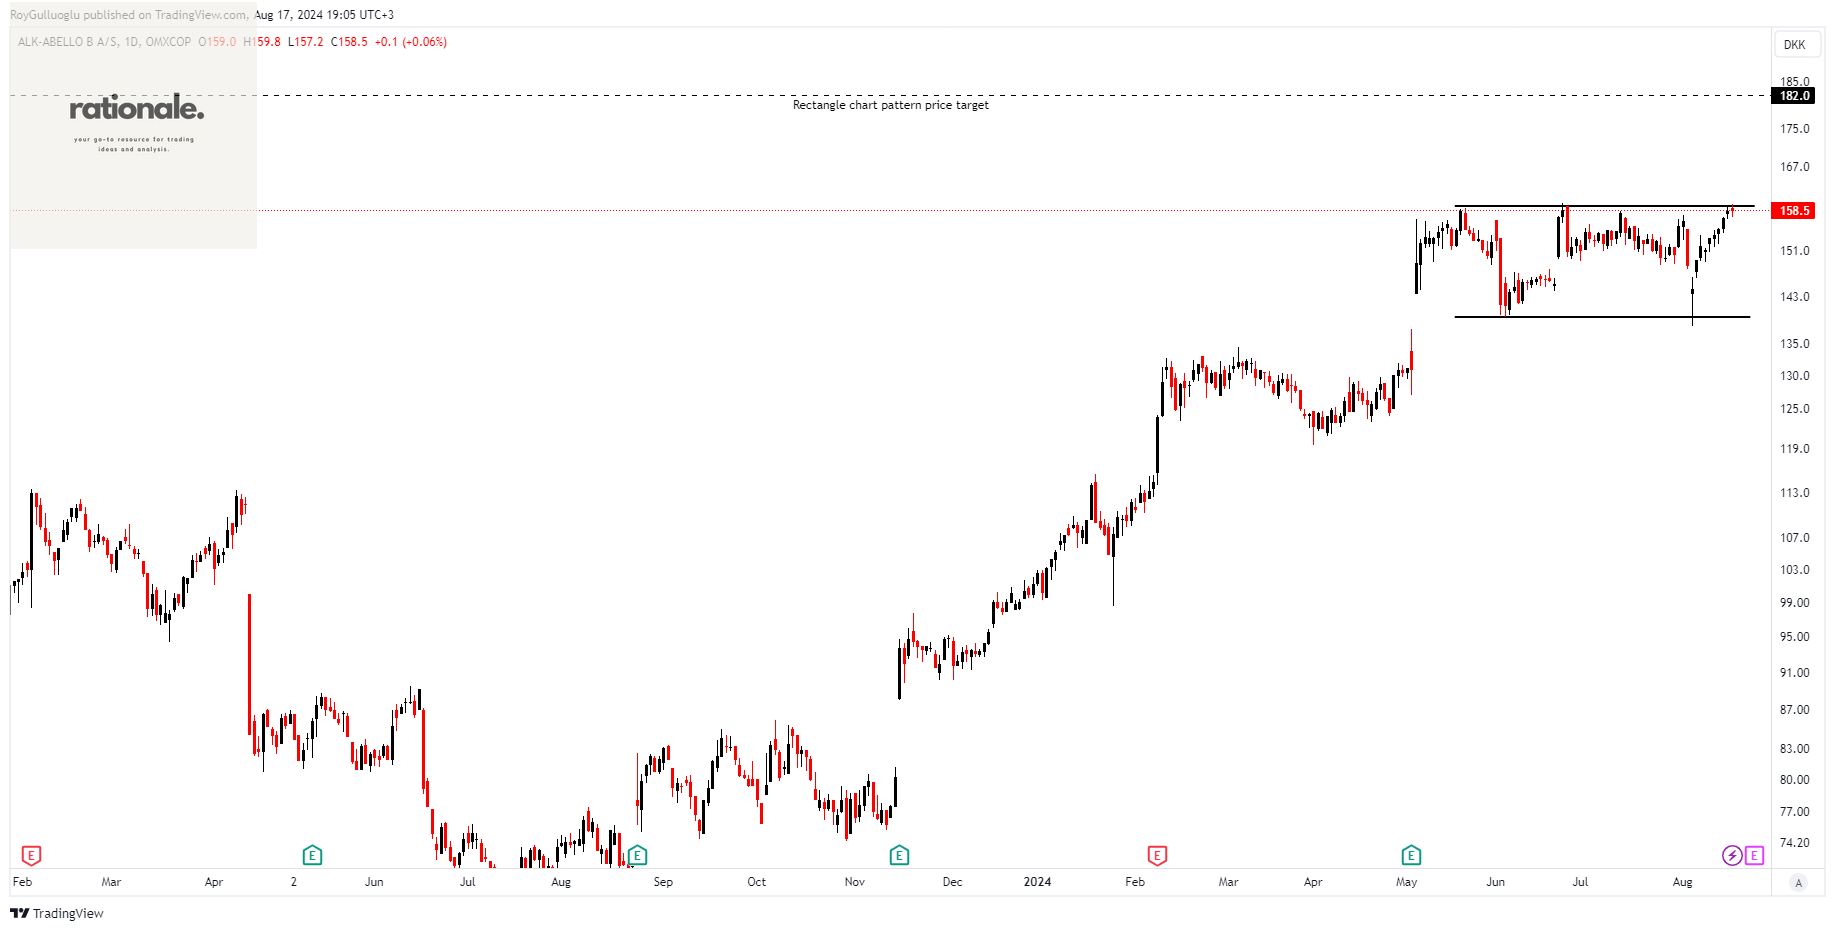
ALK-Abelló A/S is an allergy solutions company operating in Europe, North America, and internationally.
The above daily chart formed an approximately 2-month-long rectangle chart pattern as a bullish continuation after an uptrend.
The horizontal boundary at 159.3 levels acts as a resistance within this pattern.
A daily close above 164 levels would validate the breakout from the 2-month-long rectangle chart pattern.
Based on this chart pattern, the potential price target is 182 levels.
ALK.B, classified under the "healthcare" sector, falls under the “Mid Cap - Value” stock category.
Teşekkürler Roy