


New setups
TICKERS: DKS(NYSE), KNF(NYSE), SHOO(NASDAQ), BWB(NASDAQ), APGE(NASDAQ), INVES(BIST), CIMSA(BIST), SCHO(OMXCOP), MATAS(OMXCOP), AOJ(OMXCOP), HUSCO(OMXCOP)
DICK'S Sporting Goods, Inc.-(DKS/NYSE)-Long Idea
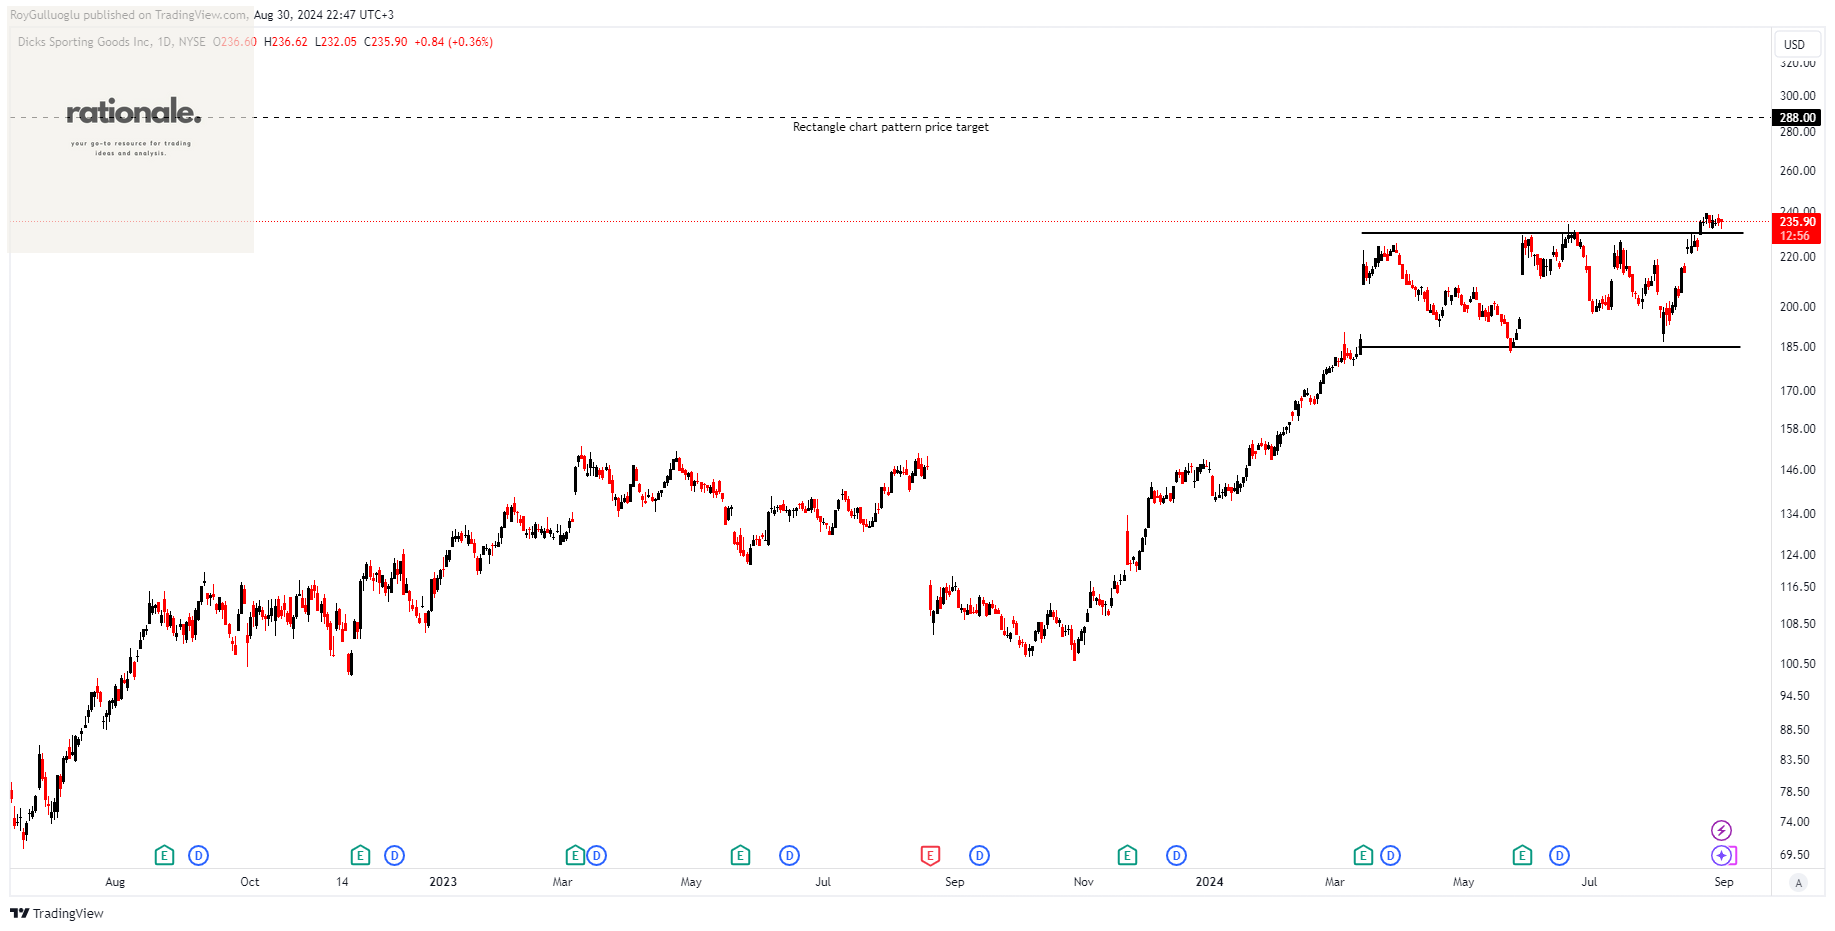
DICK'S Sporting Goods, Inc., along with its subsidiaries, operates as an omni-channel retailer of sporting goods, primarily serving the United States.
The above daily chart formed an approximately 3-month-long rectangle chart pattern as a bullish continuation after an uptrend.
The horizontal boundary at 230.32 levels acted as a resistance within this pattern.
A daily close above 237.23 levels validated the breakout from the 3-month-long rectangle chart pattern.
Based on this chart pattern, the potential price target is 288 levels.
DKS, classified under the "consumer cyclical" sector, falls under the “Large Cap - Growth” stock category.
Knife River Corporation-(KNF/NYSE)-Long Idea
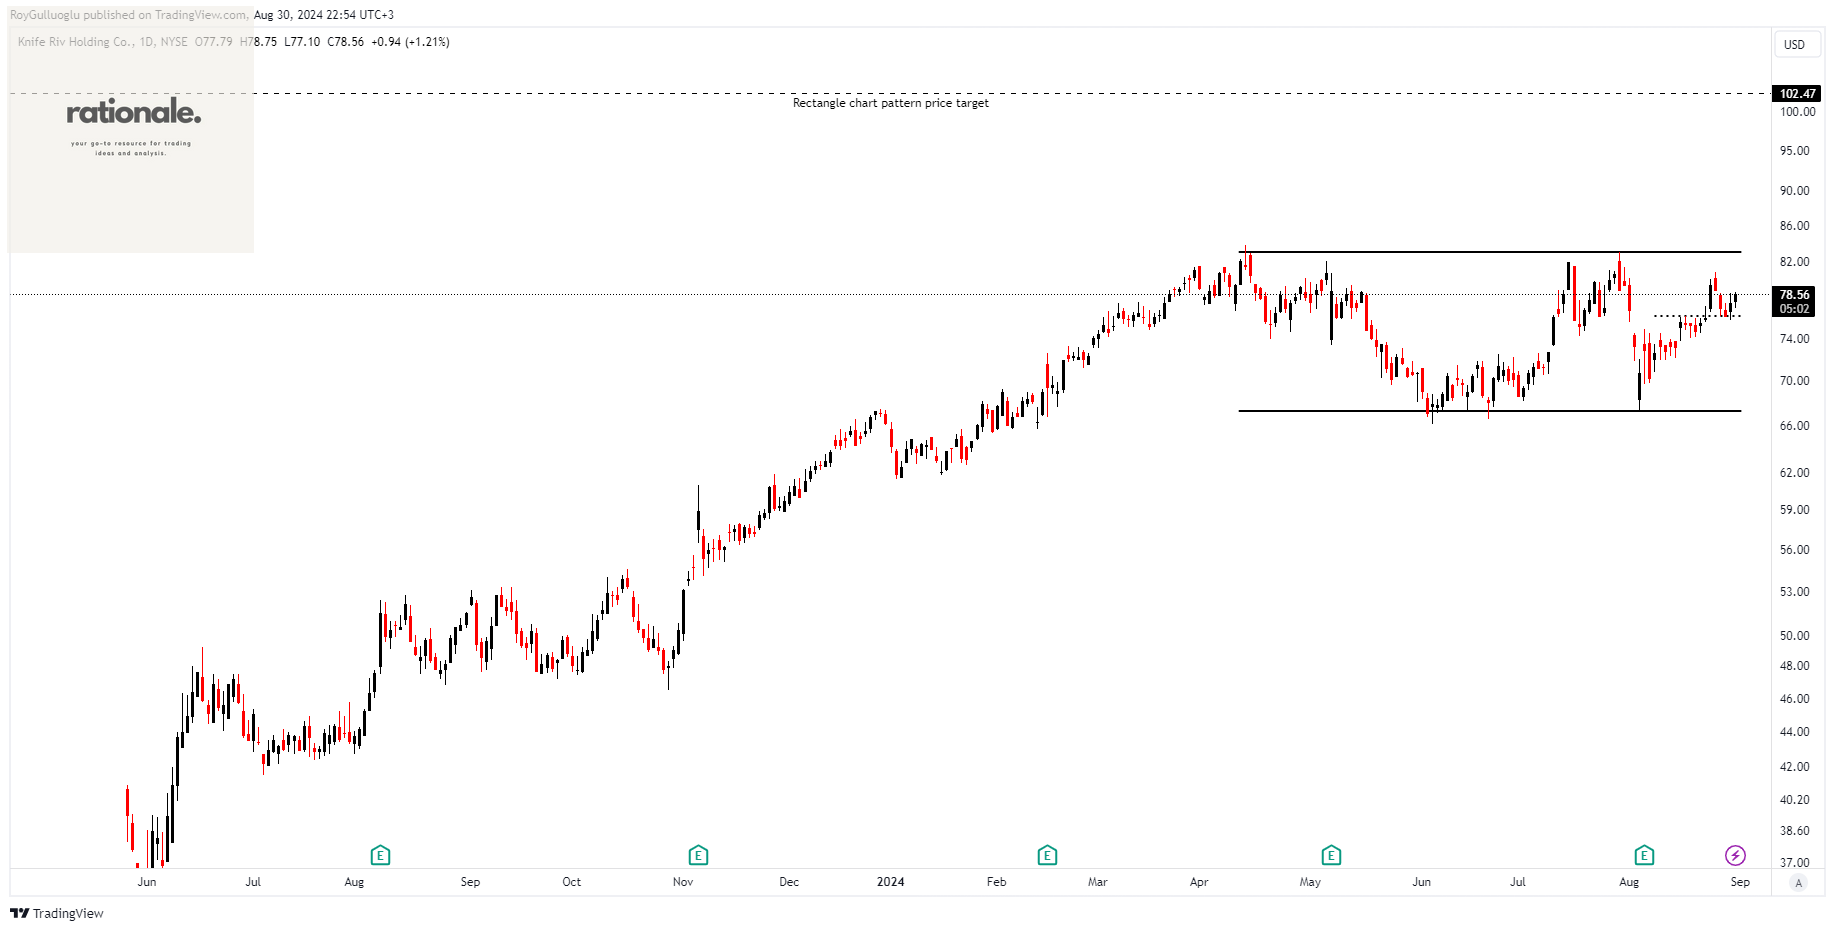
Knife River Corporation, along with its subsidiaries, offers aggregate-focused construction materials and contracting services across the United States.
The above daily chart formed an approximately 3-month-long rectangle chart pattern as a bullish continuation after an uptrend.
The horizontal boundary at 83 levels acts as a resistance within this pattern.
A daily close above 85.49 levels would validate the breakout from the 3-month-long rectangle chart pattern.
Based on this chart pattern, the potential price target is 102.47 levels.
KNF, classified under the "basic materials" sector, falls under the “Mid Cap - Value” stock category.
Steven Madden, Ltd.-(SHOO/NASDAQ)-Long Idea
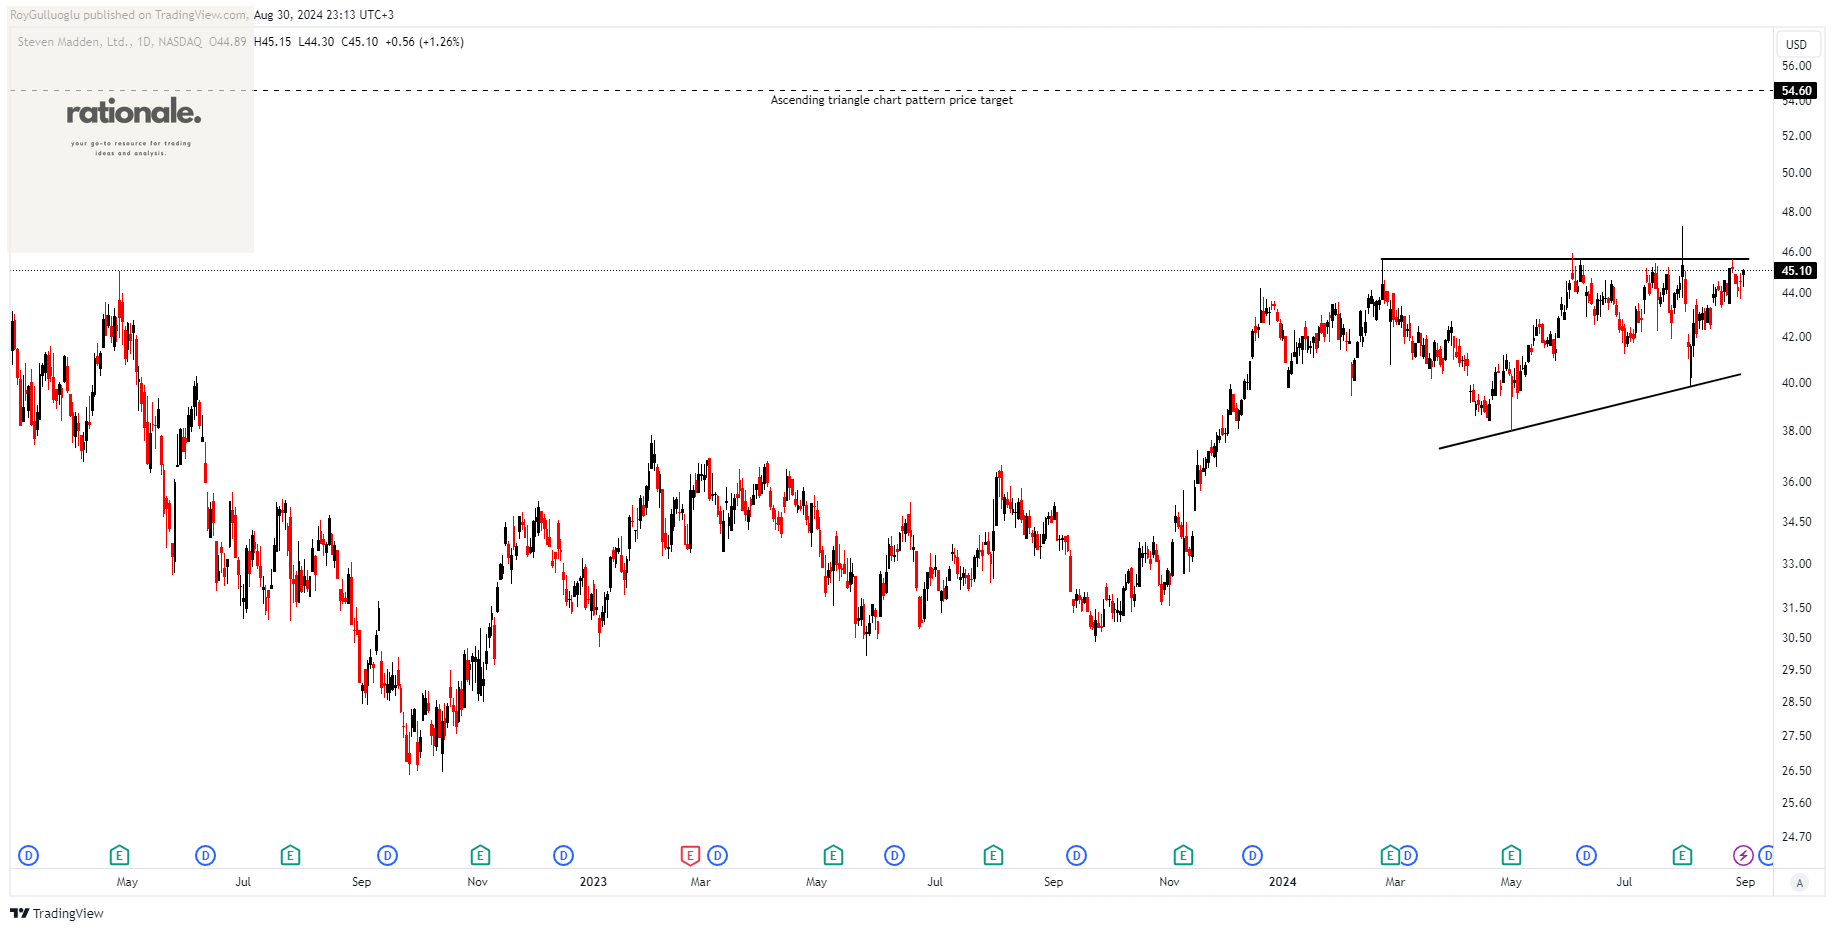
Steven Madden, Ltd. designs, sources, and markets fashion-forward footwear, accessories, and apparel under both branded and private labels in the United States and globally.
The above daily chart formed an approximately 4-month-long ascending triangle chart pattern as a bullish continuation after an uptrend.
The horizontal boundary at 45.63 levels acts as a resistance within this pattern.
A daily close above 47 levels would validate the breakout from the 4-month-long ascending triangle chart pattern.
Based on this chart pattern, the potential price target is 54.6 levels.
SHOO, classified under the "consumer cyclical" sector, falls under the “Mid Cap - Growth” stock category.
Bridgewater Bancshares, Inc.-(BWB/NASDAQ)-Long Idea
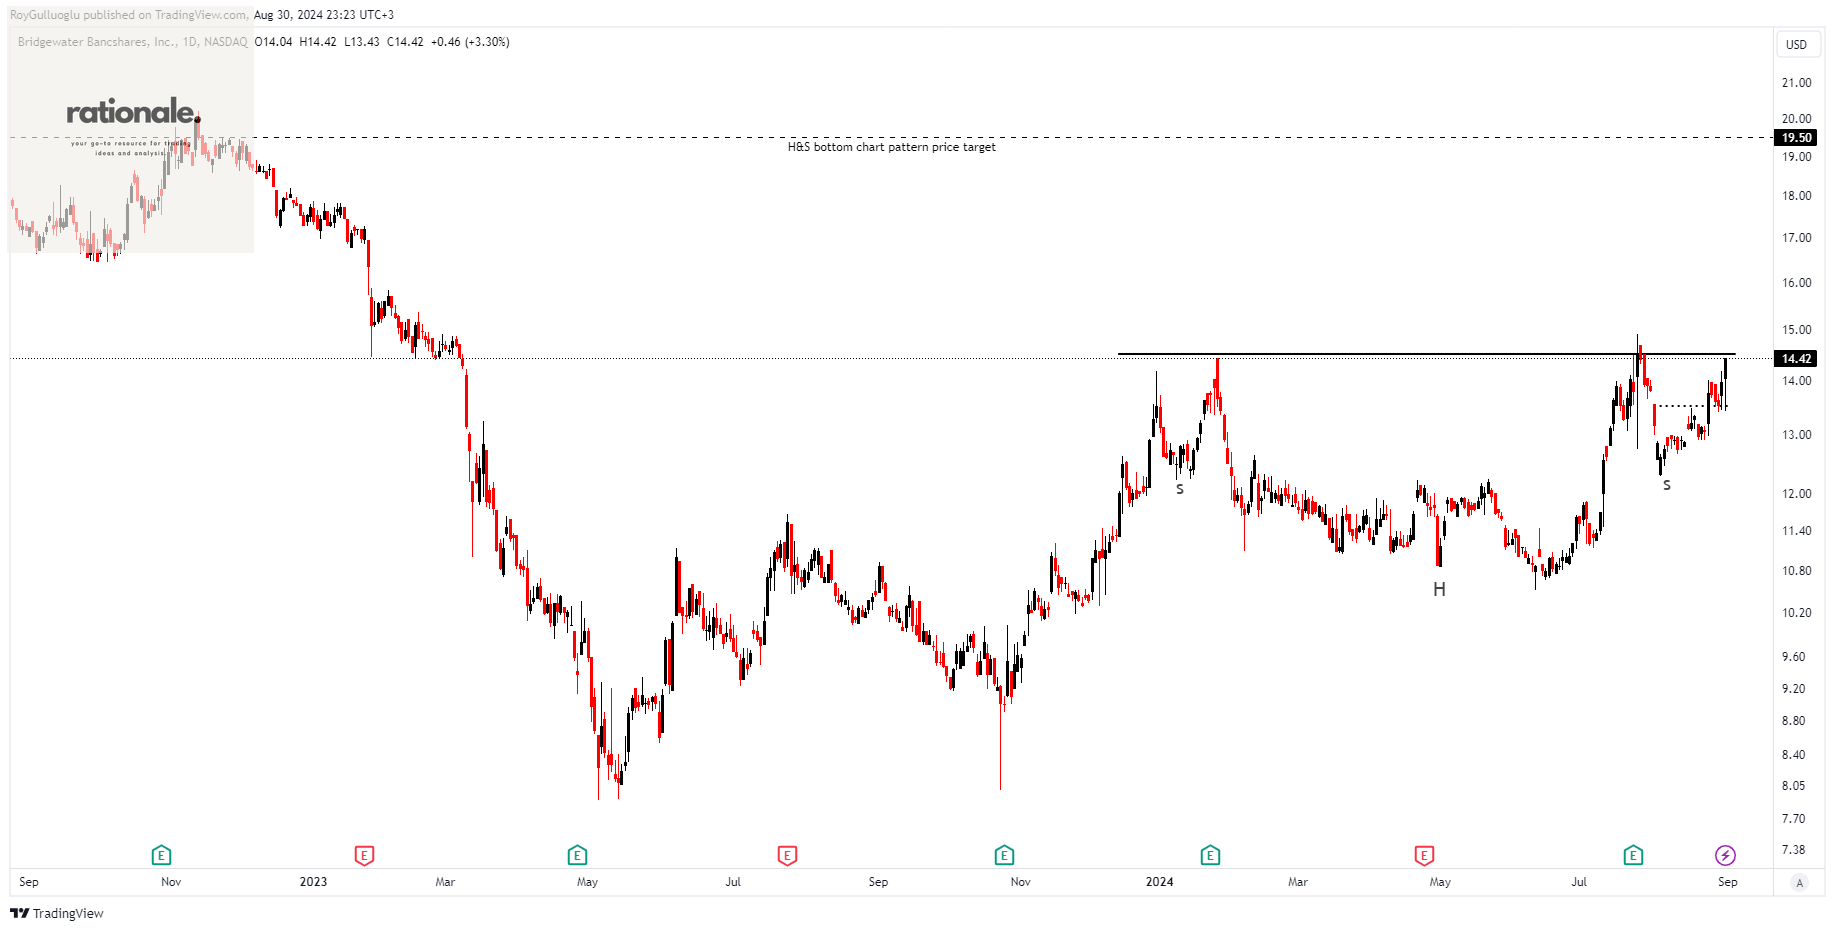
Bridgewater Bancshares, Inc. is a financial holding company that provides banking products and services through its subsidiary, Bridgewater Bank, primarily in the United States.
The above weekly chart formed an approximately 5-month-long H&S continuation chart pattern as a bullish continuation after an uptrend.
The horizontal boundary at 14.5 levels acts as a resistance within this pattern.
A daily close above 14.935 levels would validate the breakout from the 5-month-long H&S continuation chart pattern.
Based on this chart pattern, the potential price target is 19.5 levels.
BWB, classified under the "financial services" sector, falls under the “Small Cap - Income” stock category.
Apogee Therapeutics, Inc.-(APGE/NASDAQ)-Long Idea
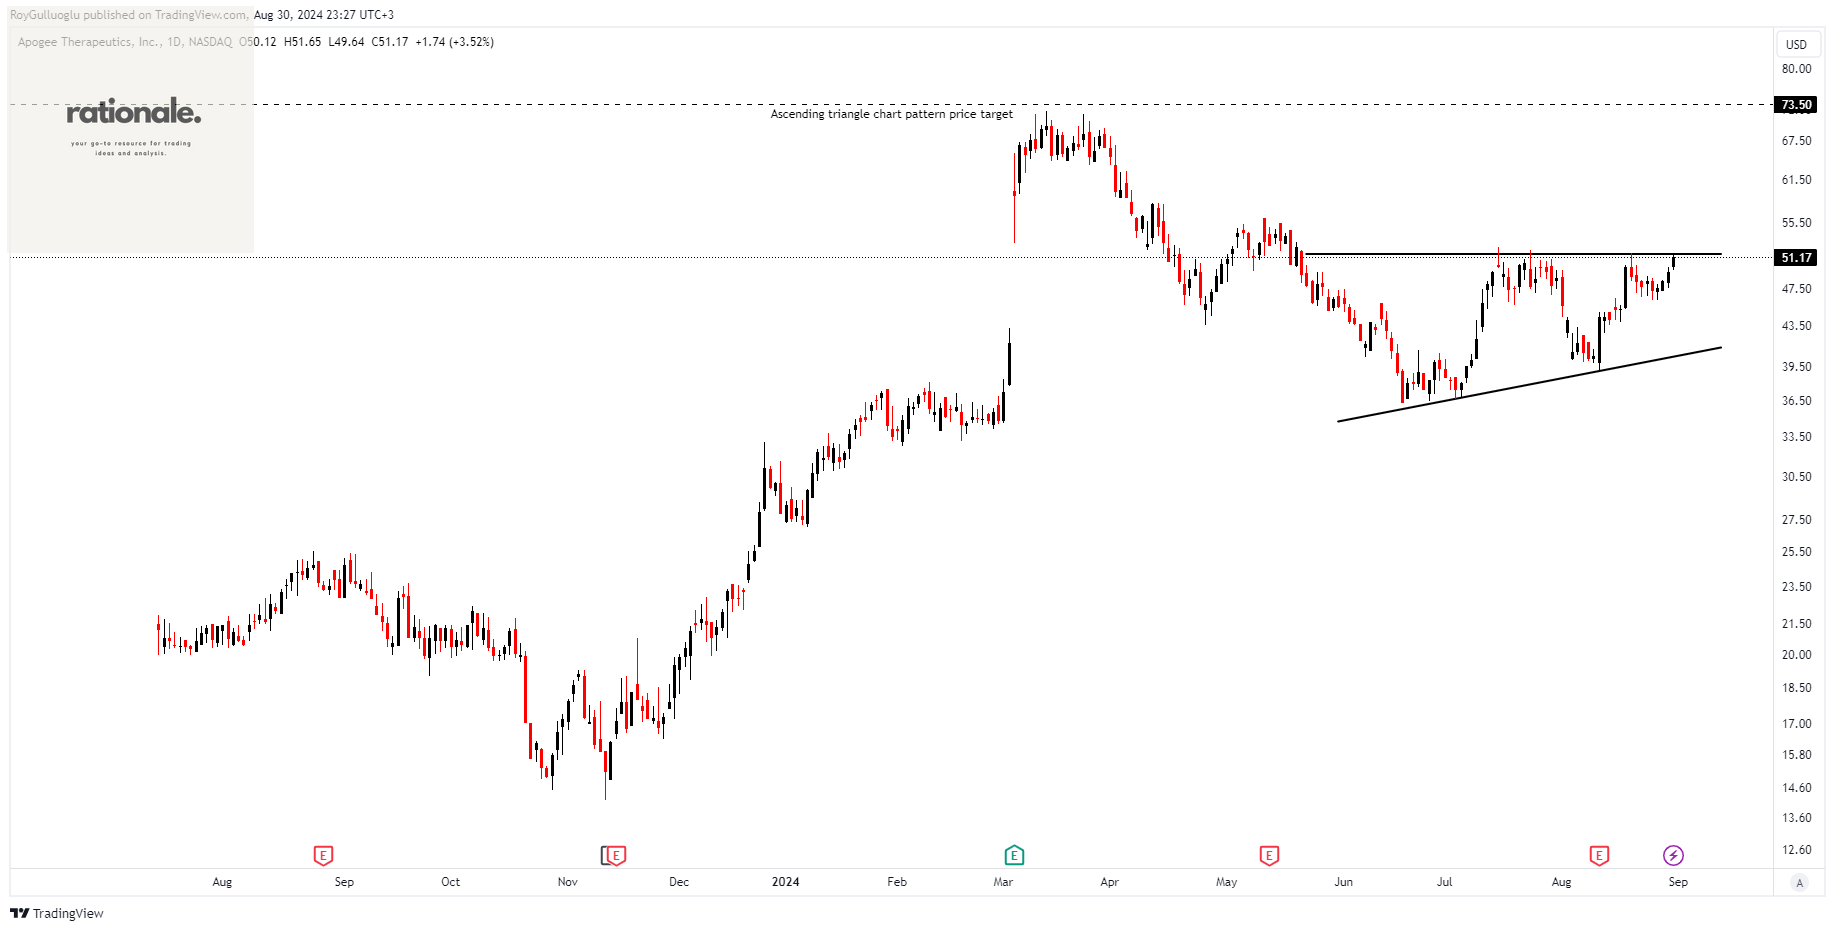
Apogee Therapeutics, Inc., through its subsidiary, operates as a biotechnology company focused on developing biologics for the treatment of atopic dermatitis (AD), asthma, chronic obstructive pulmonary disease (COPD), and other related inflammatory and immunological conditions.
The above daily chart formed an approximately 2-month-long ascending triangle chart pattern as a bullish reversal after a downtrend.
The horizontal boundary at 51.5 levels acts as a resistance within this pattern.
A daily close above 53.045 levels would validate the breakout from the 2-month-long ascending triangle chart pattern.
Based on this chart pattern, the potential price target is 73.5 levels.
APGE, classified under the "healthcare" sector, falls under the “Mid Cap - Value” stock category.
Investco Holding A.S.-(INVES/BIST)-Long Idea
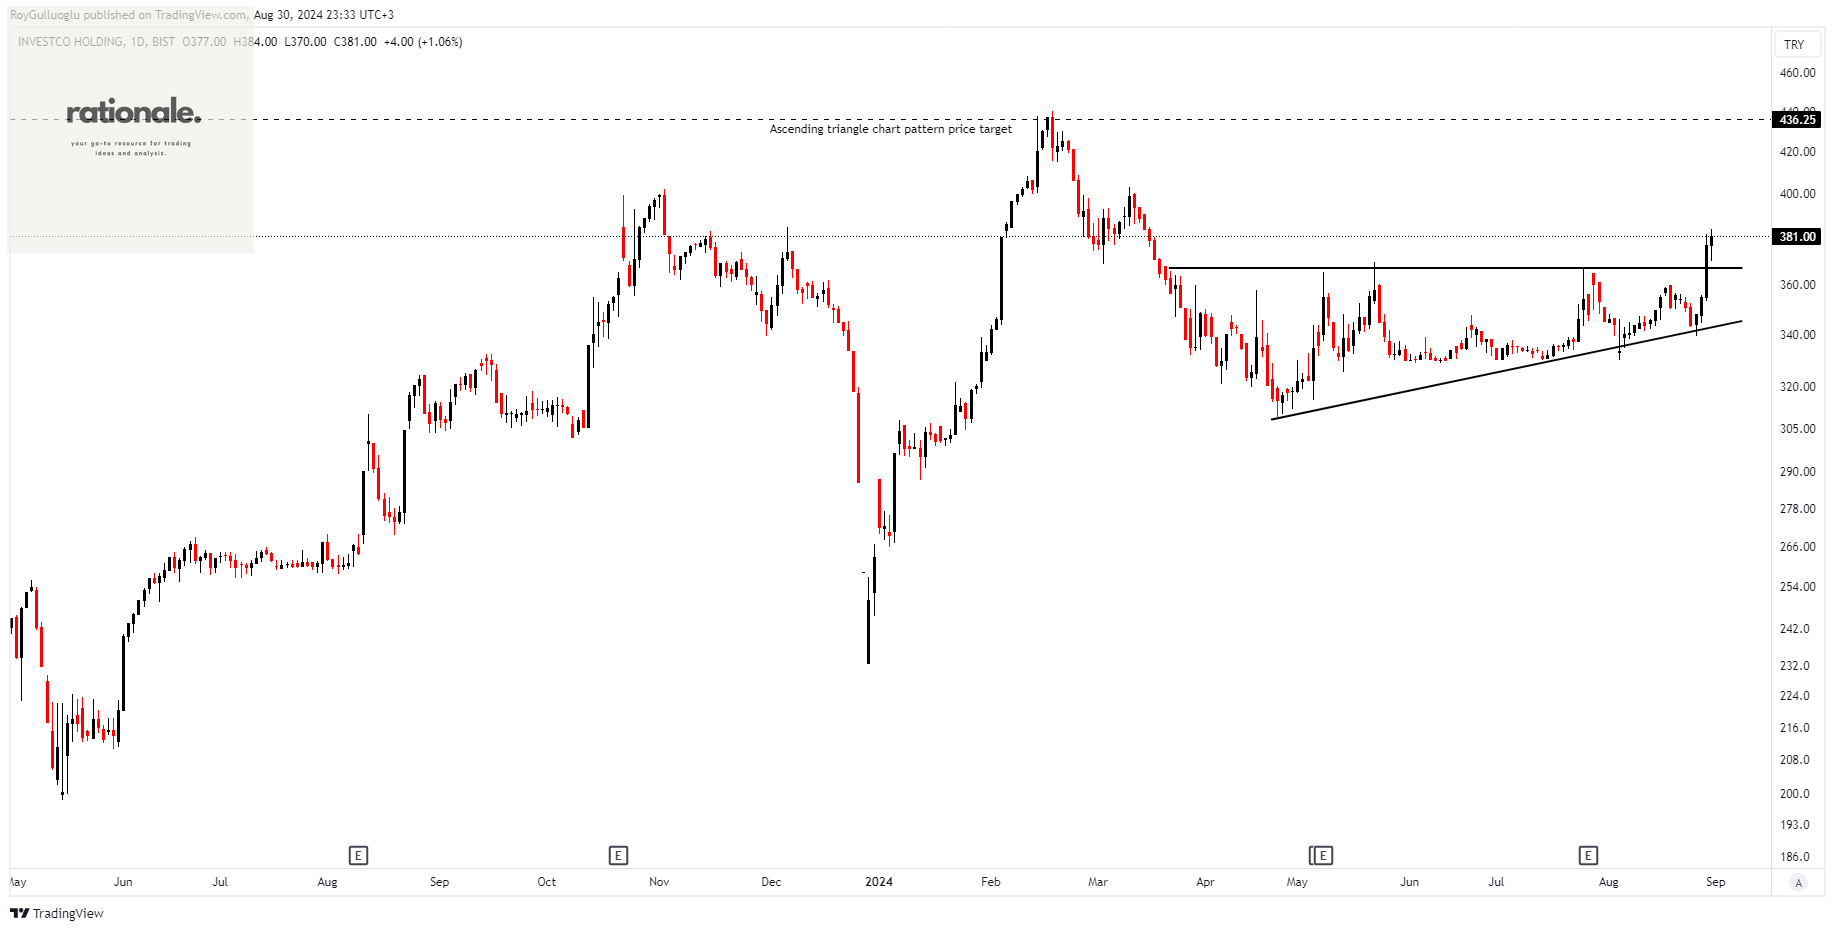
Investco Holding A.S. operates as an investment company in Turkey, focusing on investments in companies across various industries, including renewable energy, mining, chemistry, iron and steel, technology and software, venture capital, food, and healthcare.
The above daily chart formed an approximately 3-month-long ascending triangle chart pattern as a bullish reversal after a downtrend.
The horizontal boundary at 367 levels acted as a resistance within this pattern.
A daily close above 378 levels validated the breakout from the 3-month-long ascending triangle chart pattern.
Based on this chart pattern, the potential price target is 436.25levels.
INVES, classified under the "financial services" sector, falls under the “Mid Cap - Income” stock category.
Çimsa Çimento Sanayi ve Ticaret A.S.-(CIMSA/BIST)-Long Idea
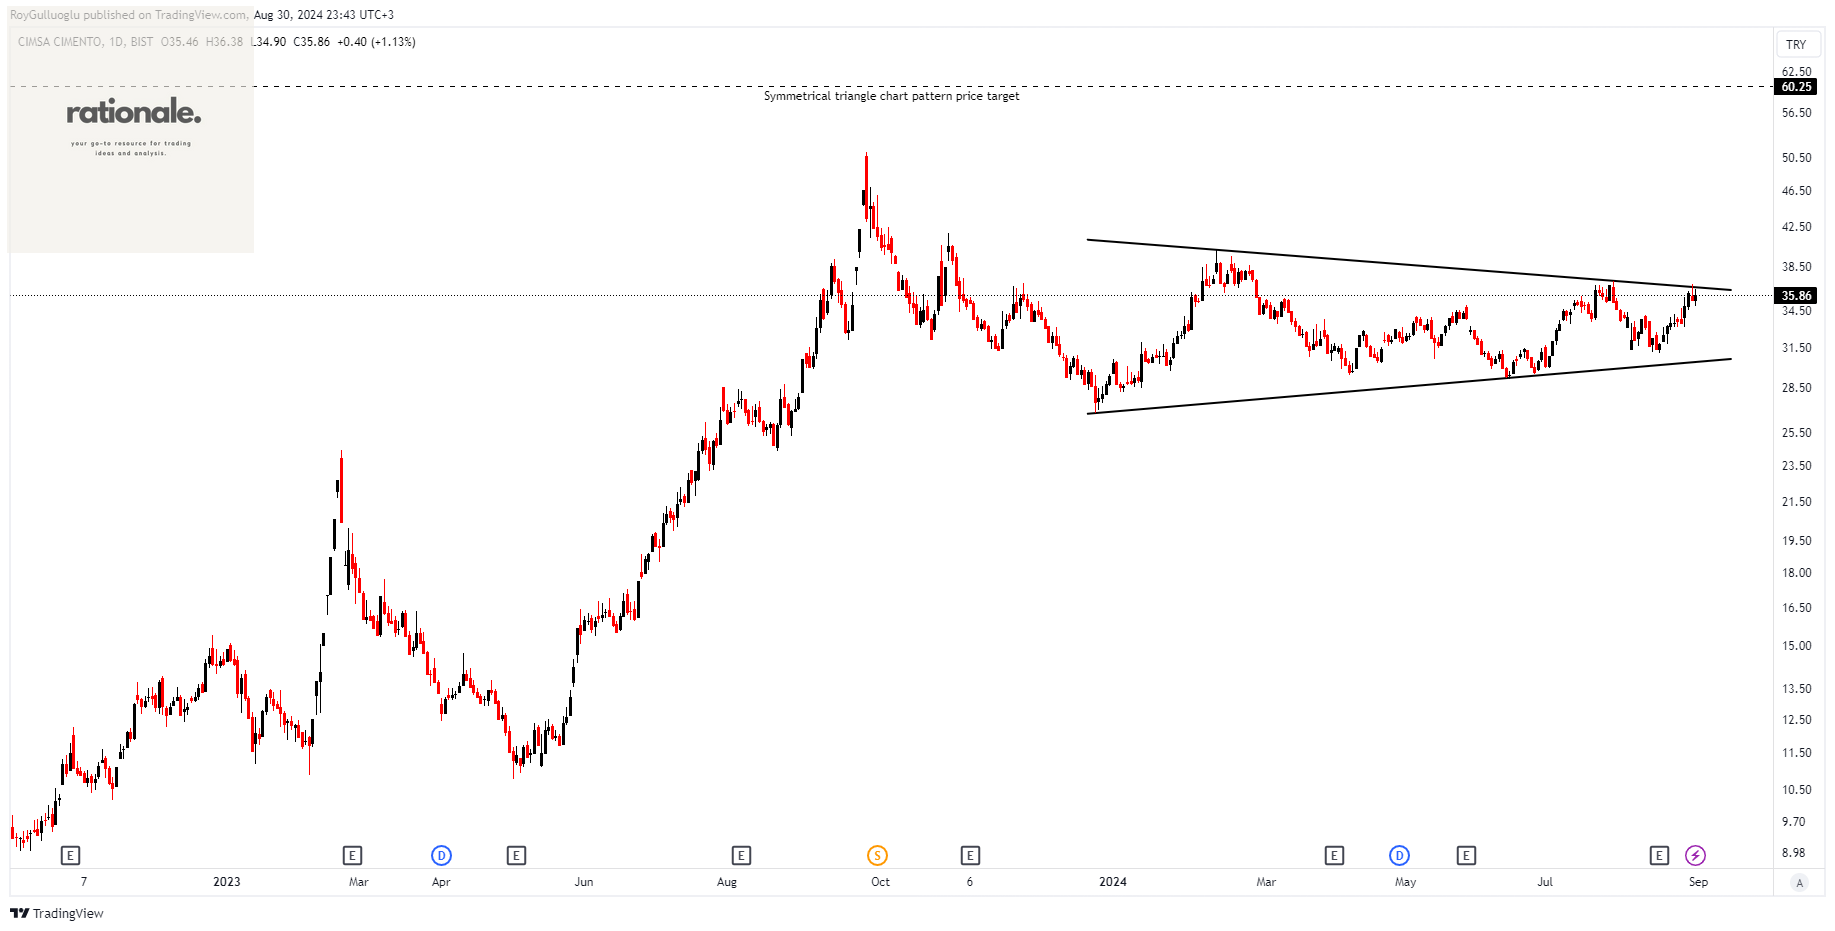
Çimsa Çimento Sanayi ve Ticaret A.S. manufactures and sells cement, clinker, and ready-mix concrete in Turkey.
The above daily chart formed an approximately 5-month-long symmetrical triangle chart pattern as a bullish reversal after a downtrend.
The horizontal boundary at 36.85 levels acts as a resistance within this pattern.
A daily close above 37.95 levels would validate the breakout from the 5-month-long symmetrical triangle chart pattern.
Based on this chart pattern, the potential price target is 60.25 levels.
CIMSA, classified under the "basic materials" sector, falls under the “Small Cap - Value” stock category.
Schouw & Co A/S-(SCHO/OMXCOP)-Long Idea
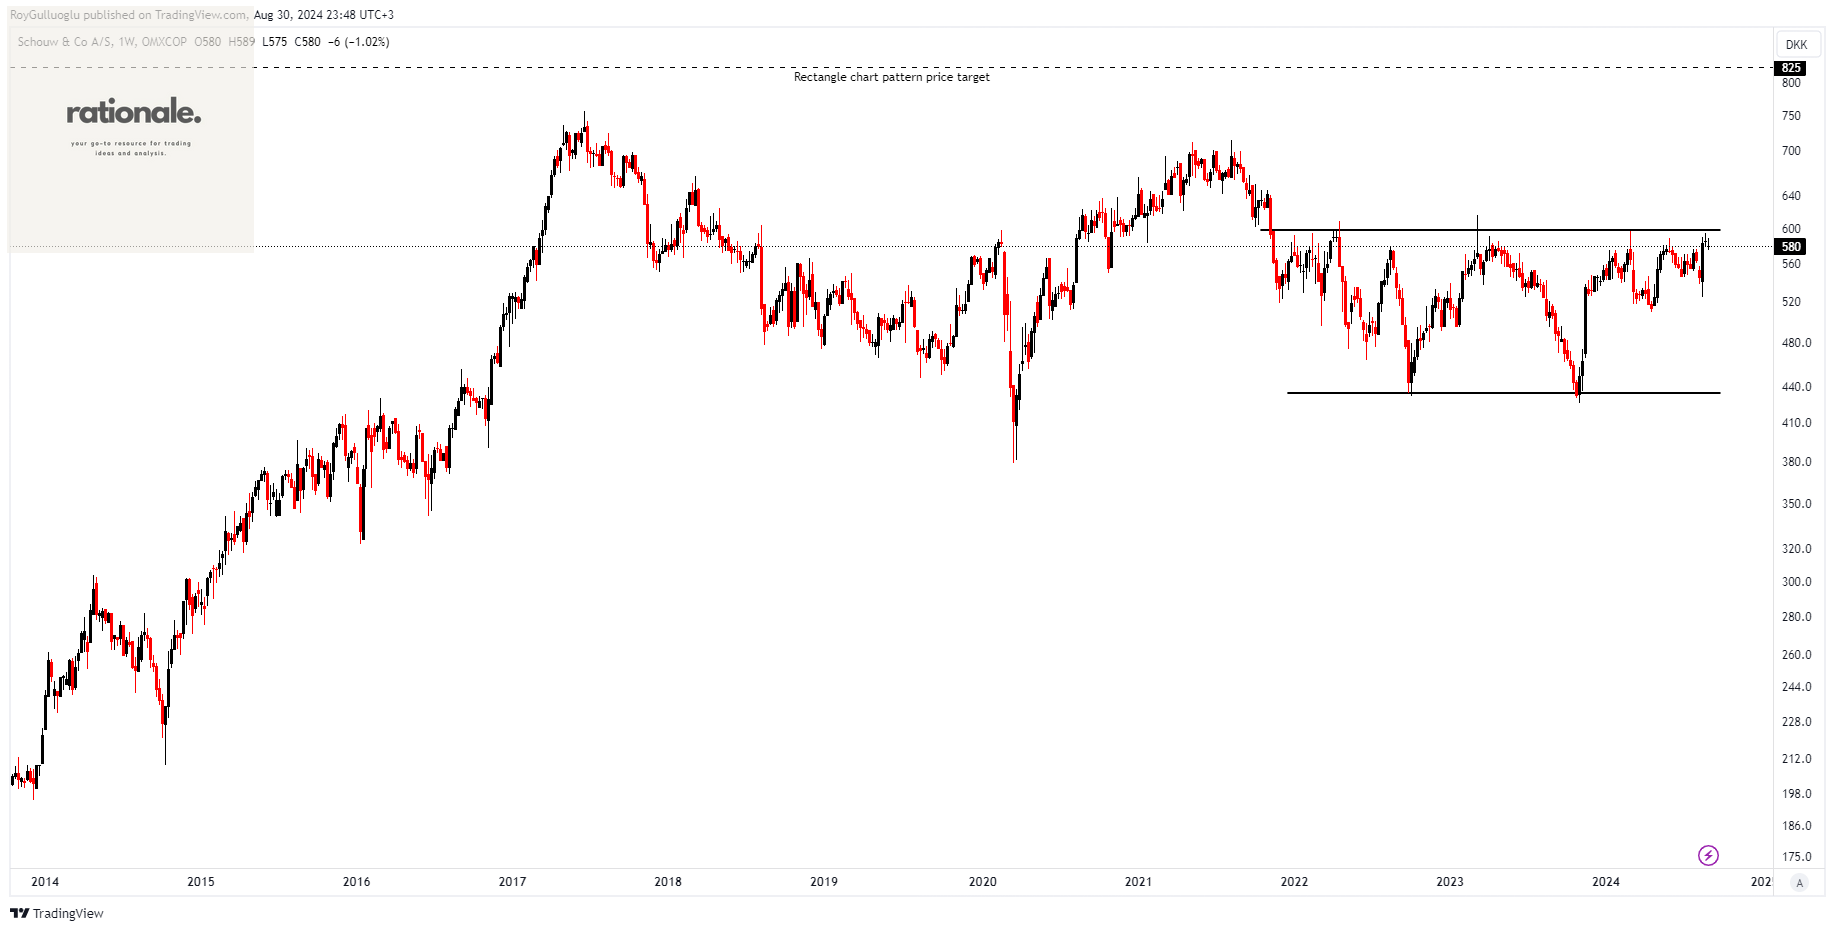
Schouw & Co A/S owns and operates Danish industrial businesses. It operates through various segments, including BioMar, Fibertex Personal Care, Fibertex Nonwovens, HydraSpecma, Borg Automotive, and GPV.
The above weekly chart formed an approximately 30-month-long symmetrical triangle chart pattern as a bullish reversal after a downtrend.
The horizontal boundary at 598 levels acts as a resistance within this pattern.
A daily close above 615 levels would validate the breakout from the 30-month-long symmetrical triangle chart pattern.
Based on this chart pattern, the potential price target is 825 levels.
SCHO, classified under the "industrials" sector, falls under the “Small Cap - Value” stock category.
Matas A/S-(MATAS/OMXCOP)-Long Idea
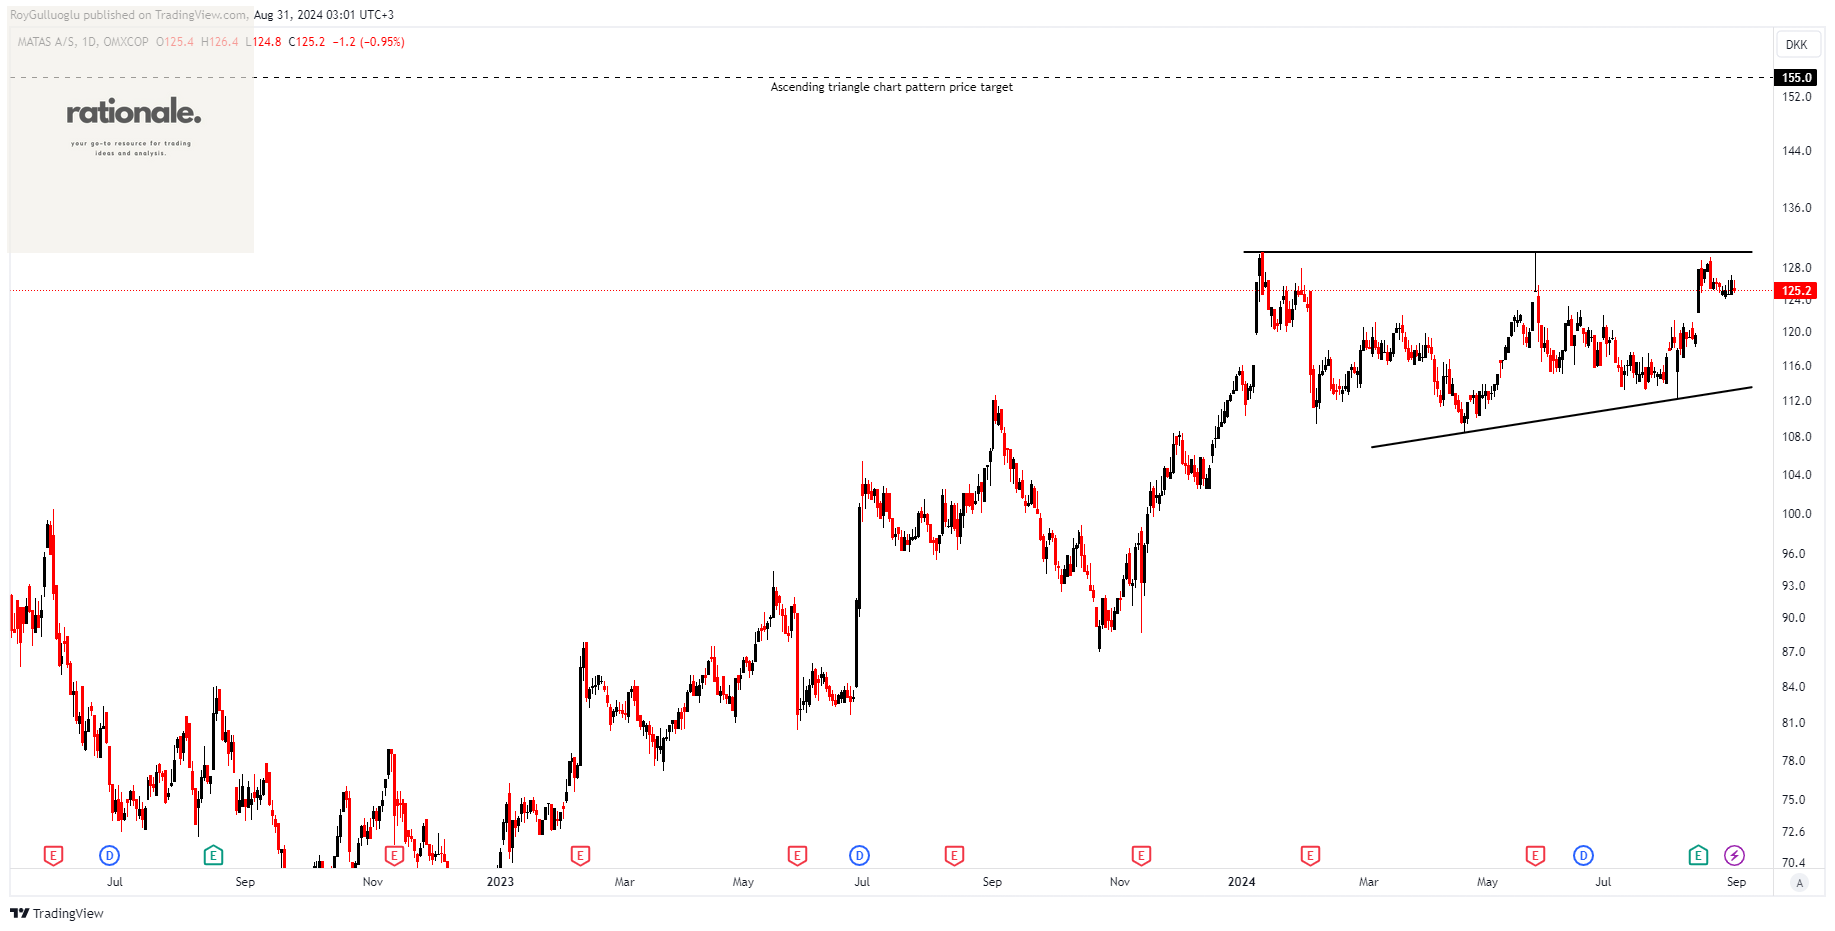
Matas A/S operates a chain of retail stores in Denmark, offering beauty, personal care, health and wellness, and household products.
The above daily chart formed an approximately 5-month-long ascending triangle chart pattern as a bullish continuation after an uptrend.
The horizontal boundary at 130 levels acts as a resistance within this pattern.
A daily close above 133.9 levels would validate the breakout from the 5-month-long ascending triangle chart pattern.
Based on this chart pattern, the potential price target is 155 levels.
MATAS, classified under the "consumer cyclical" sector, falls under the “Small Cap - Growth” stock category.
Brødrene A & O Johansen A/S -(AOJ/OMXCOP)-Long Idea
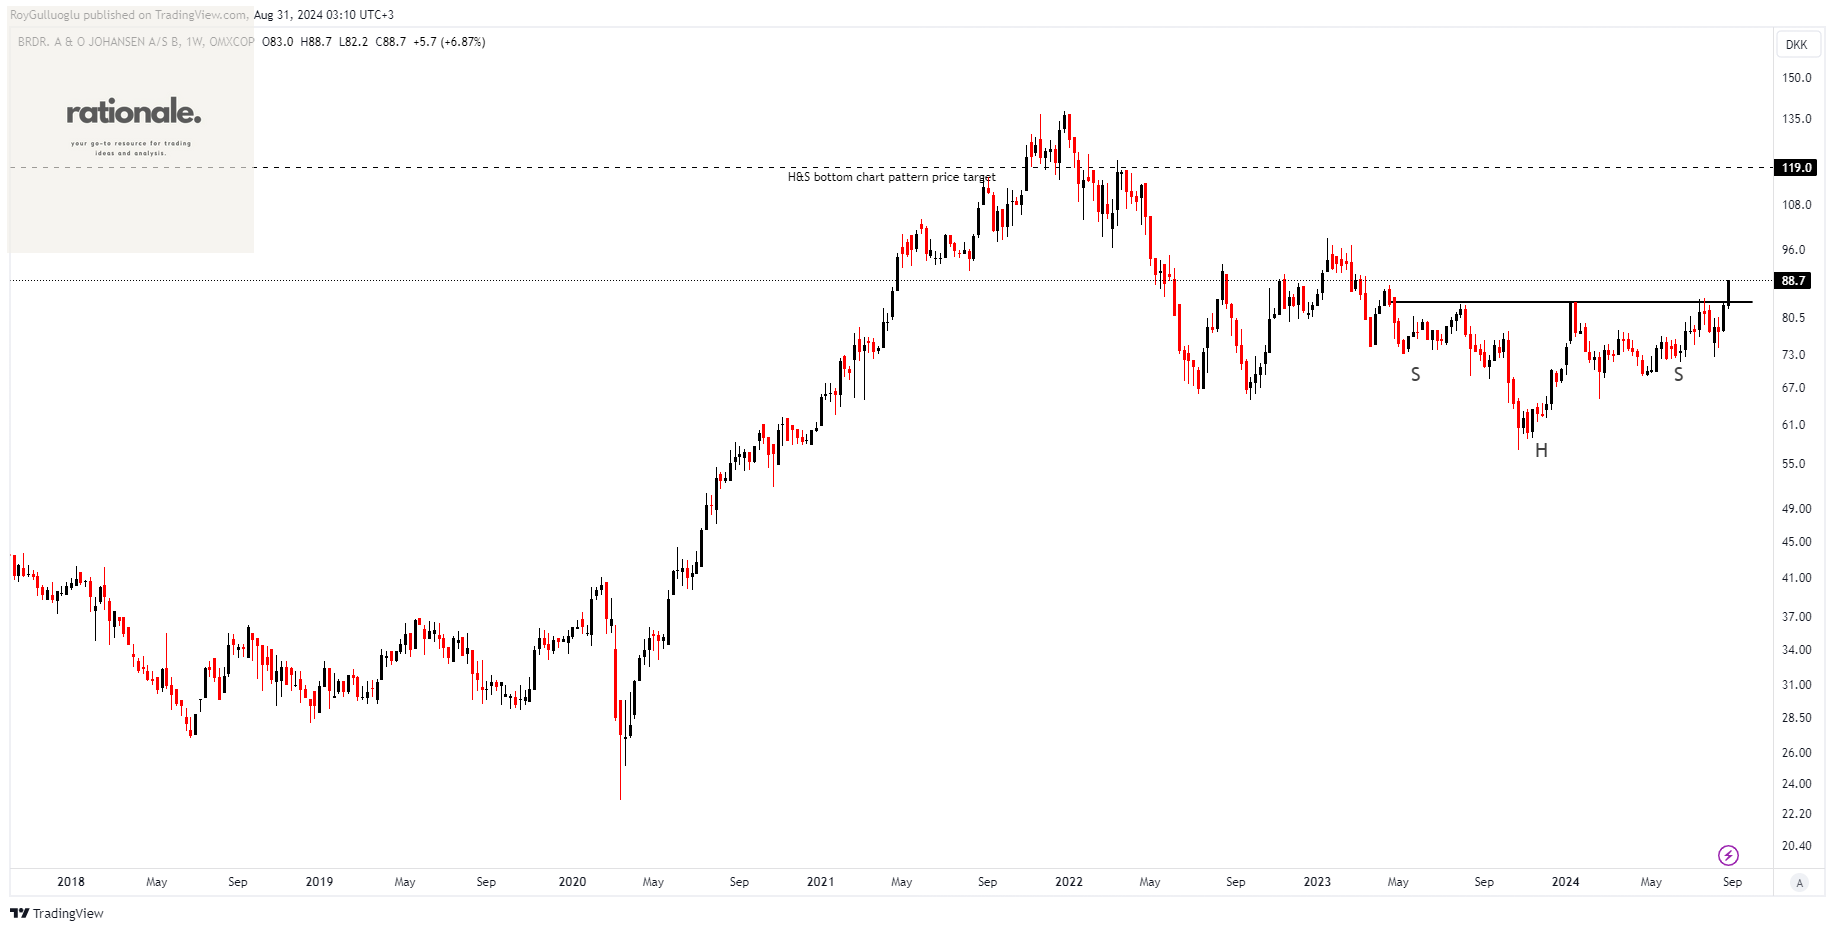
Matas A/S operates a chain of retail stores in Denmark, offering beauty, personal care, health and wellness, and household products.
The above weekly chart formed an approximately 17-month-long H&S bottom chart pattern as a bullish reversal after a downtrend.
The horizontal boundary at 83.8 levels acted as a resistance within this pattern.
A daily close above 86.32 levels validated the breakout from the 17-month-long H&S bottom chart pattern.
Based on this chart pattern, the potential price target is 119 levels.
AOJ, classified under the "industrials" sector, falls under the “Small Cap - Value” stock category.
HusCompagniet A/S -(HUSCO/OMXCOP)-Long Idea
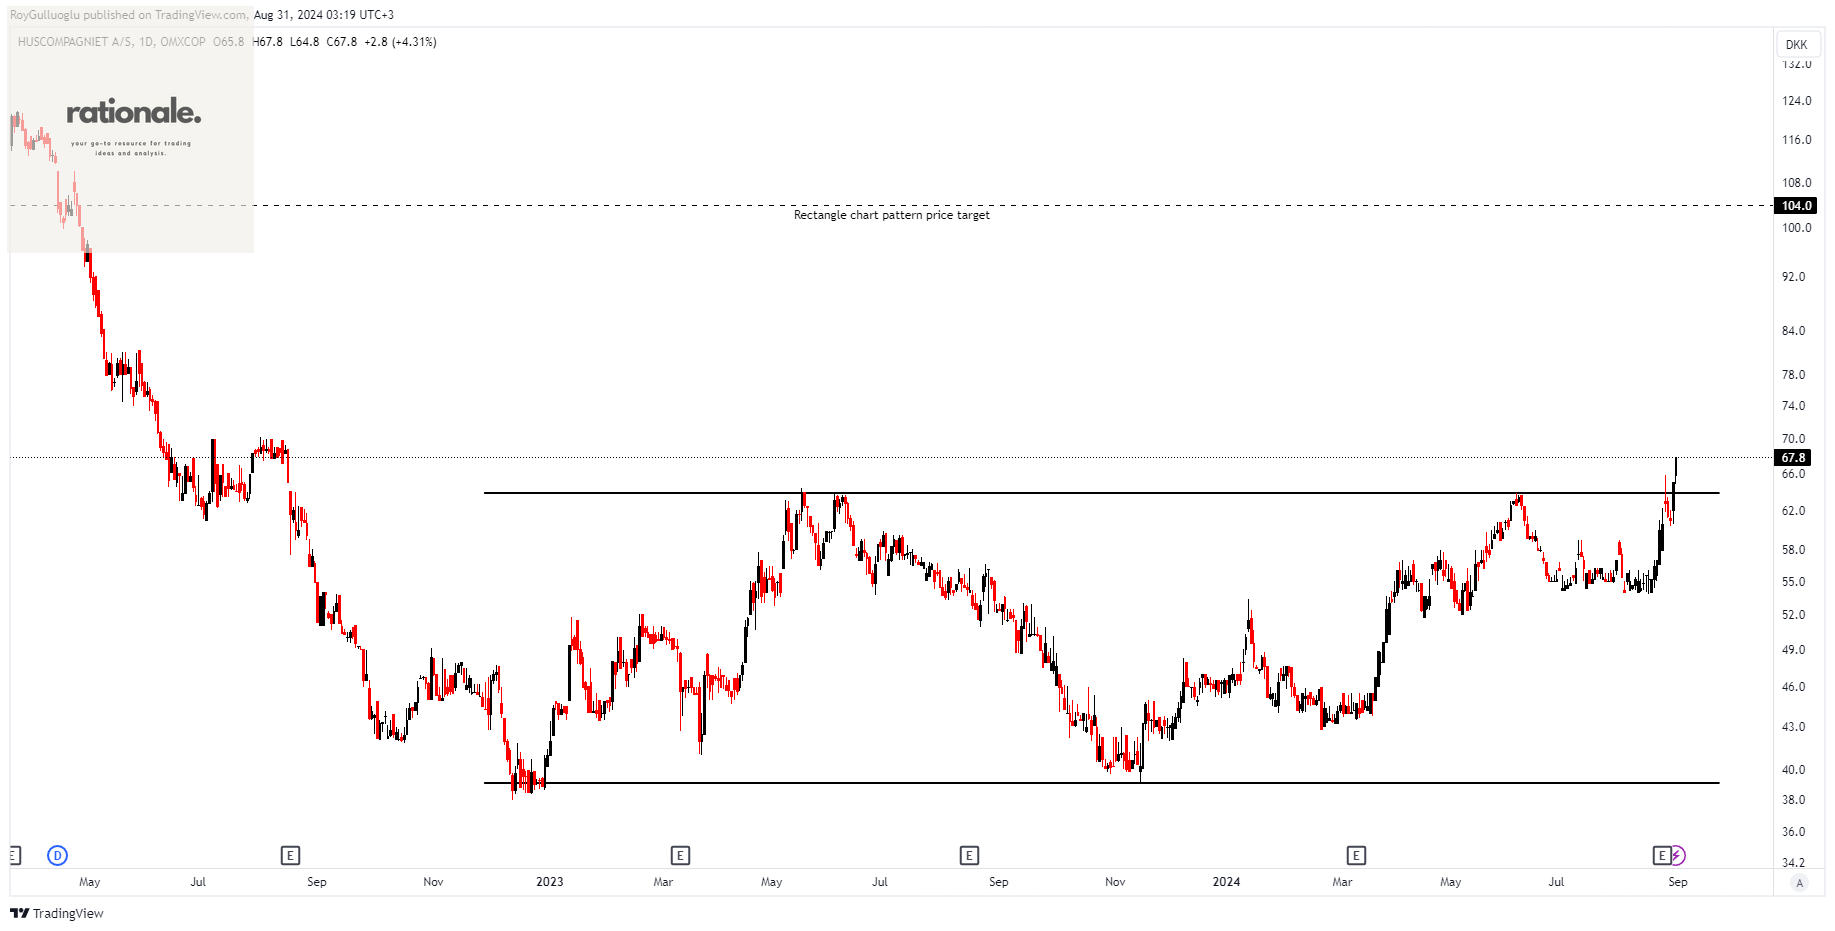
HusCompagniet A/S develops single-family detached houses in Denmark and operates through three segments: Detached, Semi-Detached, and Wooden Houses.
The above daily chart formed an approximately 14-month-long rectangle chart pattern as a bullish reversal after a downtrend.
The horizontal boundary at 63.8 levels acted as a resistance within this pattern.
A daily close above 65.71 levels validated the breakout from the 14-month-long rectangle chart pattern.
Based on this chart pattern, the potential price target is 104 levels.
HUSCO, classified under the "consumer cyclical" sector, falls under the “Small Cap - Growth” stock category.
Teşekkürler Roy
Thank you!