


New setups
TICKERS: JANX(NASDAQ), HASI(NYSE), KTB(NYSE), CEVA(NYSE), TRYG(OMXCOP), PNDORA(OMXCOP), ORSTED(OMXCOP), HOT(XETR), III(LSE)
Janux Therapeutics, Inc.-(JANX/NASDAQ)-Long Idea
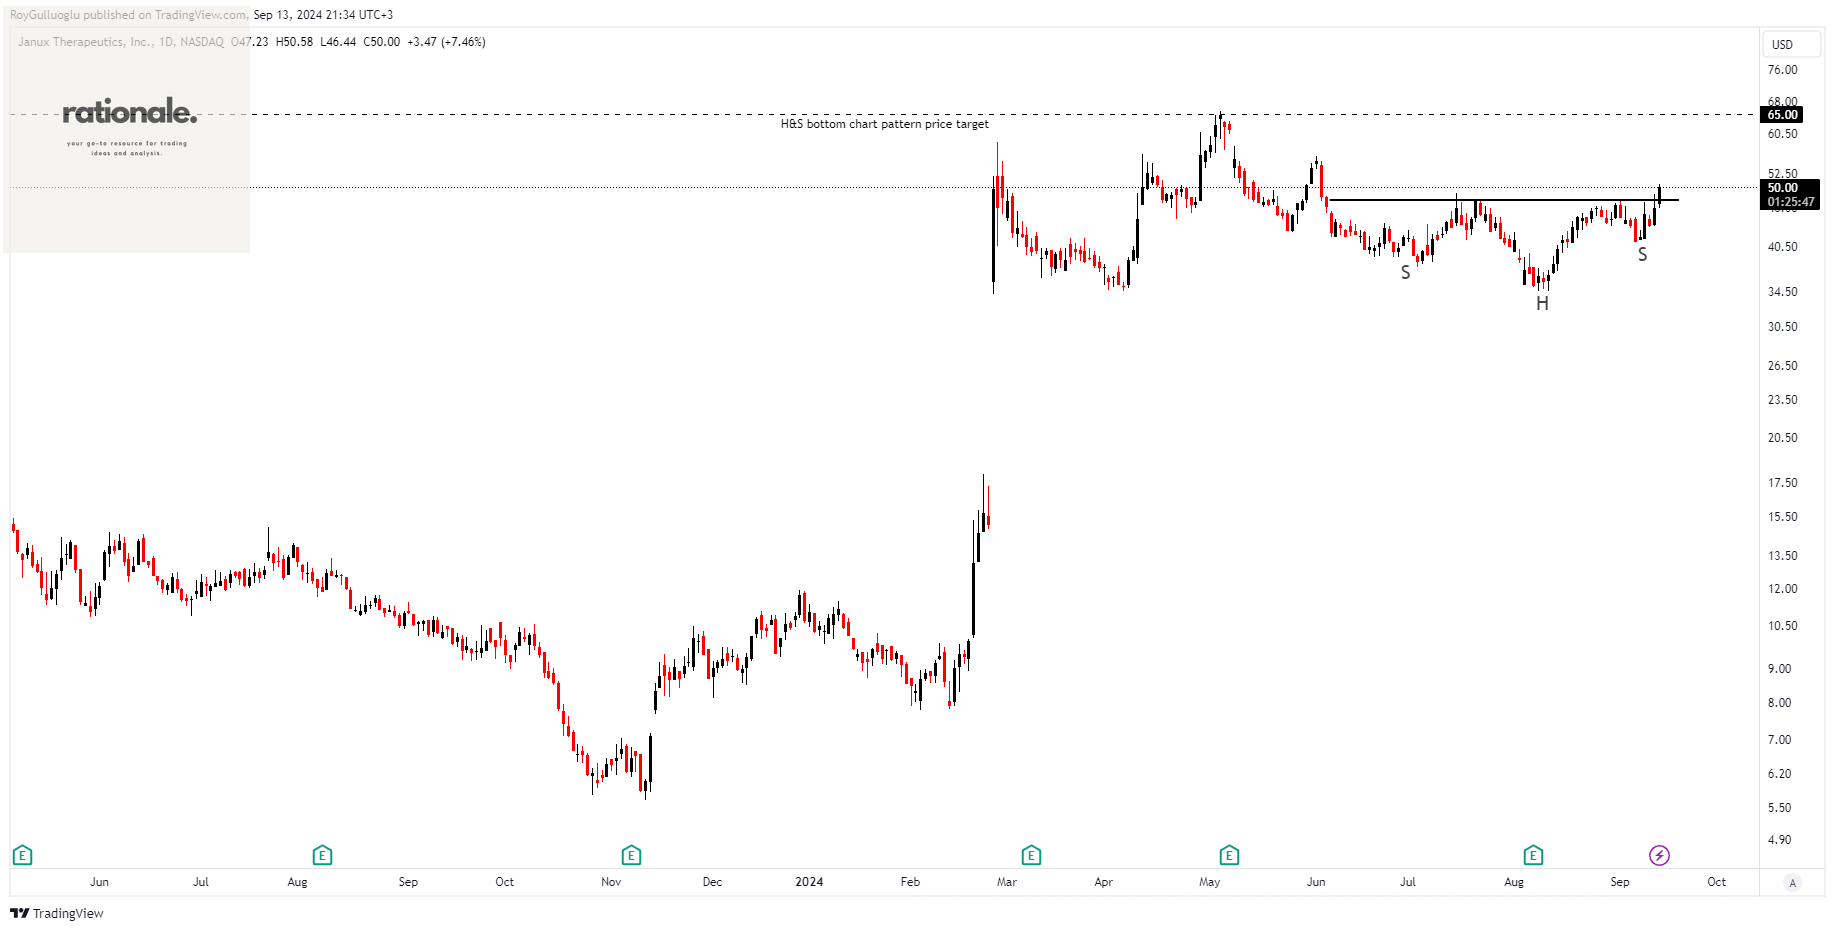
Janux Therapeutics, Inc. is a clinical-stage biopharmaceutical company focused on developing immunotherapies using its Tumor Activated T Cell Engagers (TRACTr) and Tumor Activated Immunomodulators (TRACIr) platform technologies to treat cancer patients.
The above daily chart formed an approximately 2-month-long H&S bottom chart pattern as a bullish reversal after a downtrend.
The horizontal boundary at 47.77 levels acted as a resistance within this pattern.
A daily close above 49.2 levels validated the breakout from the 2-month-long H&S bottom chart pattern.
Based on this chart pattern, the potential price target is 65 levels.
JANX, classified under the "healthcare" sector, falls under the “Mid Cap - Value” stock category.
HA Sustainable Infrastructure Capital, Inc.-(HASI/NASDAQ)-Long Idea
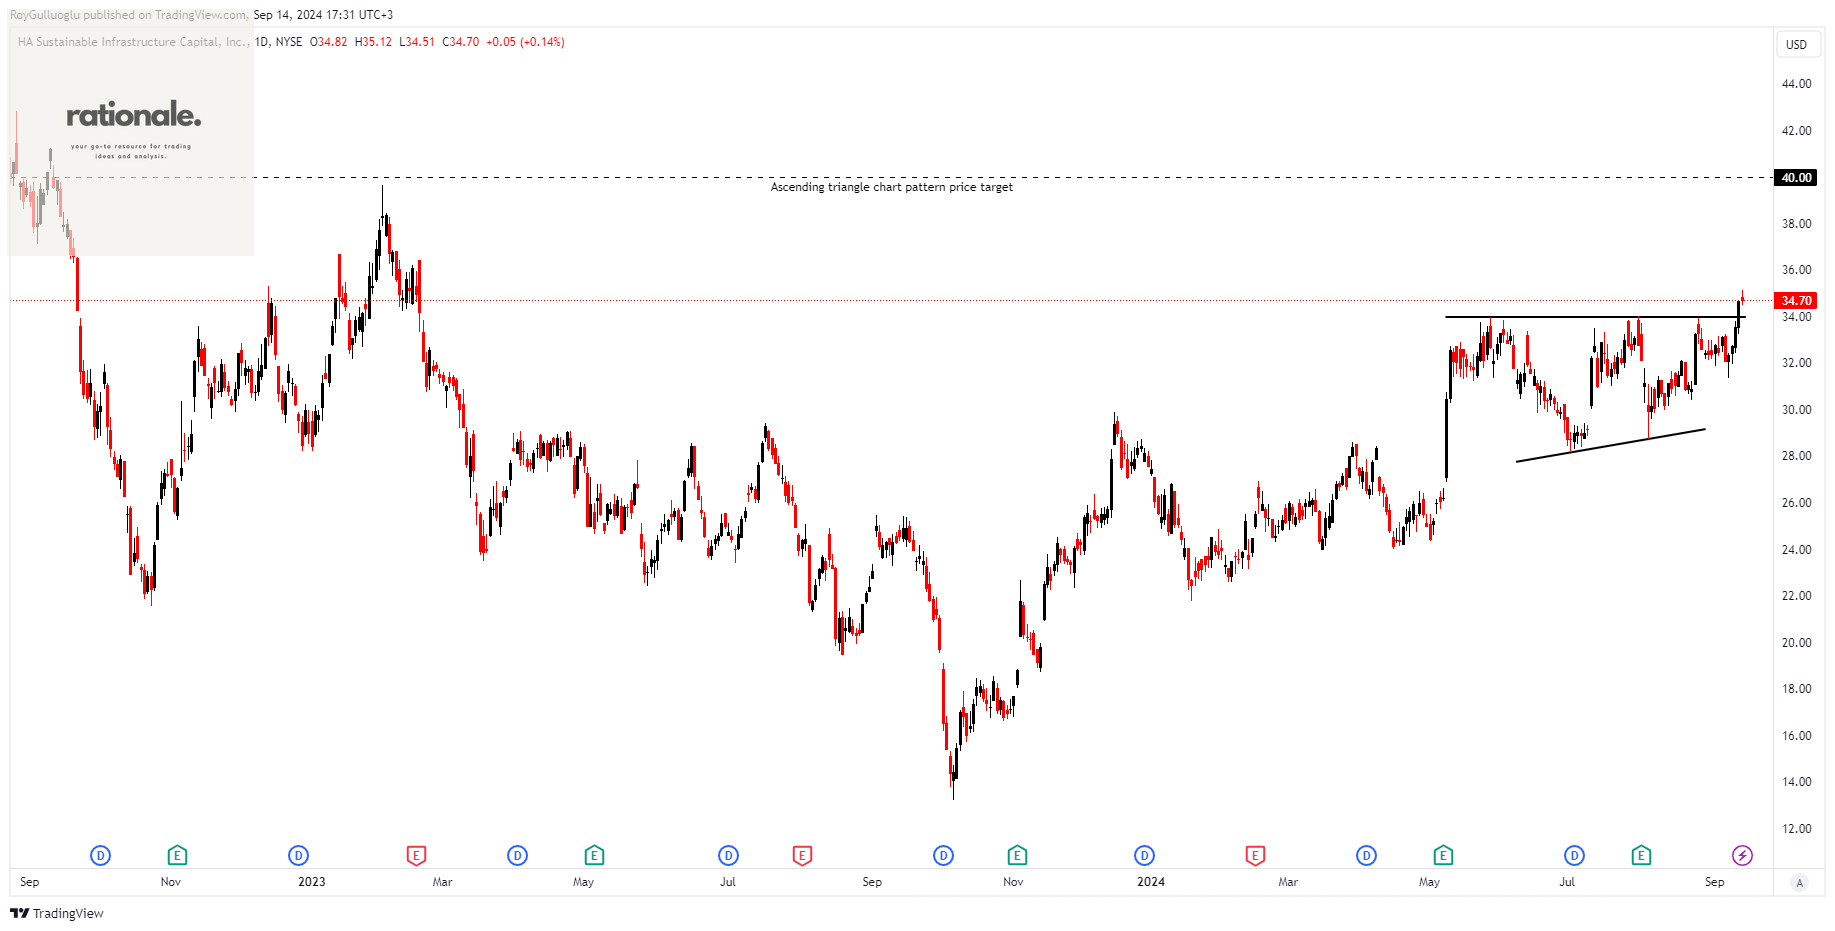
HA Sustainable Infrastructure Capital, Inc., along with its subsidiaries, invests in energy efficiency, renewable energy, and sustainable infrastructure markets across the United States.
The above daily chart formed an approximately 3-month-long ascending triangle chart pattern as a bullish continuation after an uptrend.
The horizontal boundary at 33.96 levels acts as a resistance within this pattern.
A daily close above 34.98 levels would validate the breakout from the 3-month-long ascending triangle chart pattern.
Based on this chart pattern, the potential price target is 40 levels.
HASI, classified under the "real estate" sector, falls under the “Mid Cap - Income” stock category.
Kontoor Brands, Inc.-(KTB/NYSE)-Long Idea
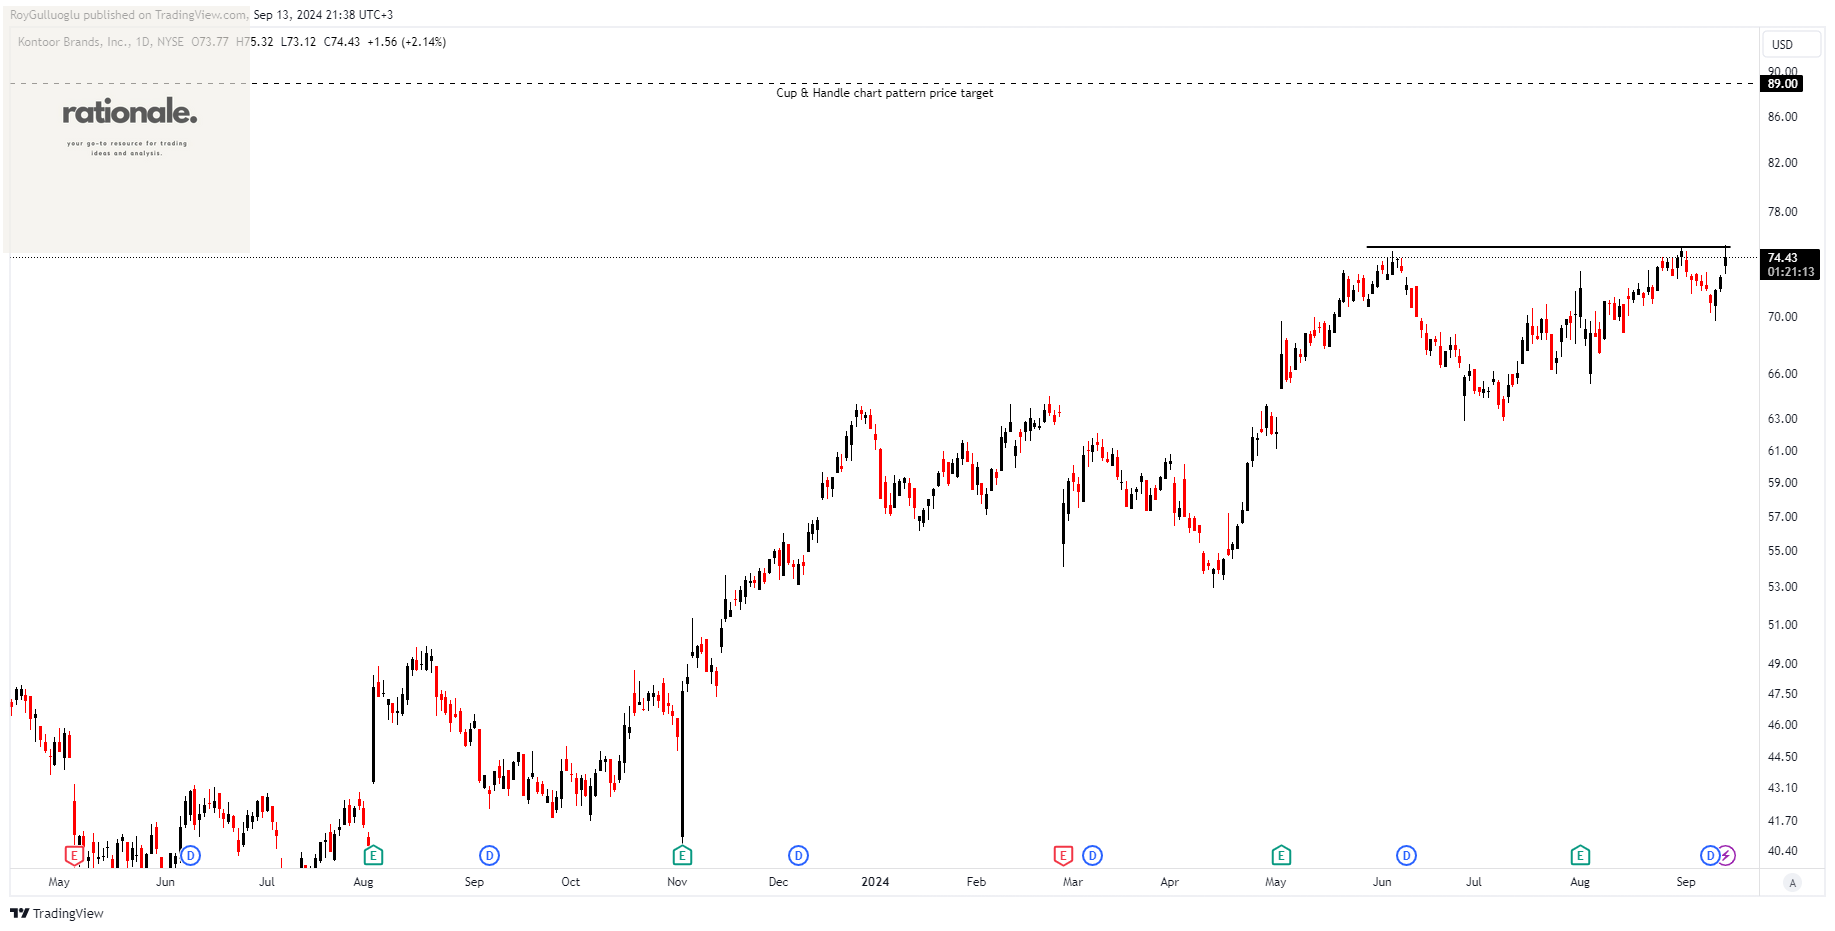
Kontoor Brands, Inc. is a lifestyle apparel company that designs, produces, sources, markets, distributes, and licenses denim, apparel, footwear, and accessories, primarily under the Wrangler and Lee brands.
The above daily chart formed an approximately 3-month-long Cup & Handle chart pattern as a bullish continuation after an uptrend.
The horizontal boundary at 75.17 levels acts as a resistance within this pattern.
A daily close above 77.43 levels would validate the breakout from the 3-month-long Cup & Handle chart pattern.
Based on this chart pattern, the potential price target is 89 levels.
KTB, classified under the "consumer cyclical" sector, falls under the “Mid Cap - Growth” stock category.
CEVA, Inc.-(CEVA/NASDAQ)-Long Idea
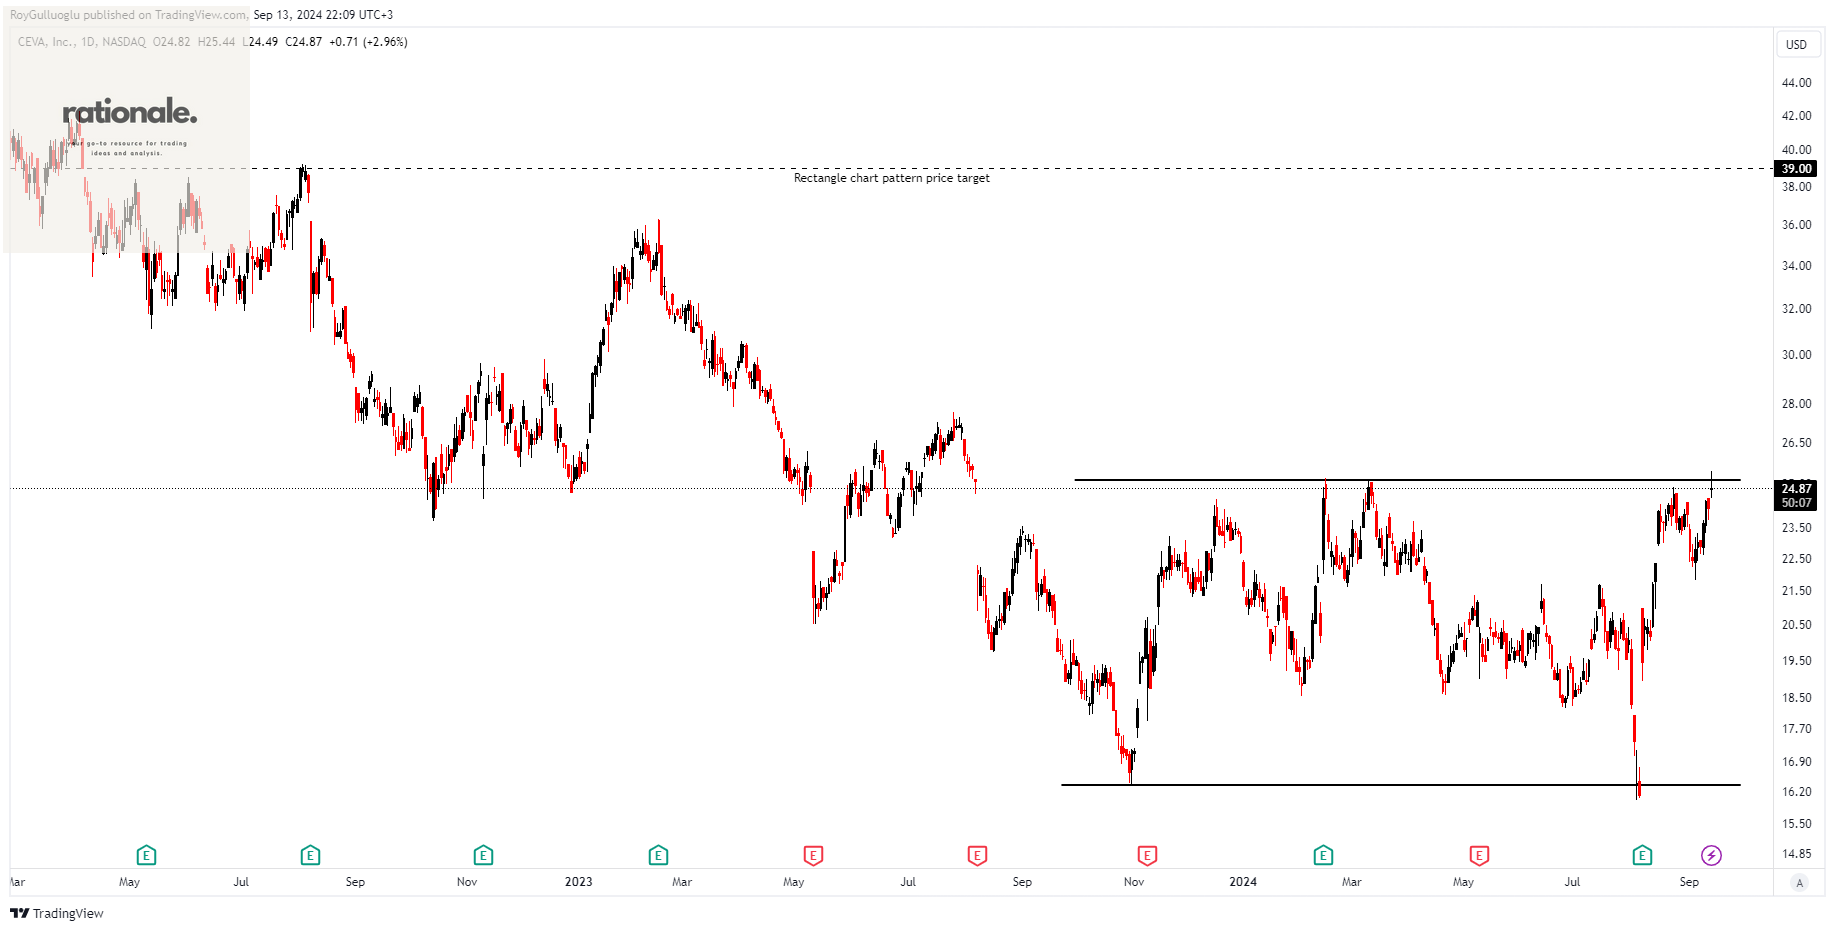
CEVA, Inc. offers silicon and software IP solutions to semiconductor companies and original equipment manufacturers (OEMs) globally.
The above daily chart formed an approximately 7-month-long rectangle chart pattern as a bullish reversal after a downtrend.
The horizontal boundary at 25.14 levels acts as a resistance within this pattern.
A daily close above 25.9 levels would validate the breakout from the 7-month-long rectangle chart pattern.
Based on this chart pattern, the potential price target is 39 levels.
CEVA, classified under the "technology" sector, falls under the “Small Cap - Growth” stock category.
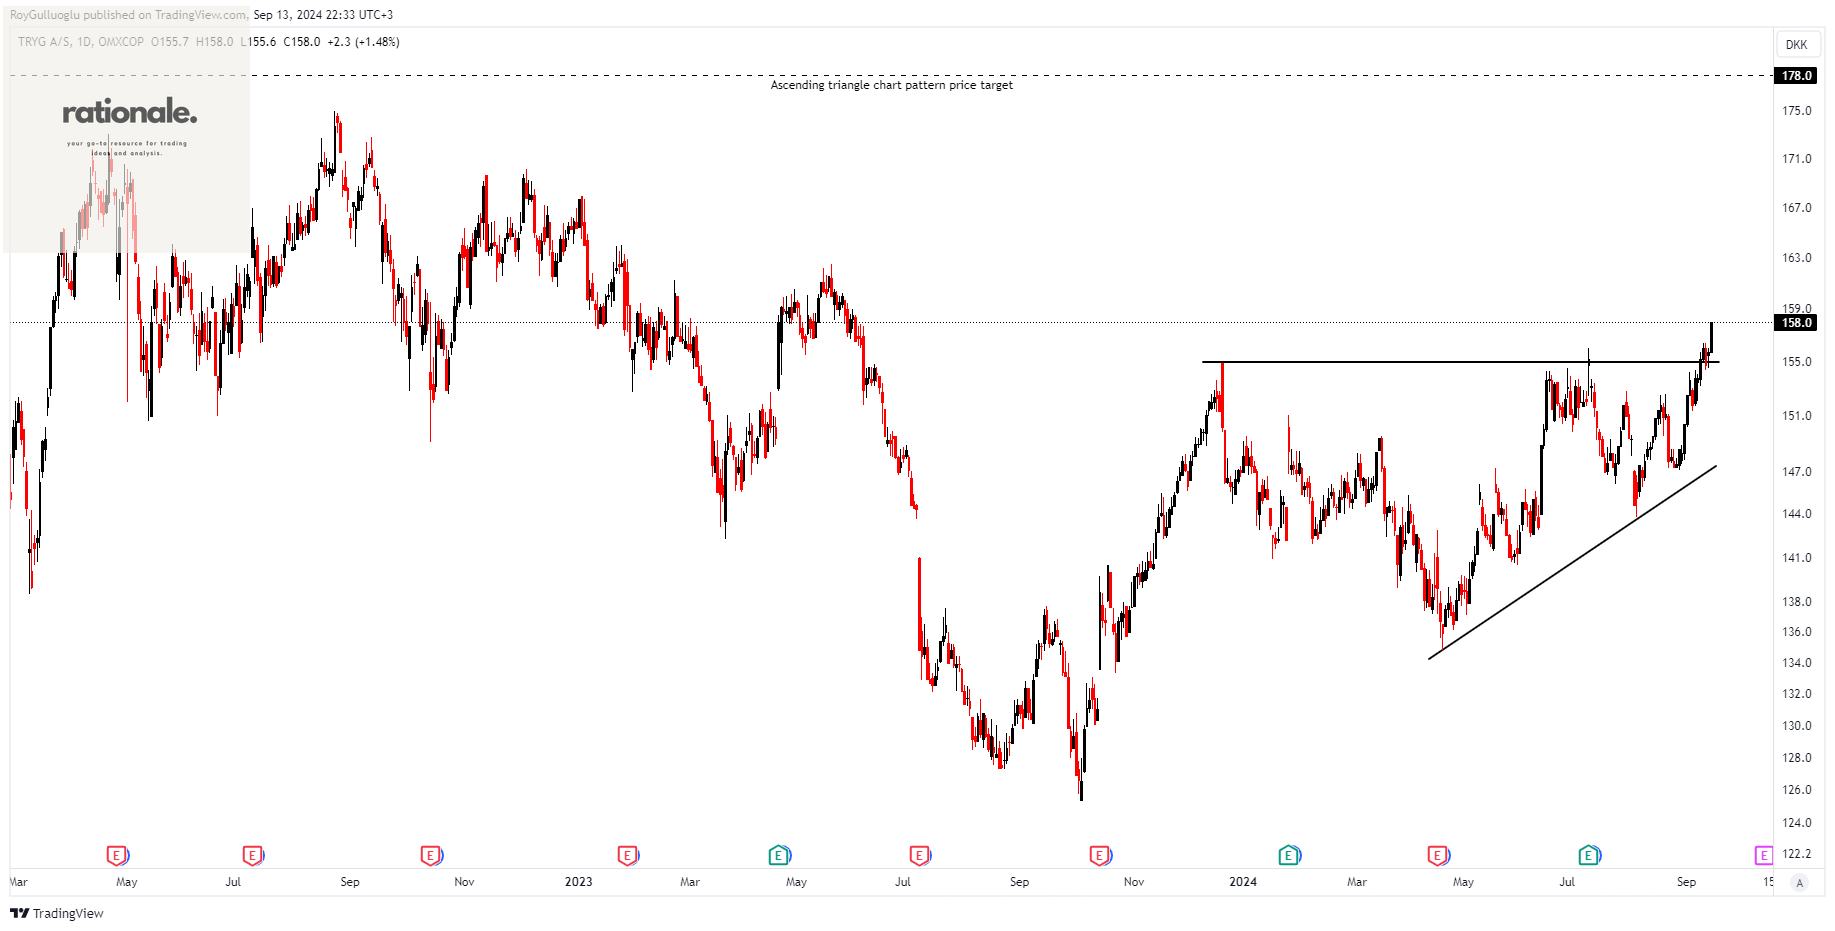
Tryg A/S-(TRYG/OMXCOP)-Long Idea
Tryg A/S, along with its subsidiaries, offers insurance products and services to private customers, corporate clients, and small to medium-sized businesses in Denmark, Sweden, and Norway.
The above daily chart formed an approximately 6-month-long ascending triangle chart pattern as a bullish reversal after a downtrend.
The horizontal boundary at 155 levels acted as a resistance within this pattern.
A daily close above 159.65 levels validated the breakout from the 6-month-long ascending triangle chart pattern.
Based on this chart pattern, the potential price target is 178 levels.
TRYG, classified under the "financial services" sector, falls under the “Large Cap - Income” stock category.
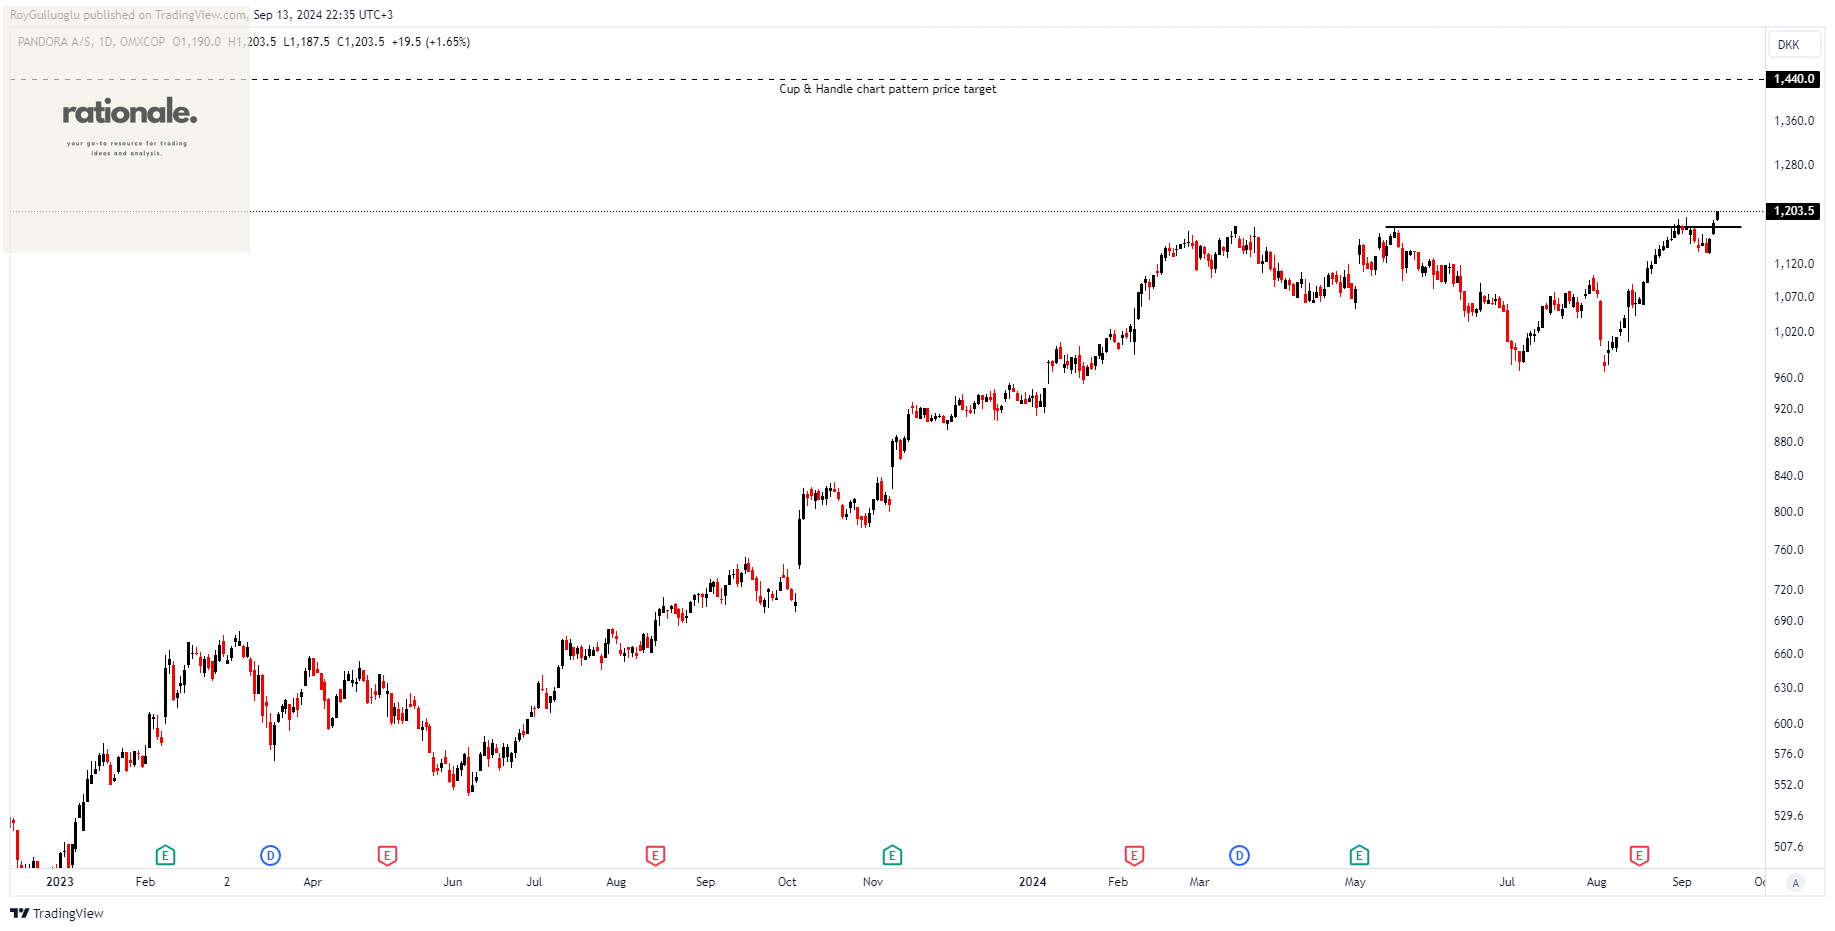
Pandora A/S-(PNDORA/OMXCOP)-Long Idea
Pandora A/S designs, manufactures, and markets hand-finished, contemporary jewelry. The company operates through two segments, Core and Fuel With More, offering a range of products including charms, bracelets, rings, earrings, necklaces, and pendants.
The above daily chart formed an approximately 3-month-long Cup & Handle chart pattern as a bullish continuation after an uptrend.
The horizontal boundary at 1178.5 levels acts as a resistance within this pattern.
A daily close above 1213.85 levels would validate the breakout from the 3-month-long Cup & Handle chart pattern.
Based on this chart pattern, the potential price target is 1440 levels.
PNDORA, classified under the "consumer cyclical" sector, falls under the “Large Cap - Growth” stock category.
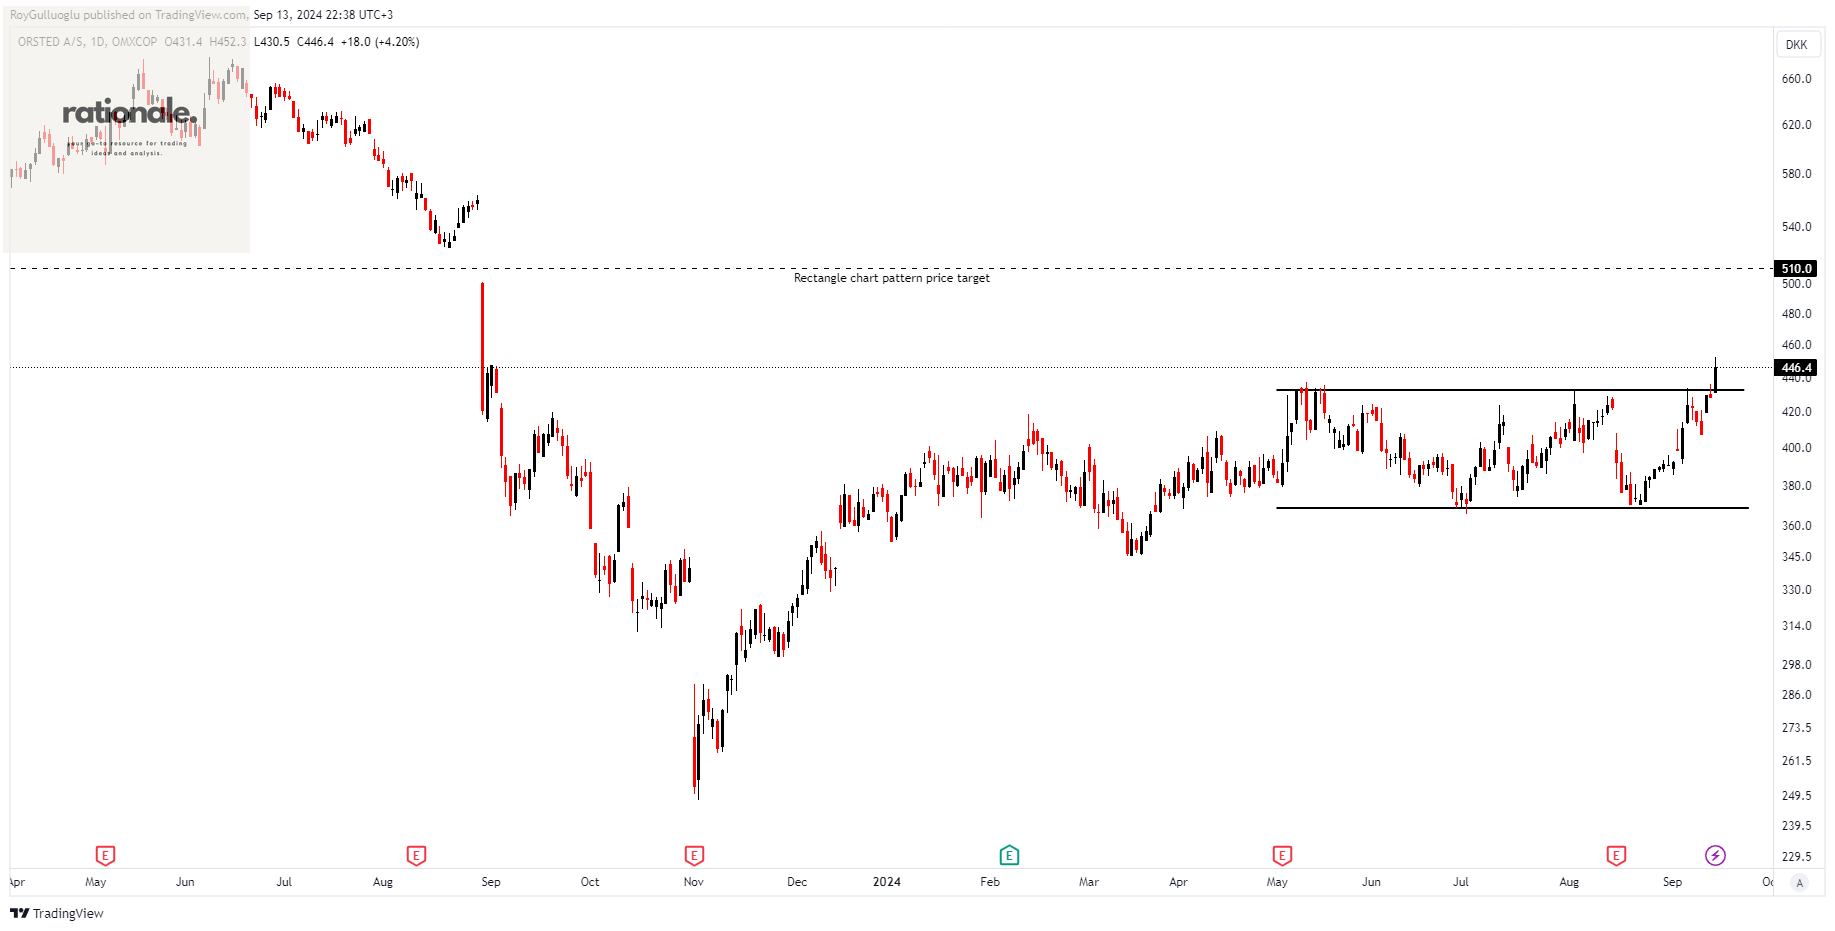
Ørsted A/S-(ORSTED/OMXCOP)-Long Idea
Ørsted A/S, along with its subsidiaries, develops, constructs, owns, and operates offshore and onshore wind farms, solar farms, energy storage facilities, renewable hydrogen and green fuel facilities, as well as bioenergy plants.
The above daily chart formed an approximately 3-month-long rectangle chart pattern as a bullish continuation after an uptrend.
The horizontal boundary at 432.3 levels acted as a resistance within this pattern.
A daily close above 445.27 levels validated the breakout from the 3-month-long rectangle chart pattern.
Based on this chart pattern, the potential price target is 510 levels.
ORSTED, classified under the "income" sector, falls under the “Large Cap - Income” stock category.
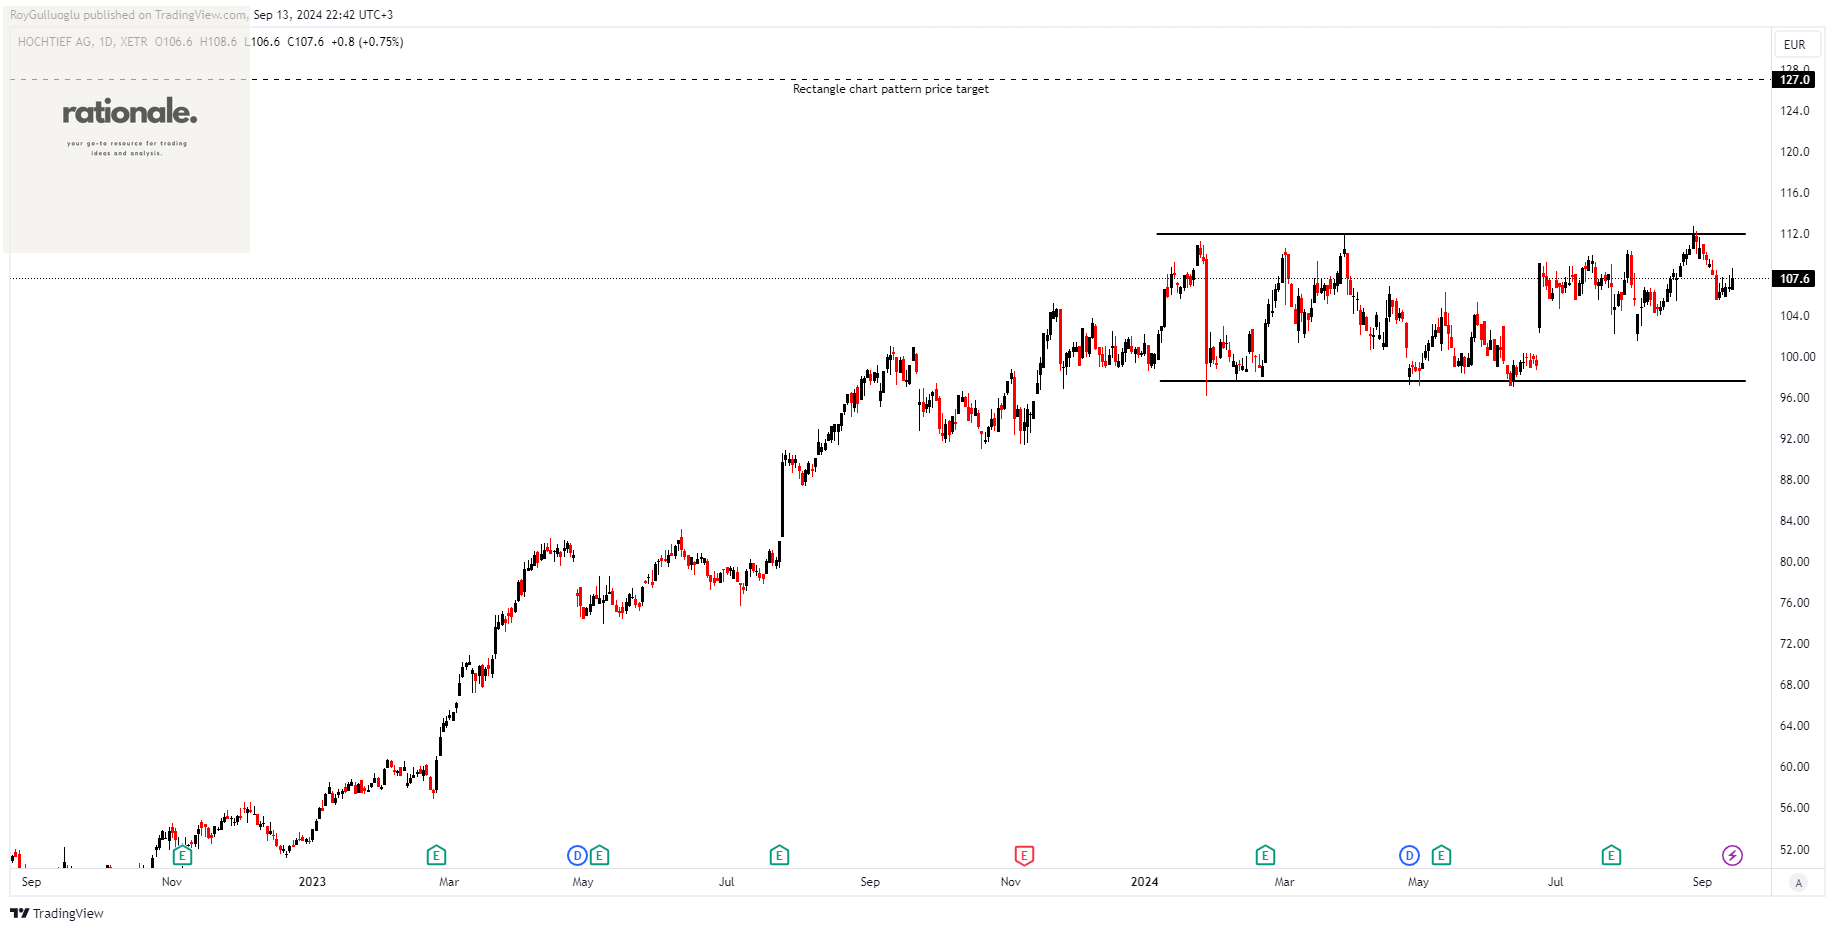
HOCHTIEF Aktiengesellschaft-(HOT/XETR)-Long Idea
HOCHTIEF Aktiengesellschaft operates in the construction industry globally, with its business divided into three divisions: HOCHTIEF Americas, HOCHTIEF Asia Pacific, and HOCHTIEF Europe.
The above daily chart formed an approximately 5-month-long rectangle chart pattern as a bullish continuation after n uptrend.
The horizontal boundary at 112 levels acts as a resistance within this pattern.
A daily close above 115.36 levels would validate the breakout from the 5-month-long rectangle chart pattern.
Based on this chart pattern, the potential price target is 127 levels.
HOT, classified under the "industrials" sector, falls under the “Mid Cap - Value” stock category.
3i Group plc-(III/LSE)-Long Idea
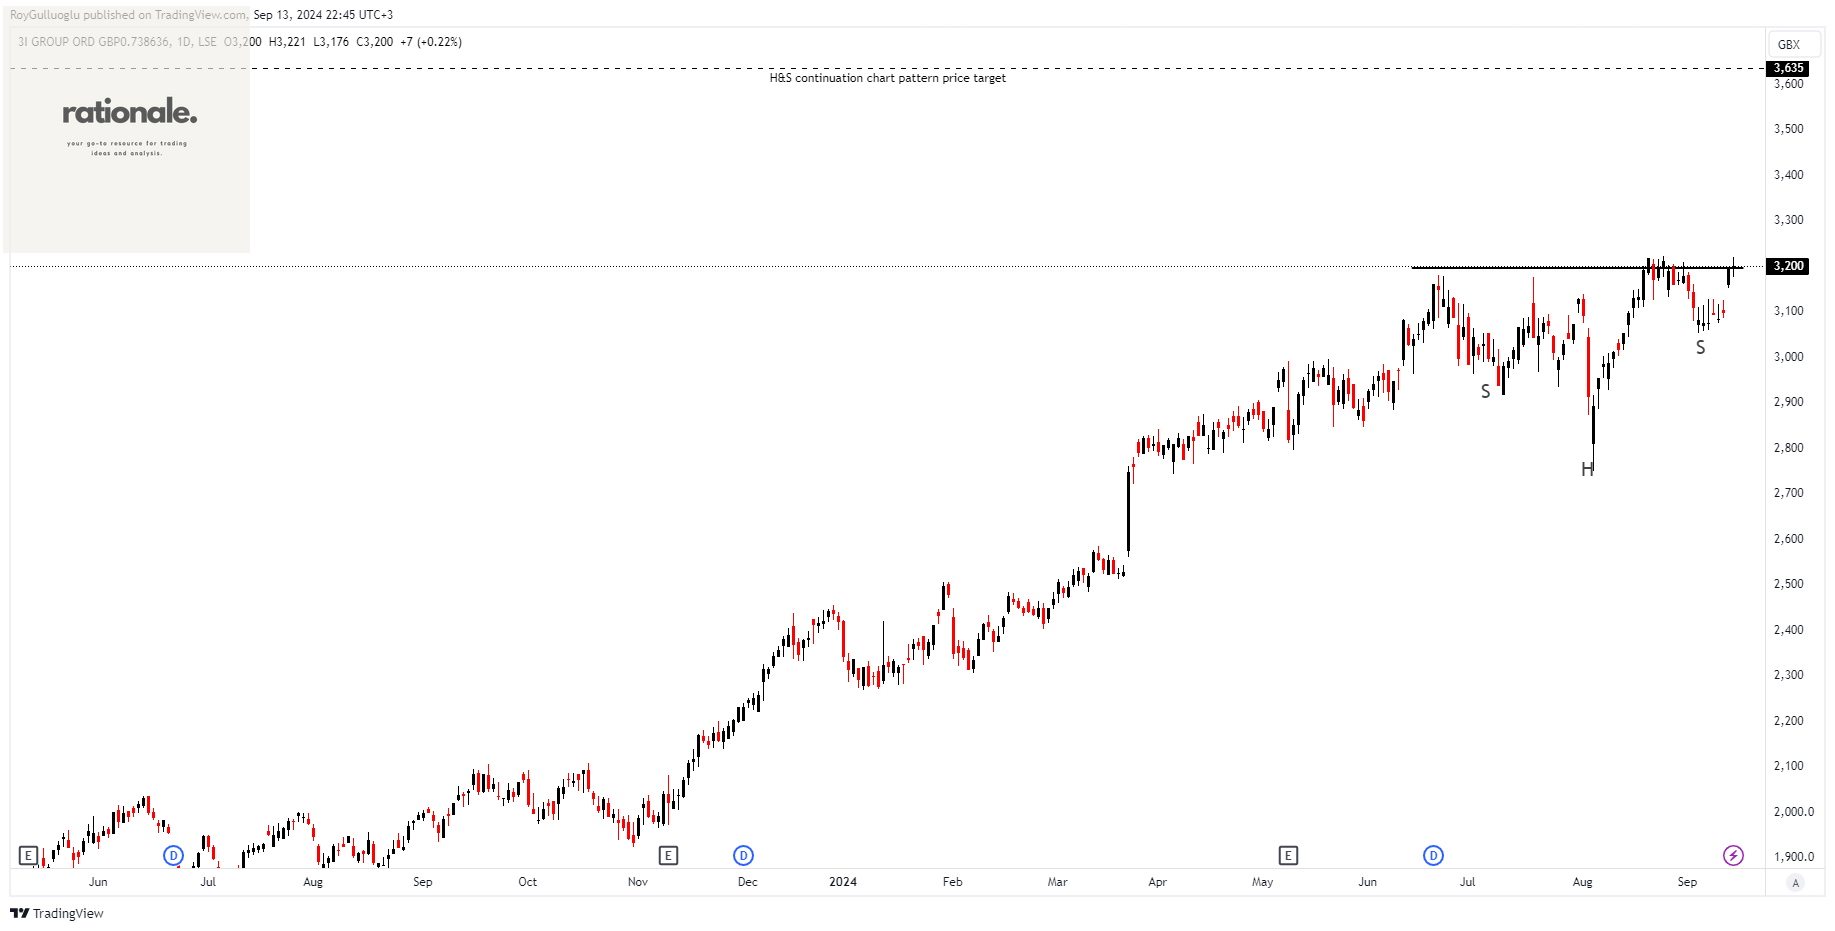
3i Group is a leading UK-based investment company that focuses on private equity and infrastructure. It invests in mid-market businesses across Europe and North America, helping them grow through strategic advice, capital investment, and active management.
The above daily chart formed an approximately 2-month-long H&S continuation chart pattern as a bullish continuation after an uptrend.
The horizontal boundary at 3200 levels acts as a resistance within this pattern.
A daily close above 3296 levels would validate the breakout from the 2-month-long H&S continuation chart pattern.
Based on this chart pattern, the potential price target is 3635 levels.