


New setups
TICKERS: IBKR(NASDAQ), GSHD(NASDAQ), RBLX(NYSE), EXP(NYSE), VOYA(NYSE), INTU(NASDAQ), AXTA(NYSE), NKT(OMXCOP), AMUN(EURONEXT)
Interactive Brokers Group, Inc.-(IBKR/NASDAQ)-Long Idea
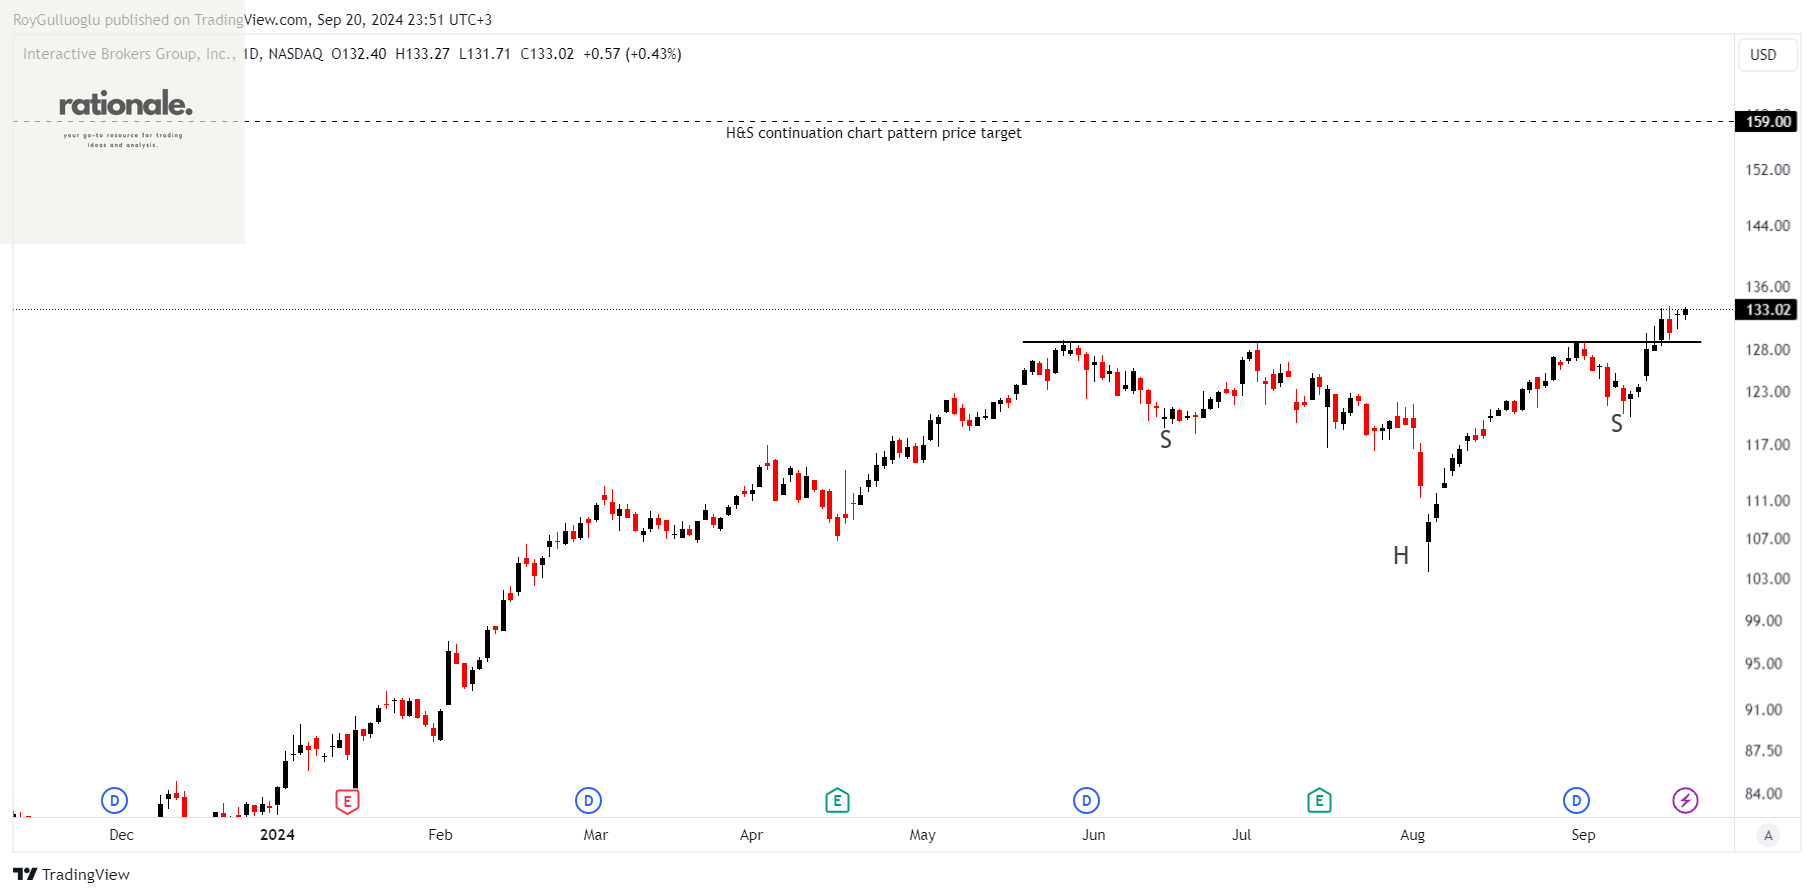
Interactive Brokers Group, Inc. (IBKR) is a global brokerage firm that provides automated electronic trading platforms for executing orders across a wide range of financial products. These include stocks, options, futures, forex, bonds, mutual funds, etc.
The above daily chart formed an approximately 3-month-long H&S continuation chart pattern as a bullish continuation after an uptrend.
The horizontal boundary at 129 levels acted as a resistance within this pattern.
A daily close above 132.87 levels validated the breakout from the 3-month-long H&S continuation chart pattern.
Based on this chart pattern, the potential price target is 159 levels.
IBKR, classified under the "financial services" sector, falls under the “Large Cap - Income” stock category.
Goosehead Insurance, Inc-(GSHD/NASDAQ)-Long Idea
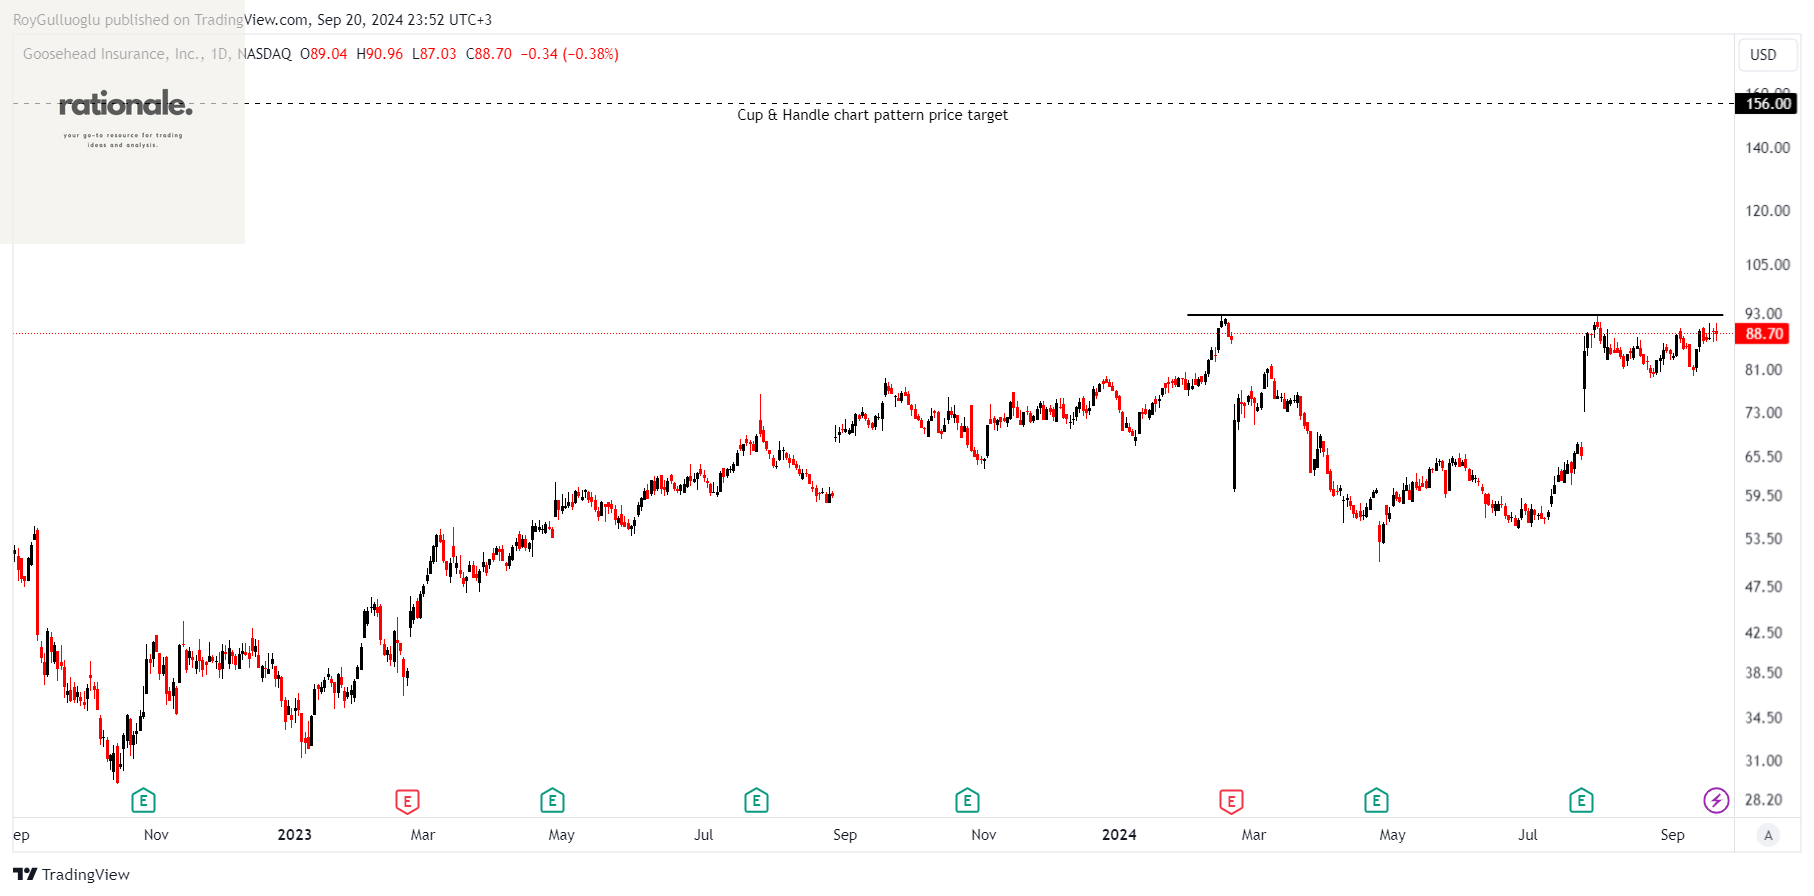
Goosehead Insurance, Inc. is a U.S.-based holding company offering personal lines insurance through its subsidiary, Goosehead Financial, LLC. It provides home, auto, flood, and umbrella policies via a network of corporate and franchise agents.
The above daily chart formed an approximately 5-month-long Cup & Handle chart pattern as a bullish continuation after an uptrend.
The horizontal boundary at 92.63 levels acts as a resistance within this pattern.
A daily close above 95.4 levels would validate the breakout from the 5-month-long Cup & Handle chart pattern.
Based on this chart pattern, the potential price target is 156 levels.
GSHD, classified under the "financial services" sector, falls under the “Mid Cap - Income” stock category.
Roblox Corporation-(RBLX/NYSE)-Long Idea
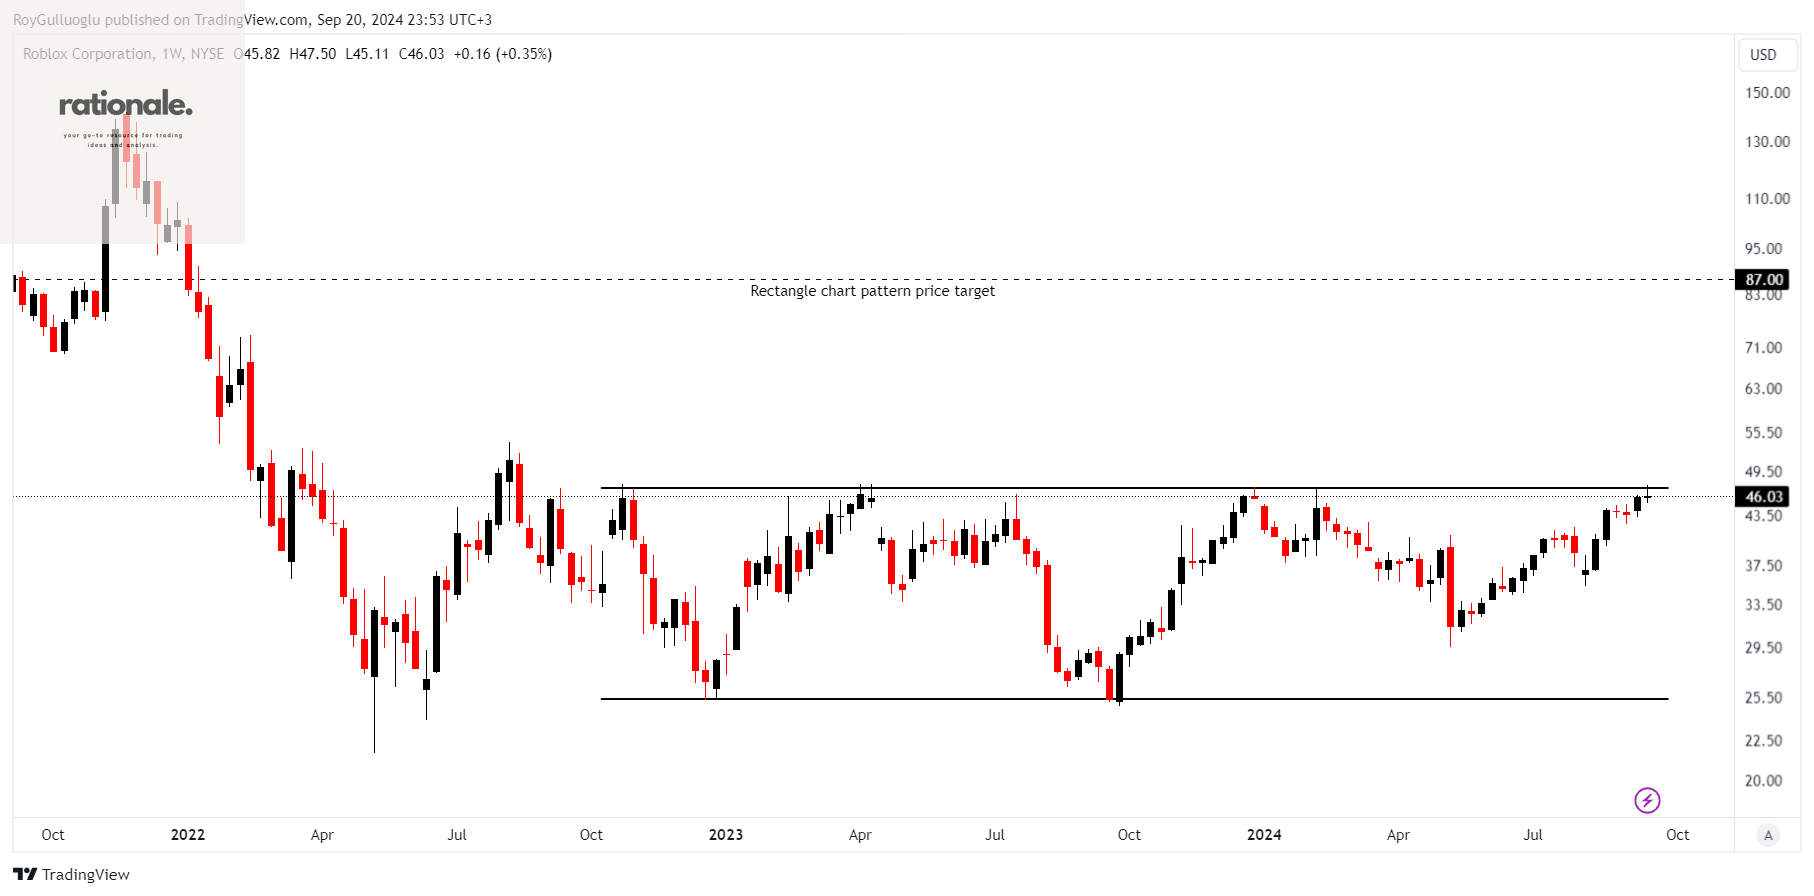
Roblox Corporation develops and operates a global online entertainment platform, offering a space for users to create, share, and play games and experiences.
The above weekly chart formed an approximately 25-month-long rectangle chart pattern as a bullish reversal after a downtrend.
The horizontal boundary at 47.11 levels acts as a resistance within this pattern.
A daily close above 48.52 levels would validate the breakout from the 25-month-long rectangle chart pattern.
Based on this chart pattern, the potential price target is 87 levels.
RBLX, classified under the "communication services" sector, falls under the “Large Cap - Growth” stock category.
Eagle Materials Inc.-(EXP/NYSE)-Long Idea
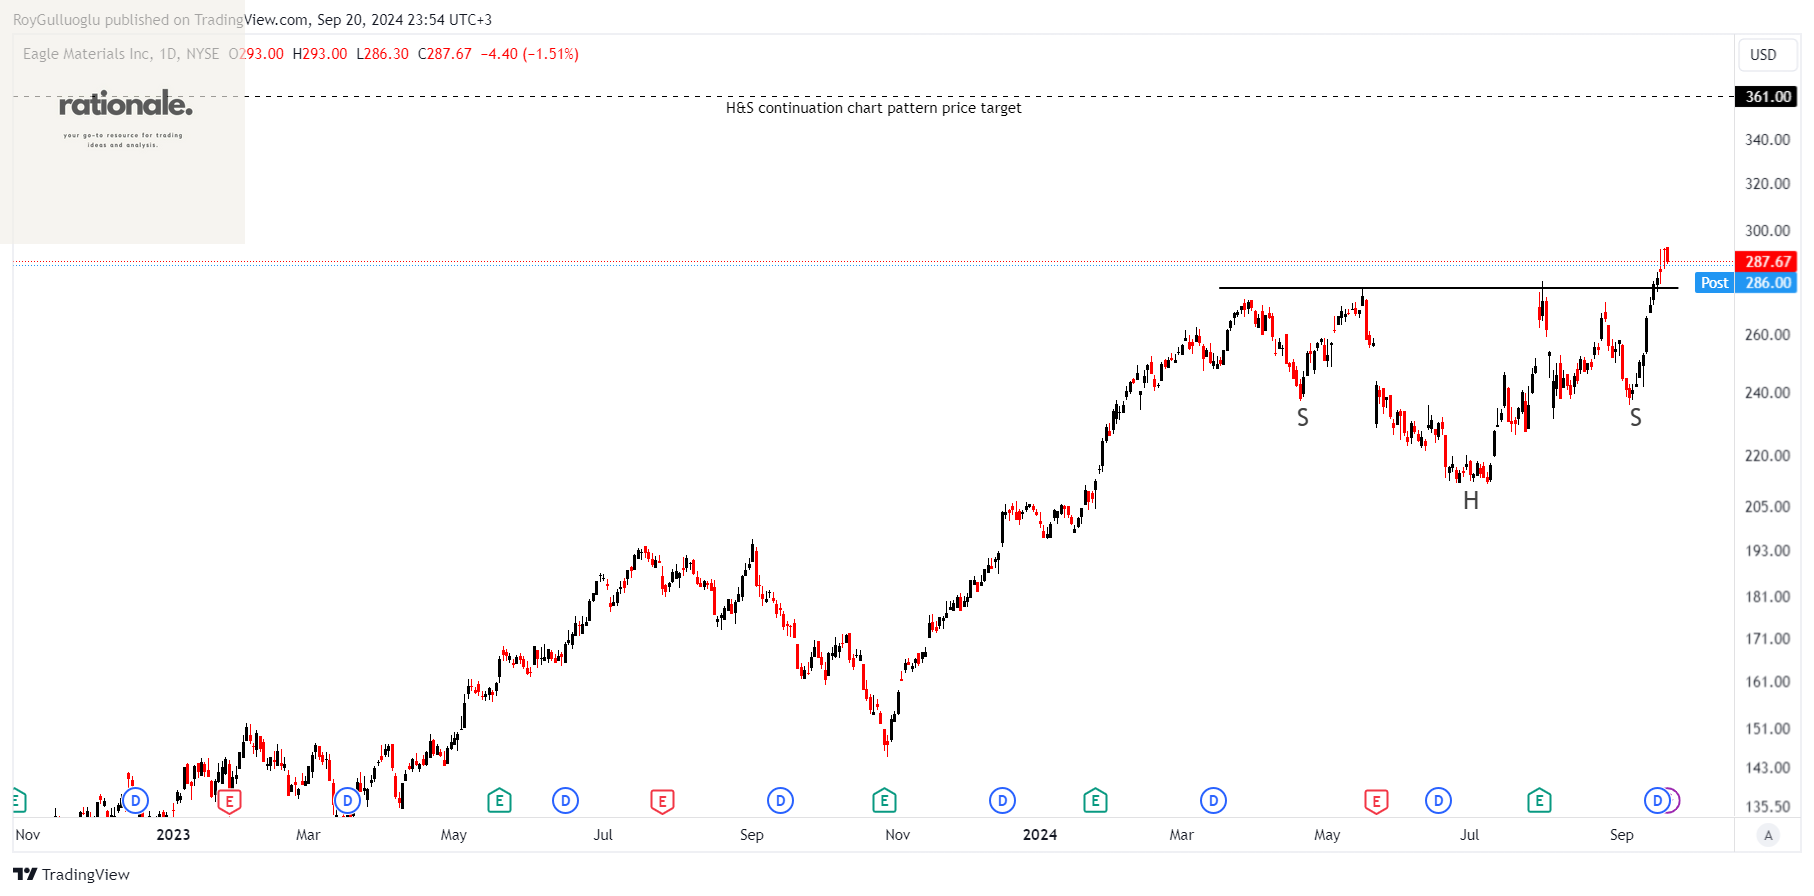
Eagle Materials Inc. manufactures and sells heavy construction and light building materials in the U.S. through its subsidiaries. Its products include cement, concrete, gypsum wallboard, and other related materials.
The above daily chart formed an approximately 4-month-long H&S continuation chart pattern as a bullish continuation after an uptrend.
The horizontal boundary at 277.14 levels acted as a resistance within this pattern.
A daily close above 285.45 levels validated the breakout from the 4-month-long H&S continuation chart pattern.
Based on this chart pattern, the potential price target is 361 levels.
EXP, classified under the "basic materials" sector, falls under the “Mid Cap - Value” stock category.
Voya Financial, Inc.-(VOYA/NYSE)-Long Idea
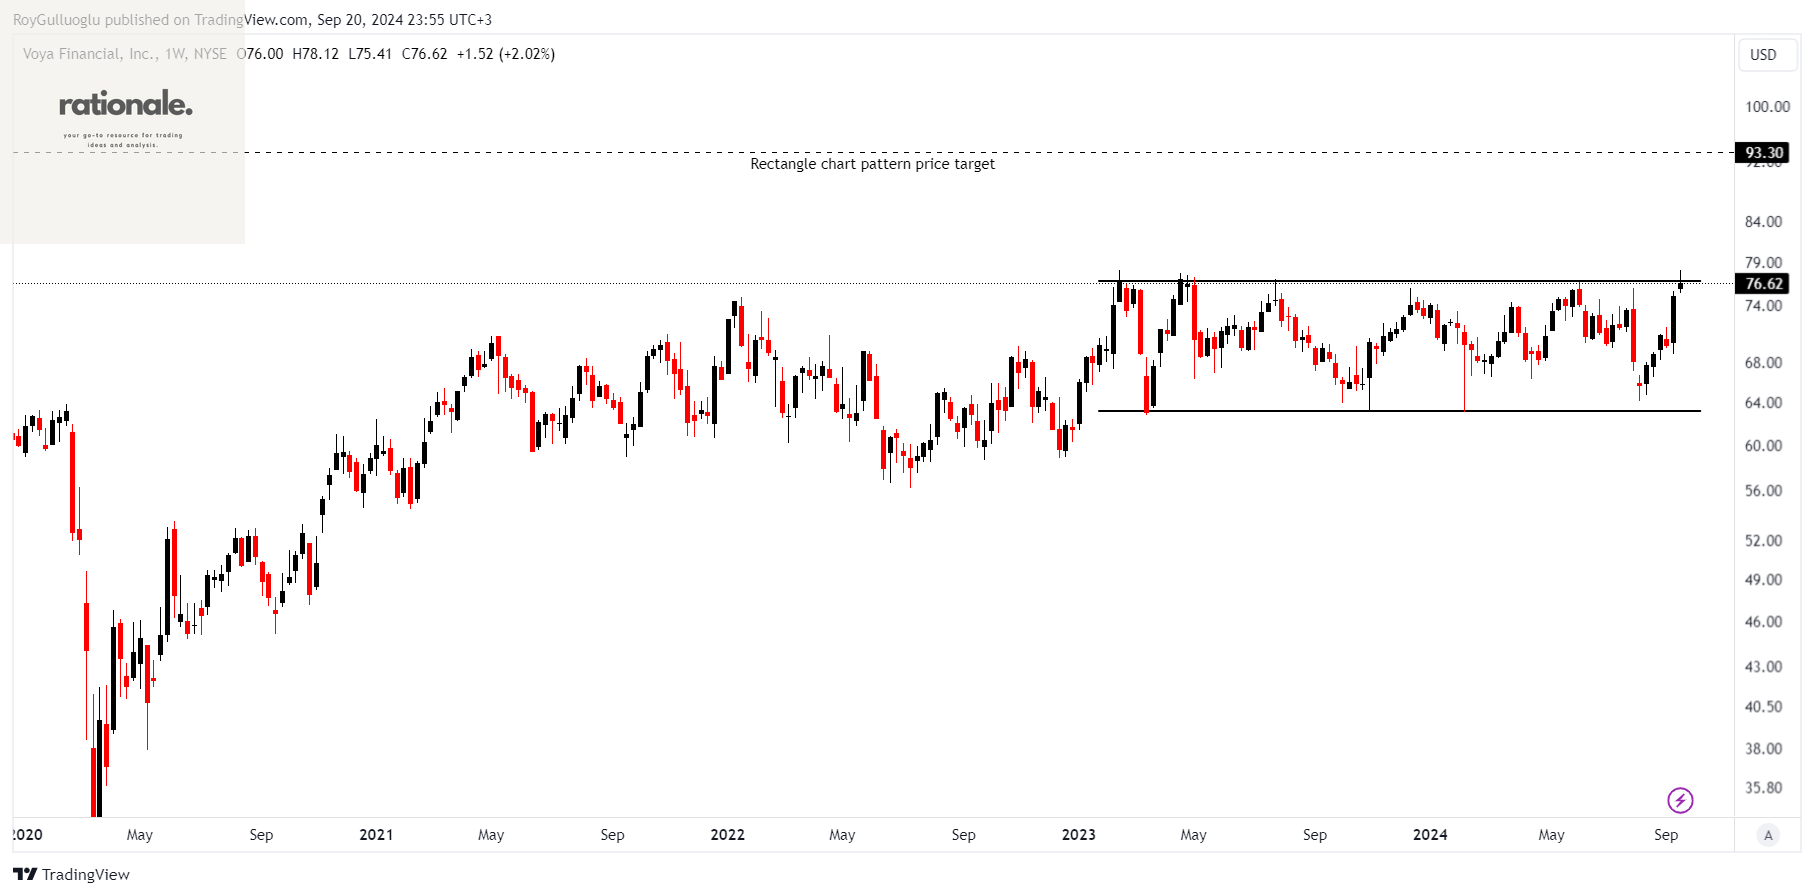
Voya Financial, Inc. provides workplace benefits and savings products in the U.S. and internationally, offering services like retirement plans, insurance, and investment management.
The above weekly chart formed an approximately 20-month-long rectangle chart pattern as a bullish continuation after an uptrend.
The horizontal boundary at 76.8 levels acts as a resistance within this pattern.
A daily close above 79.1 levels would validate the breakout from the 20-month-long rectangle chart pattern.
Based on this chart pattern, the potential price target is 93.3 levels.
VOYA, classified under the "financial services" sector, falls under the “Mid Cap - Income” stock category.
Intuit Inc.-(INTU/NASDAQ)-Long Idea
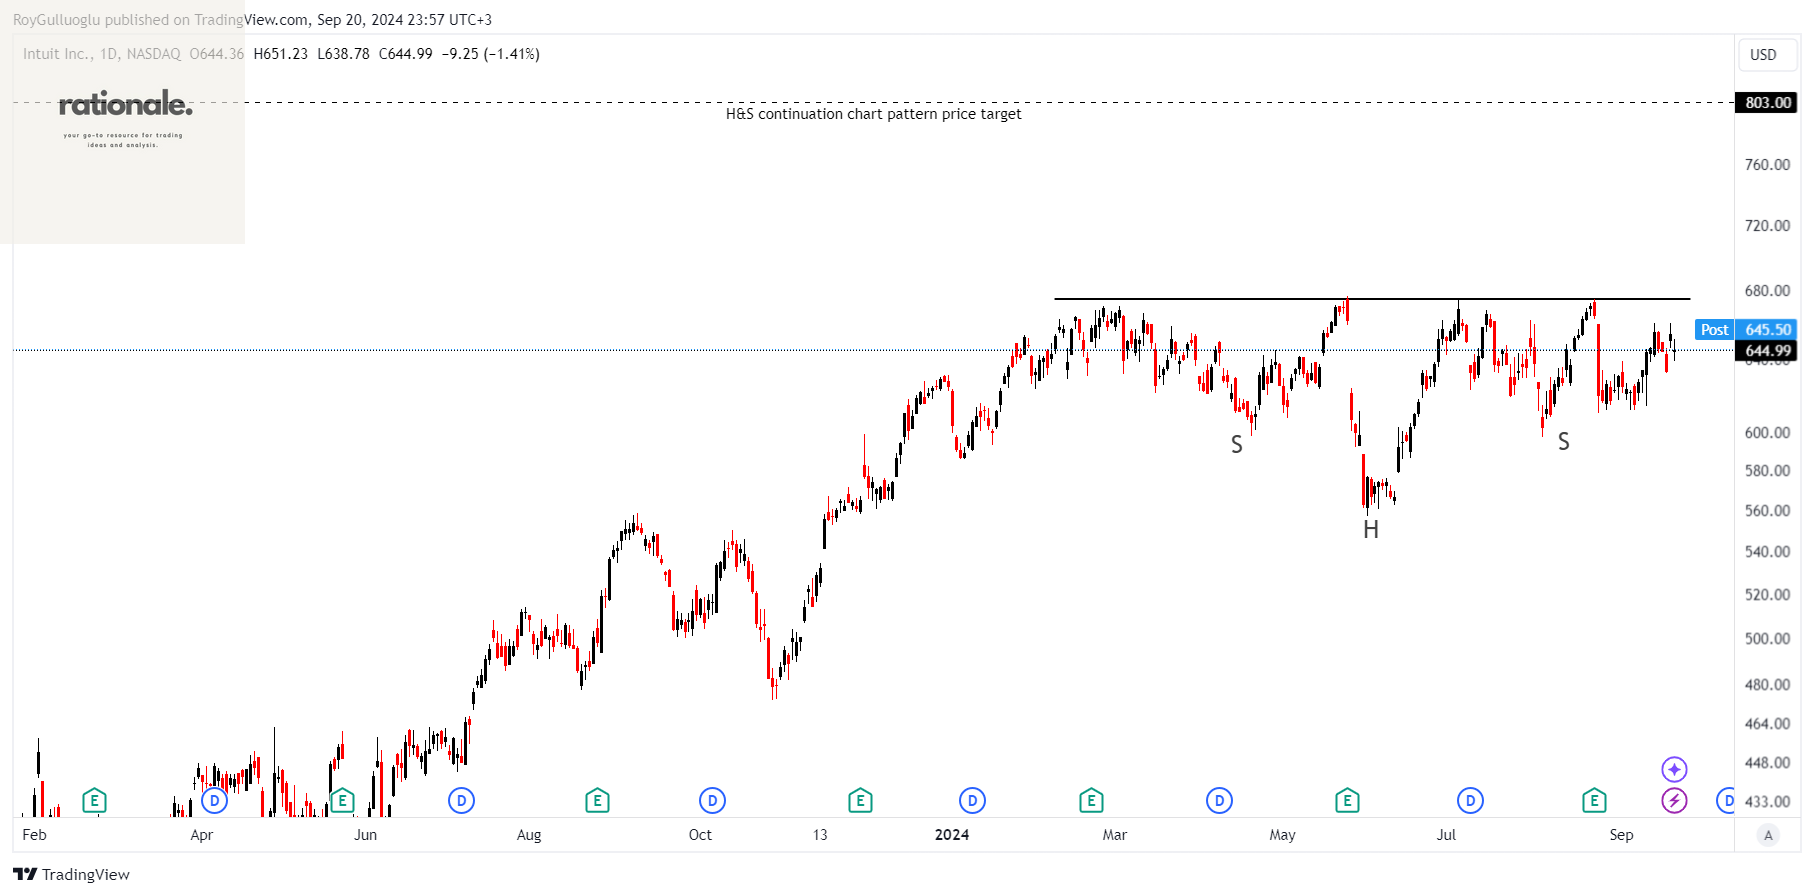
Intuit Inc. offers financial management, compliance, and marketing products in the U.S. through four segments: Small Business & Self-Employed, Consumer, Credit Karma, and ProTax.
The above daily chart formed an approximately 5-month-long H&S continuation chart pattern as a bullish continuation after an uptrend..
The horizontal boundary at 675 levels acts as a resistance within this pattern.
A daily close above 695 levels would validate the breakout from the 5-month-long H&S continuation chart pattern.
Based on this chart pattern, the potential price target is 803 levels.
INTU, classified under the "technology" sector, falls under the “Large Cap - Growth” stock category.
Axalta Coating Systems Ltd.-(AXTA/NYSE)-Long Idea
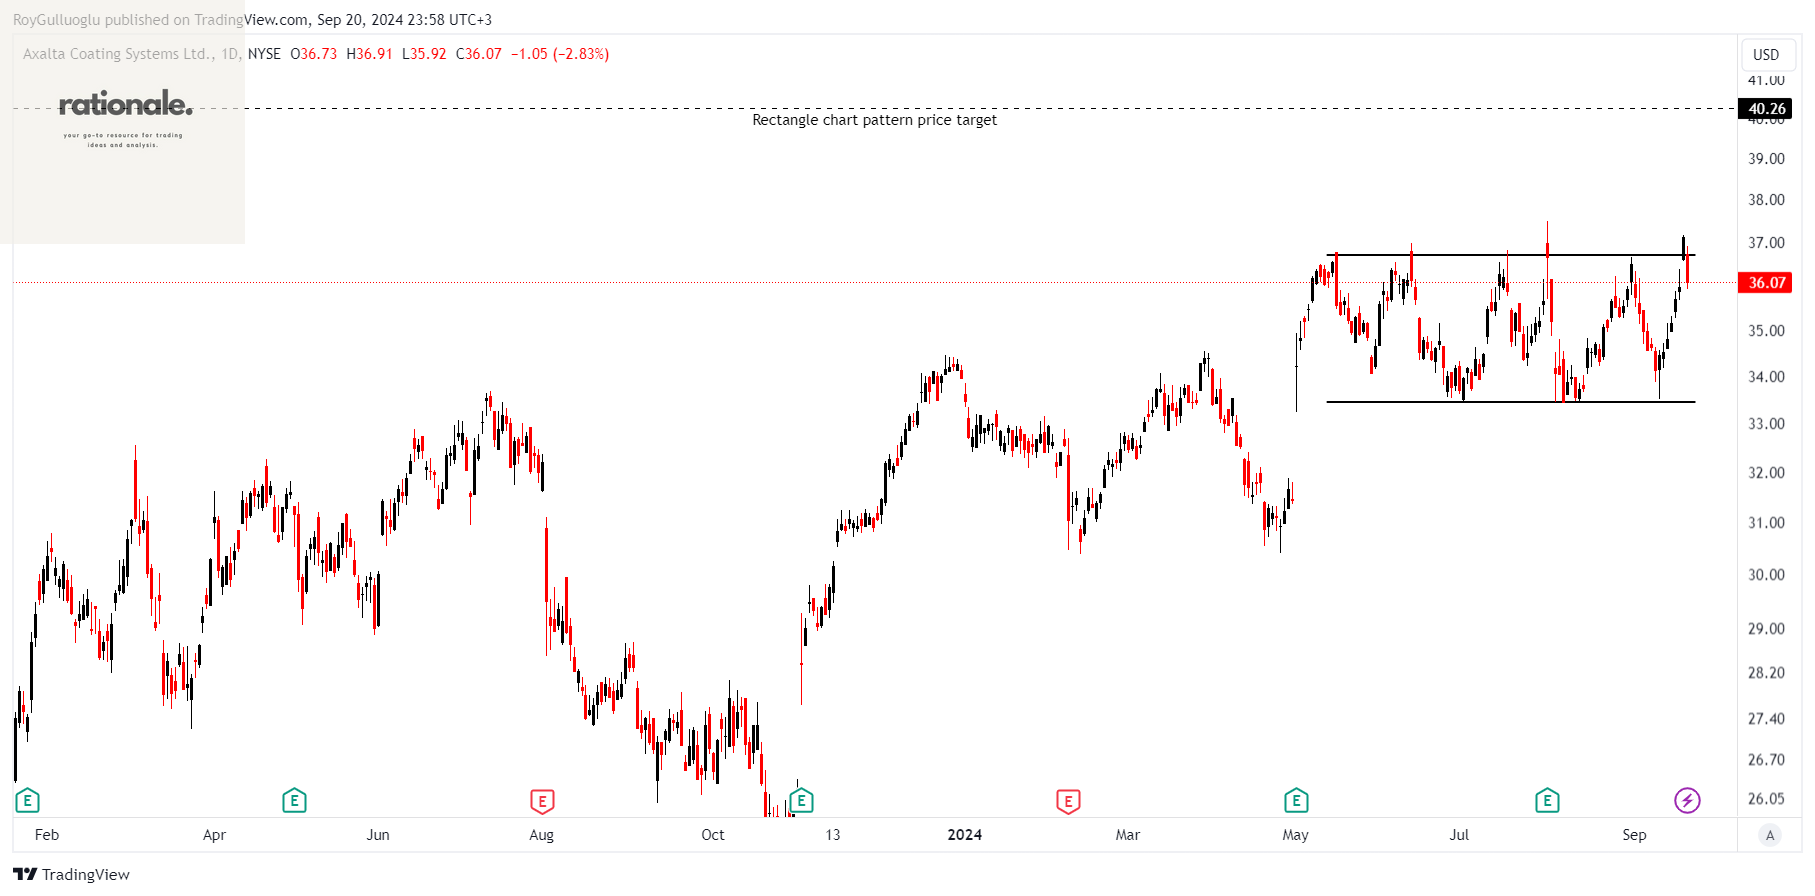
Axalta Coating Systems Ltd. manufactures, markets, and distributes high-performance coatings through its subsidiaries across North America, Europe, the Middle East, Africa, the Asia Pacific, and Latin America.
The above daily chart formed an approximately 3-month-long rectangle chart pattern as a bullish continuation after an uptrend.
The horizontal boundary at 36.7 levels acts as a resistance within this pattern.
A daily close above 37.8 levels would validate the breakout from the 3-month-long rectangle chart pattern.
Based on this chart pattern, the potential price target is 40.26 levels.
AXTA, classified under the "basic materials" sector, falls under the “Mid Cap - Value” stock category.
NKT A/S-(NKT/OMXCOP)-Long Idea
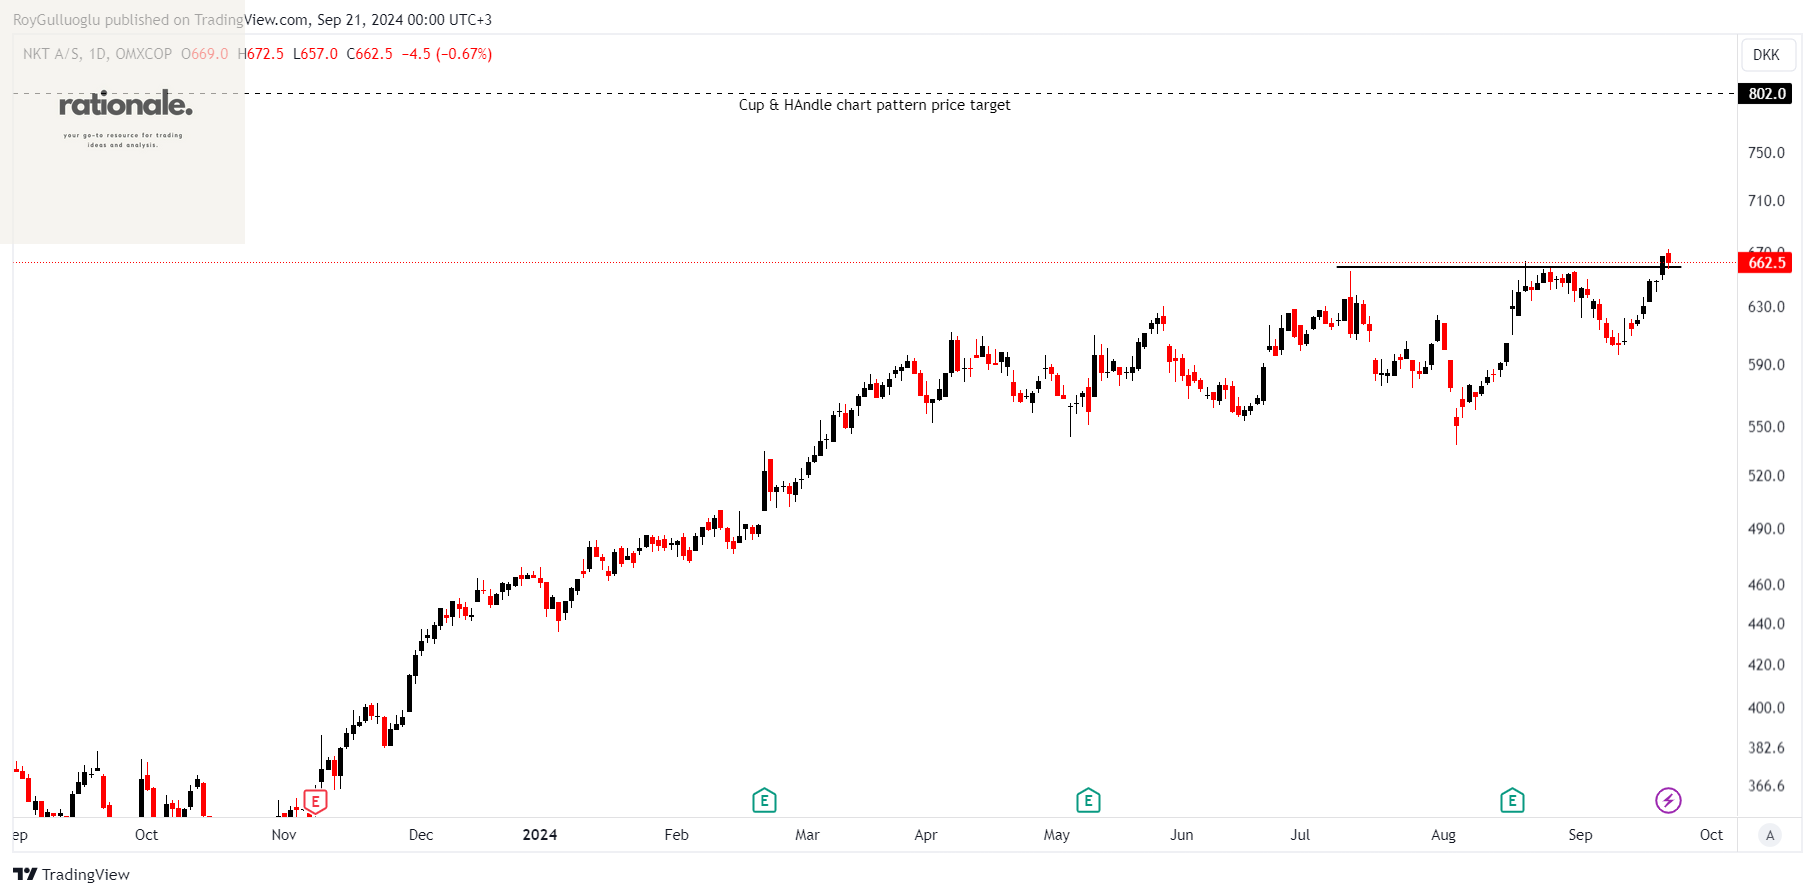
NKT A/S develops, manufactures, and markets cables, accessories, and solutions in Denmark and globally. It operates through three segments: Solutions, Applications, and Service & Accessories.
The above daily chart formed an approximately 2-month-long cup & handle chart pattern as a bullish continuation after an uptrend.
The horizontal boundary at 658.5 levels acts as a resistance within this pattern.
A daily close above 678.25 levels would validate the breakout from the 2-month-long cup & handle chart pattern.
Based on this chart pattern, the potential price target is 802 levels.
NKT, classified under the "industrials" sector, falls under the “Mid Cap - Value” stock category.
Amundi S.A.-(AMUN/EURONEXT)-Long Idea
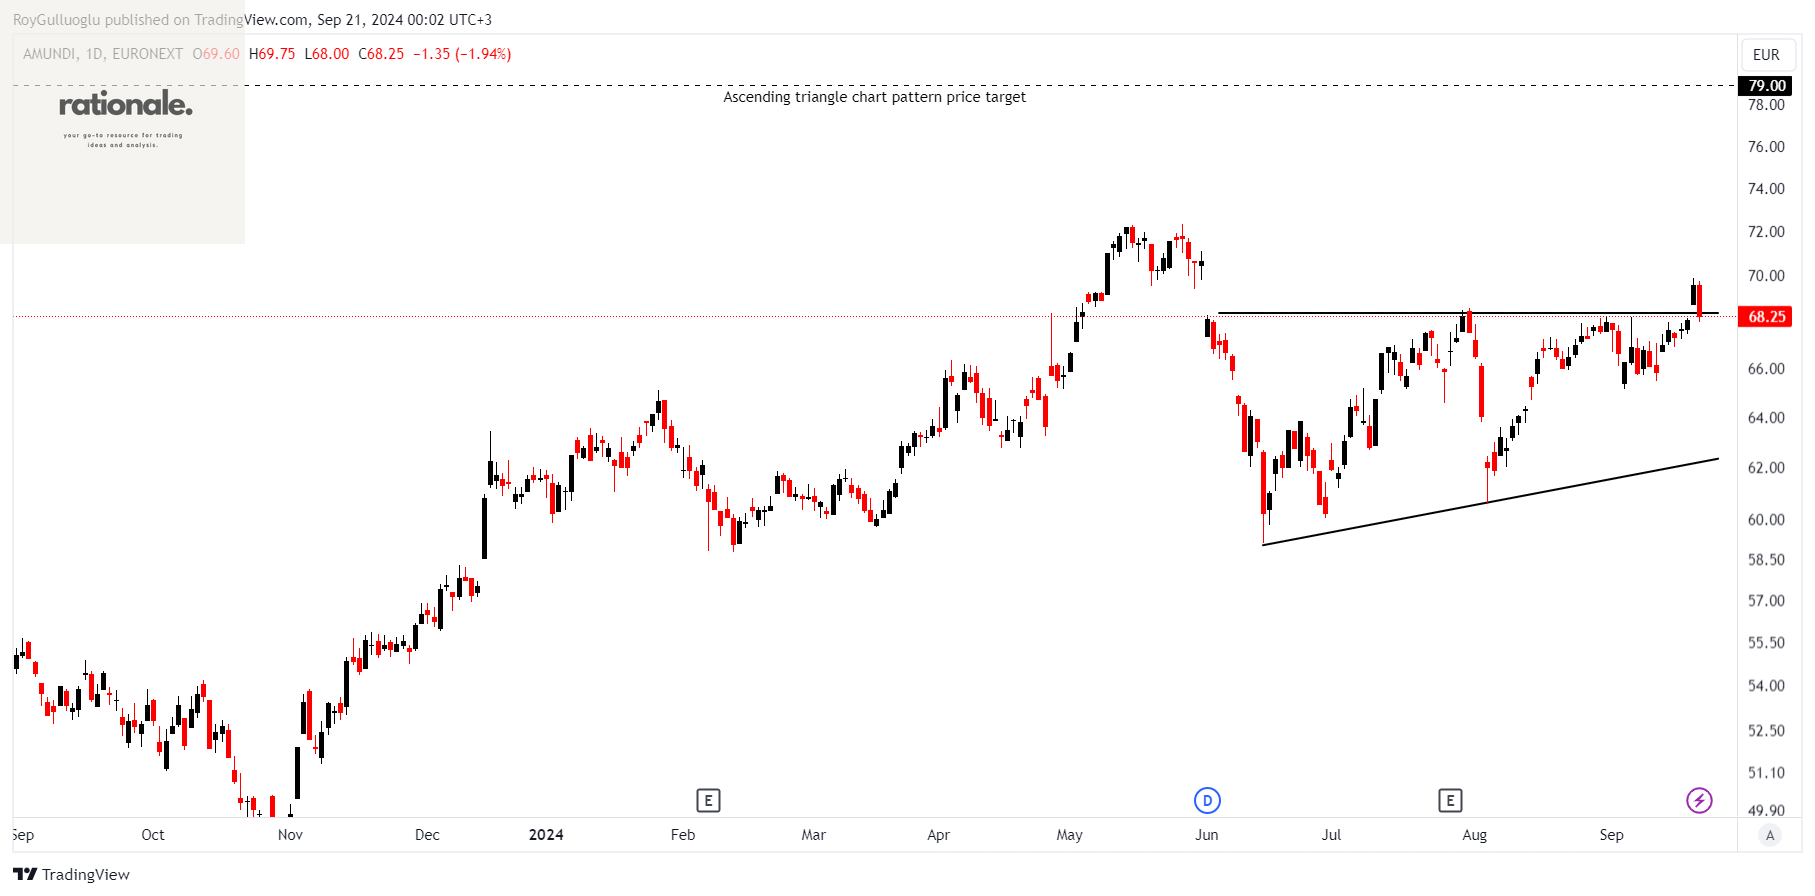
Amundi is a publicly owned investment manager specializing in asset management services.
The above daily chart formed an approximately 3-month-long ascending triangle chart pattern as a bullish reversal after a downtrend.
The horizontal boundary at 68.35 levels acts as a resistance within this pattern.
A daily close above 70.4 levels would validate the breakout from the 3-month-long ascending triangle chart pattern.
Based on this chart pattern, the potential price target is 79 levels.
AMUN, classified under the "financial services" sector, falls under the “Large Cap - Income” stock category.