

New setups
TICKERS: CHFJPY, XW1!(CBOT), ZC1!(CBOT), ARKQ(ARCA), IOTAUSDT
CHFJPY-Short Idea
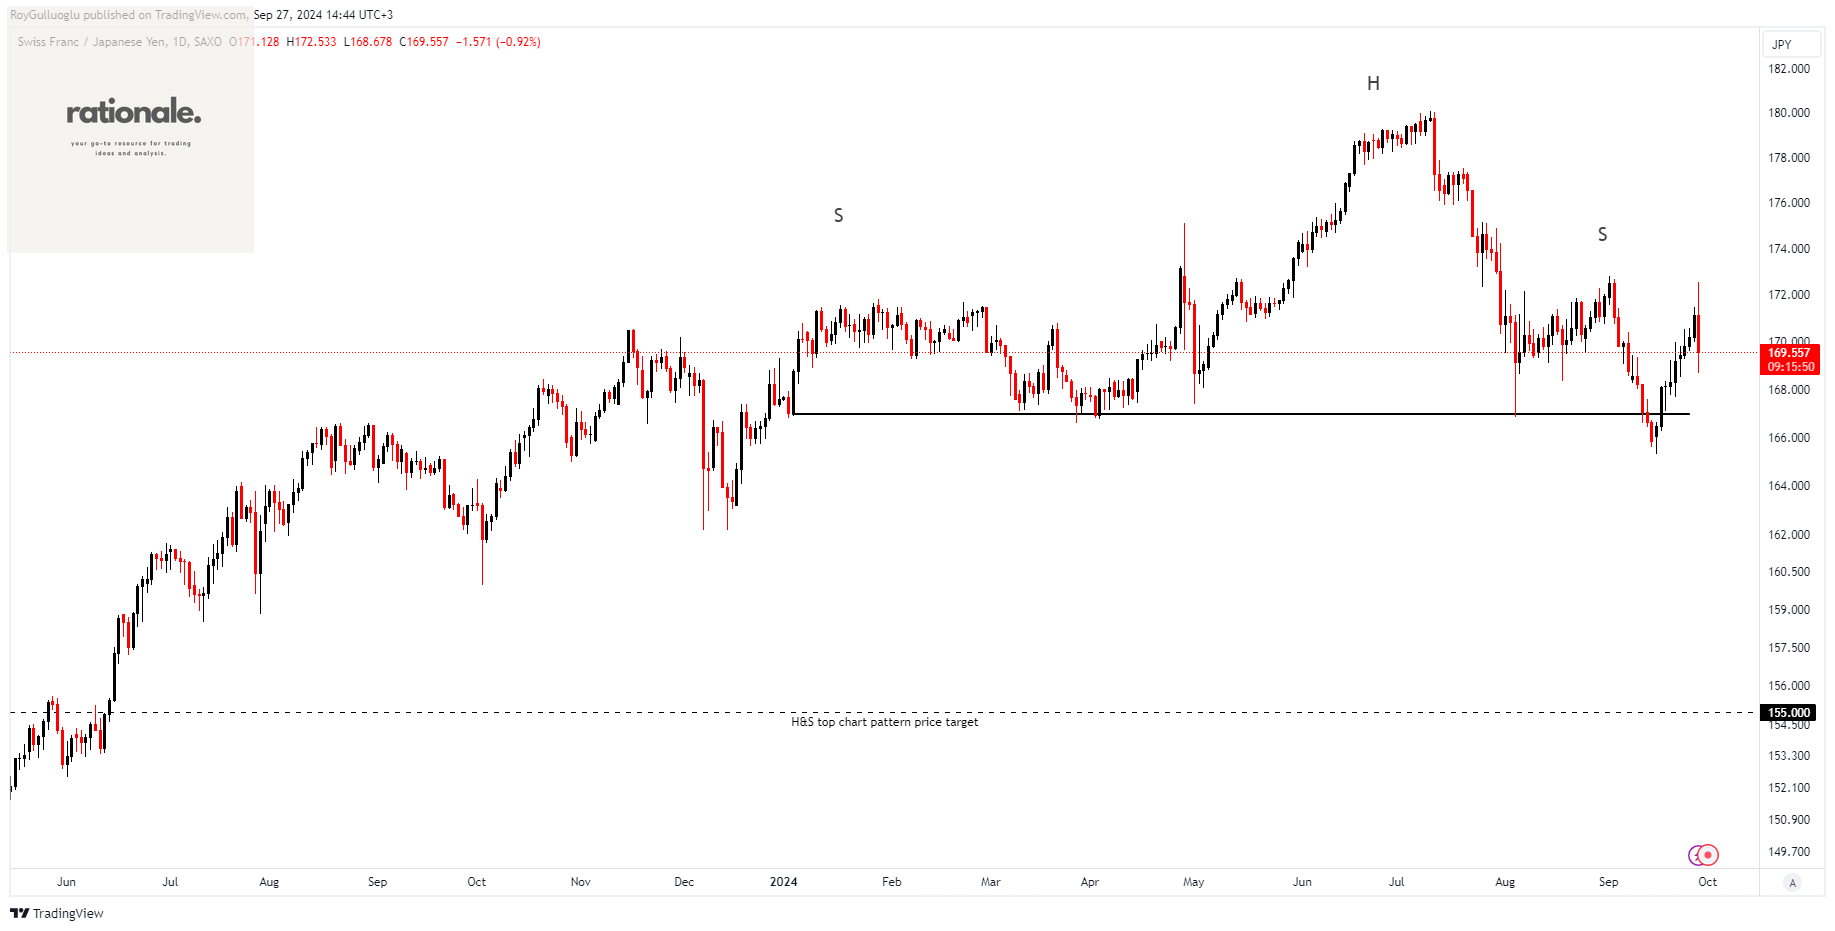
The above daily chart formed an approximately 6-month-long H&S top chart pattern as a bearish reversal after an uptrend.
Within this pattern, the horizontal boundary at 167 levels acts as a support.
A daily close below 165.33 levels (%1 or %1.5 low of the support for FX, Futures) would validate the breakdown from the 6-month-long H&S top chart pattern.
Based on this chart pattern, the potential price target is approximately 155 levels.
The Swiss National Bank (SNB) cut its policy rate by 25bps to 1.00% at Thursday's meeting, with some arguing for a larger reduction to counter downside inflation risks. Inflationary pressure in Switzerland has already subsided, with the annual consumer price index at just 1.1%, aligning with the SNB's 2025 forecast. Last week, the Swiss government further reduced inflation forecasts to 1.2% for this year and 0.7% for next year, adding pressure on the SNB to ease monetary policy and curb the franc's appreciation. Considering the hawkish stance of the Bank of Japan, a CHF/JPY short trade idea could be worth evaluating.
XW1!(Wheat Mini Futures)-Long Idea
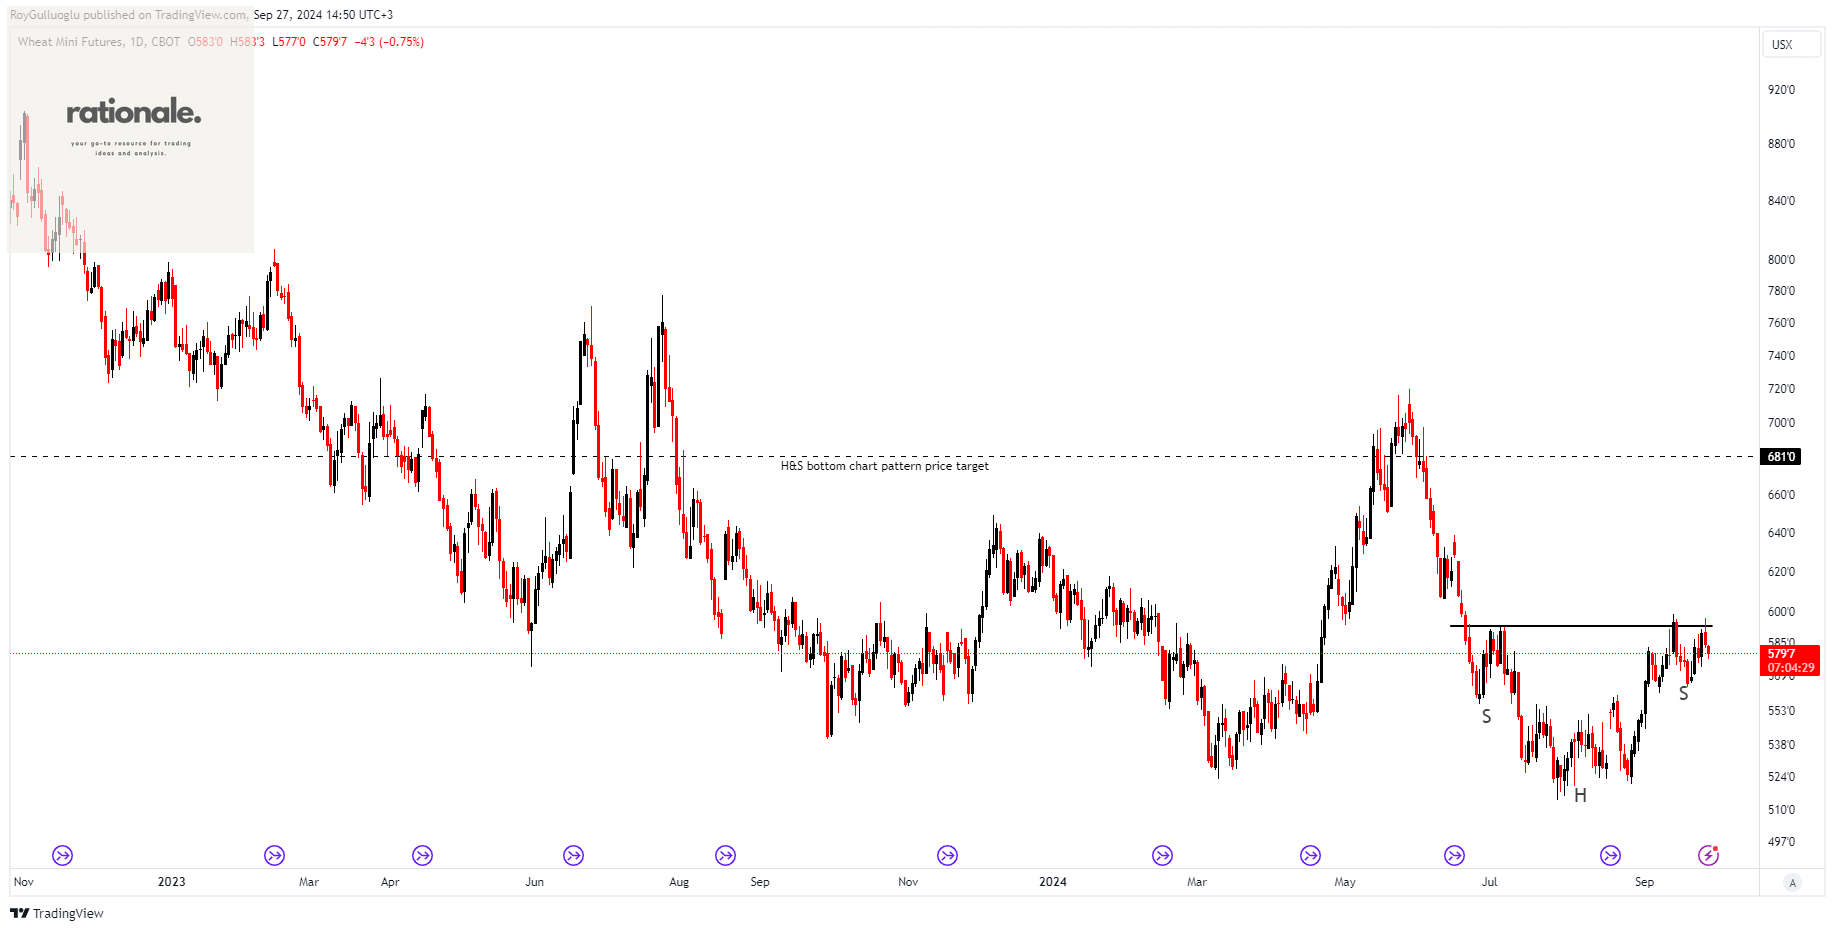
The above daily chart formed an approximately 3-month-long H&S bottom chart pattern as a bullish reversal after a downtrend.
Within this pattern, the horizontal boundary at 592 levels acts as a resistance.
A daily close above 600(%1 or %1.5 high of the resistance for FX, Futures) levels would validate the breakout from the H&S bottom chart pattern.
Based on this chart pattern, the potential price target is 681 levels.
ZC1!(Corn Futures)-Long Idea
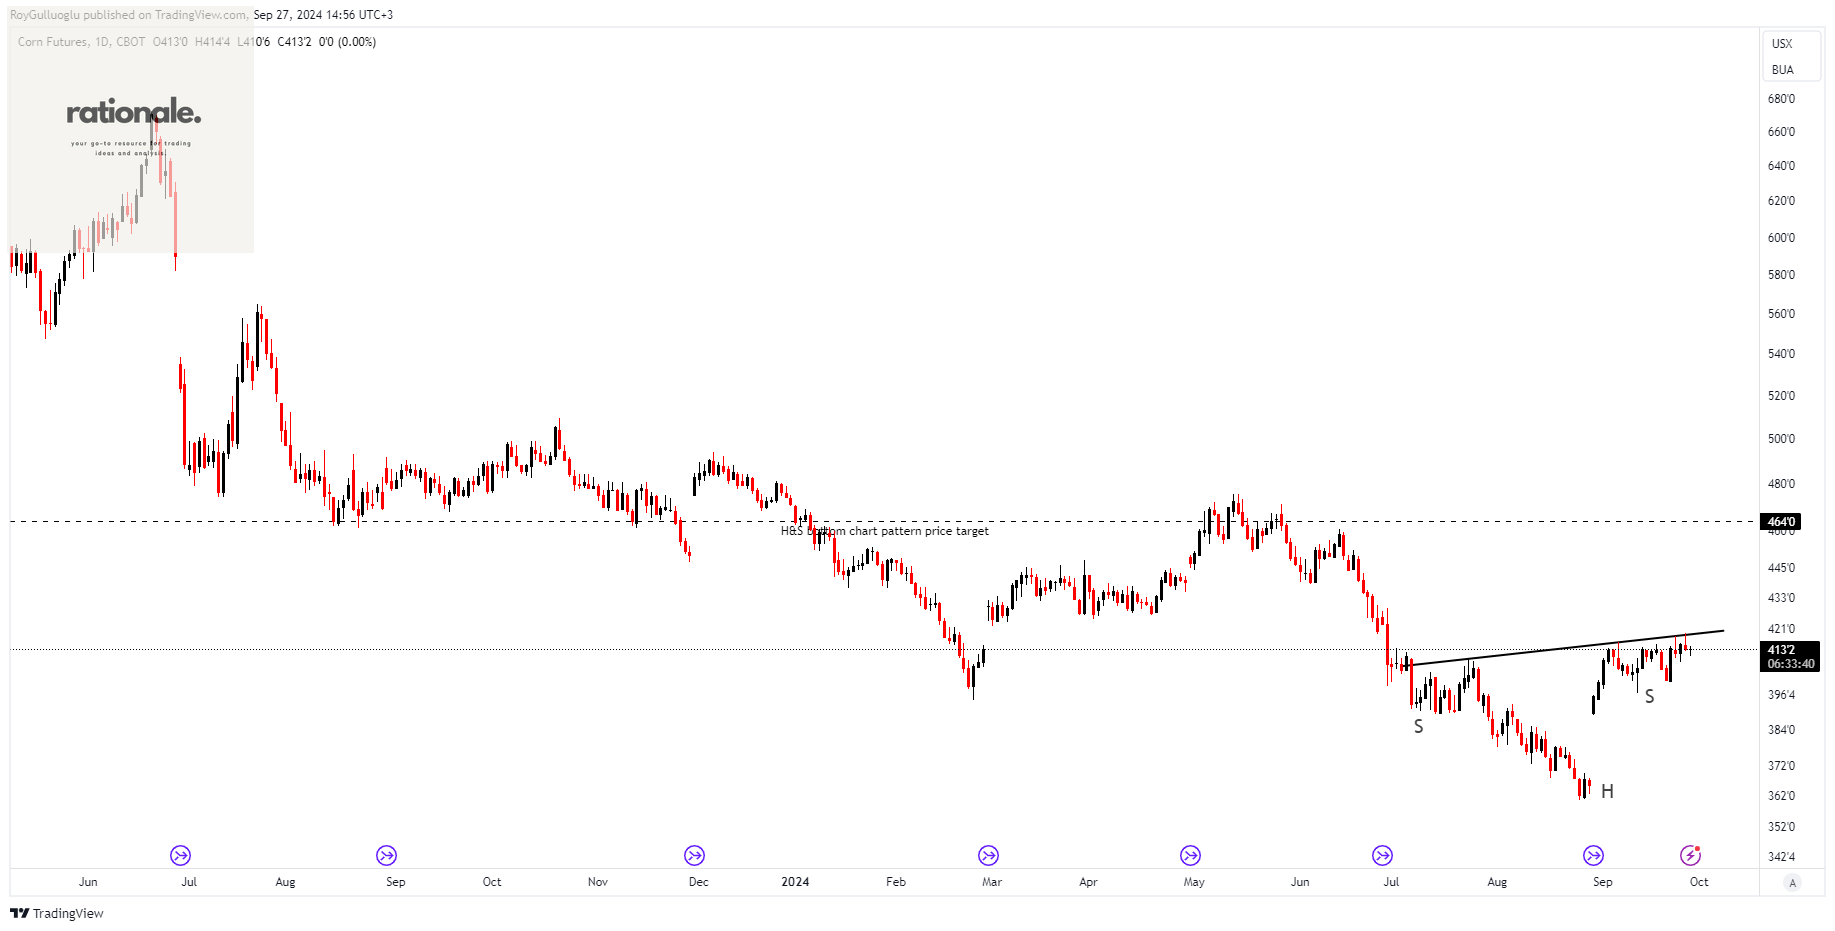
The above daily chart formed an approximately 2-month-long H&S bottom chart pattern as a bullish reversal after a downtrend.
Within this pattern, the horizontal boundary at 419 levels acts as a resistance.
A daily close above 425(%1 or %1.5 high of the resistance for FX, Futures) levels would validate the breakout from the H&S bottom chart pattern.
Based on this chart pattern, the potential price target is 464 levels.
ARK Autonomous Technology & Robotics ETF-(ARKQ/ARCA)-Long Idea
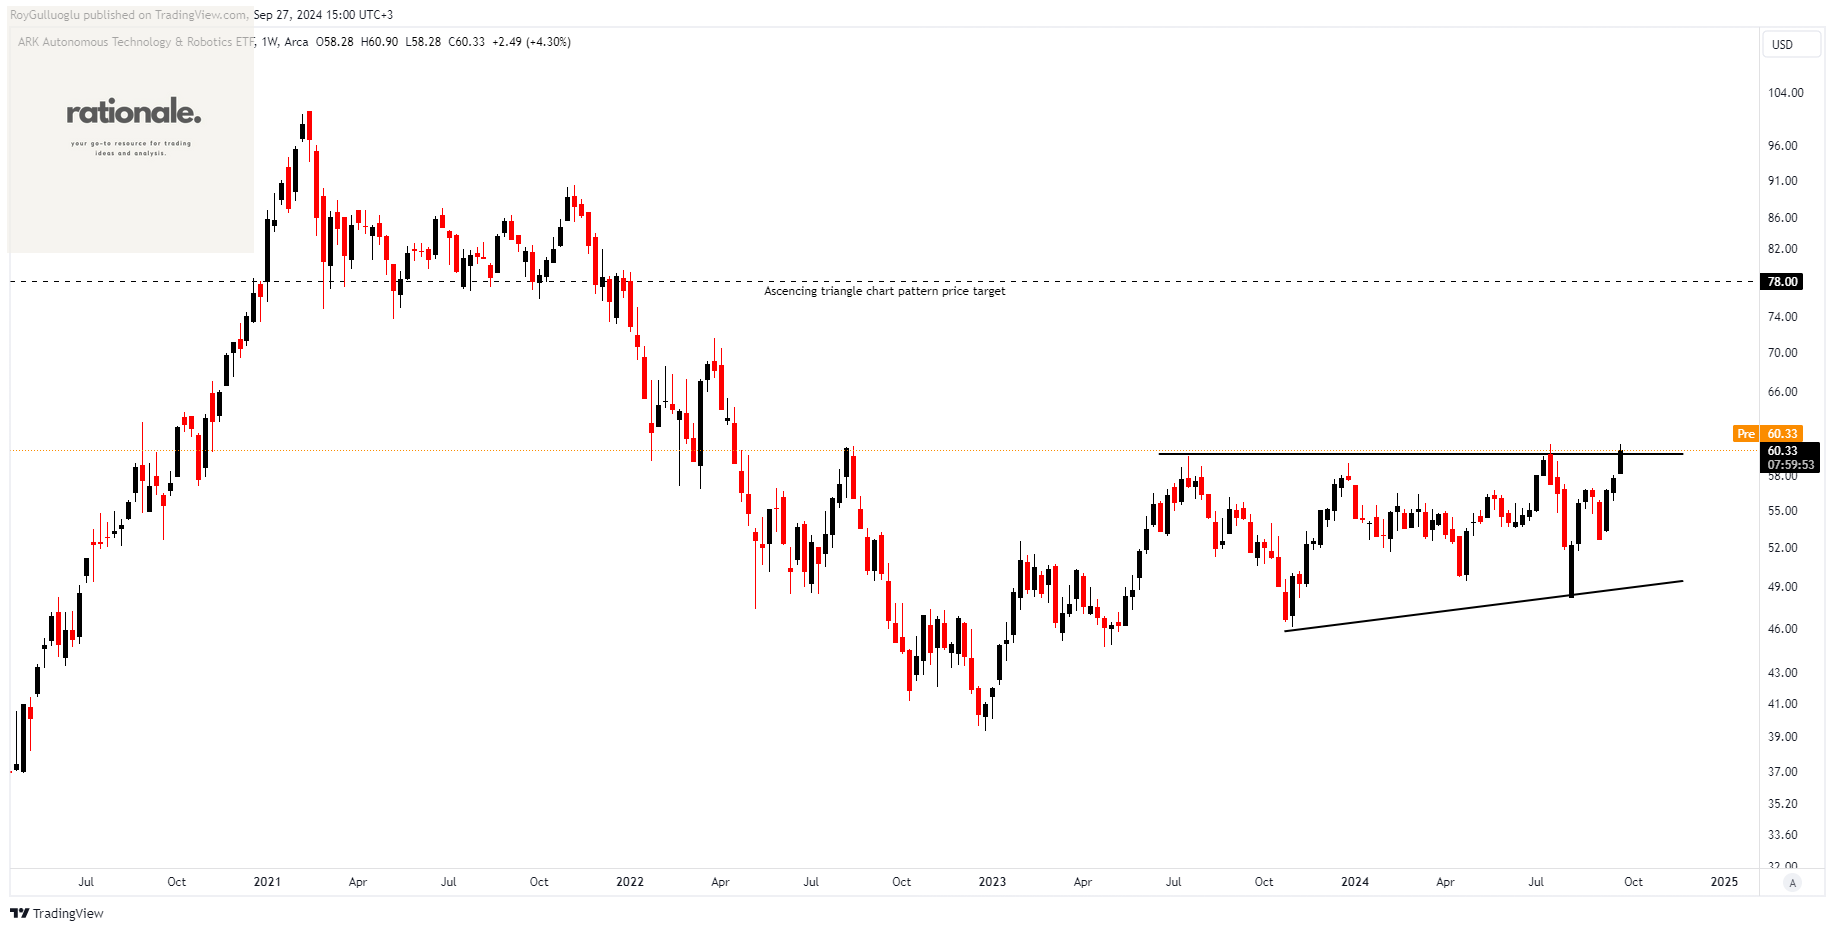
ARKQ is an actively managed ETF focused on identifying companies that benefit from new technologies and automation. It targets transformative businesses in areas like automation, energy, and artificial intelligence. Unlike broad tech funds, ARKQ uses its own research to select companies involved in disruptive innovations, making portfolio implementation more thematic and specific rather than broad-based.
The above weekly chart formed an approximately 15-month-long ascending triangle chart pattern as a bullish continuation after an uptrend.
Within this pattern, the horizontal boundary at 60 levels acts as a resistance.
A daily close above 61.8 levels would validate the breakout from the 15-month-long ascending triangle chart pattern.
Based on this chart pattern, the potential price target is 78 levels.
IOTAUSDT - Long Idea

The above daily chart formed an approximately 2-month-long ascending triangle chart pattern as a bullish reversal after a downtrend.
Within this pattern, 0.1495 levels act as resistance.
A daily close above 0.1539 levels would validate the breakout from the 2-month-long ascending triangle chart pattern.
Based on this chart pattern, the potential price target is 0.217 levels.
Teşekkürler Roy.. Mısır ve Buğday vadelileri hangi platform üzerinden açıyorsun?