


Netflix, Inc.-(NFLX/NASDAQ)-Long Idea
Netflix, Inc. provides entertainment services. It offers TV series, documentaries, feature films, and games across various genres and languages.
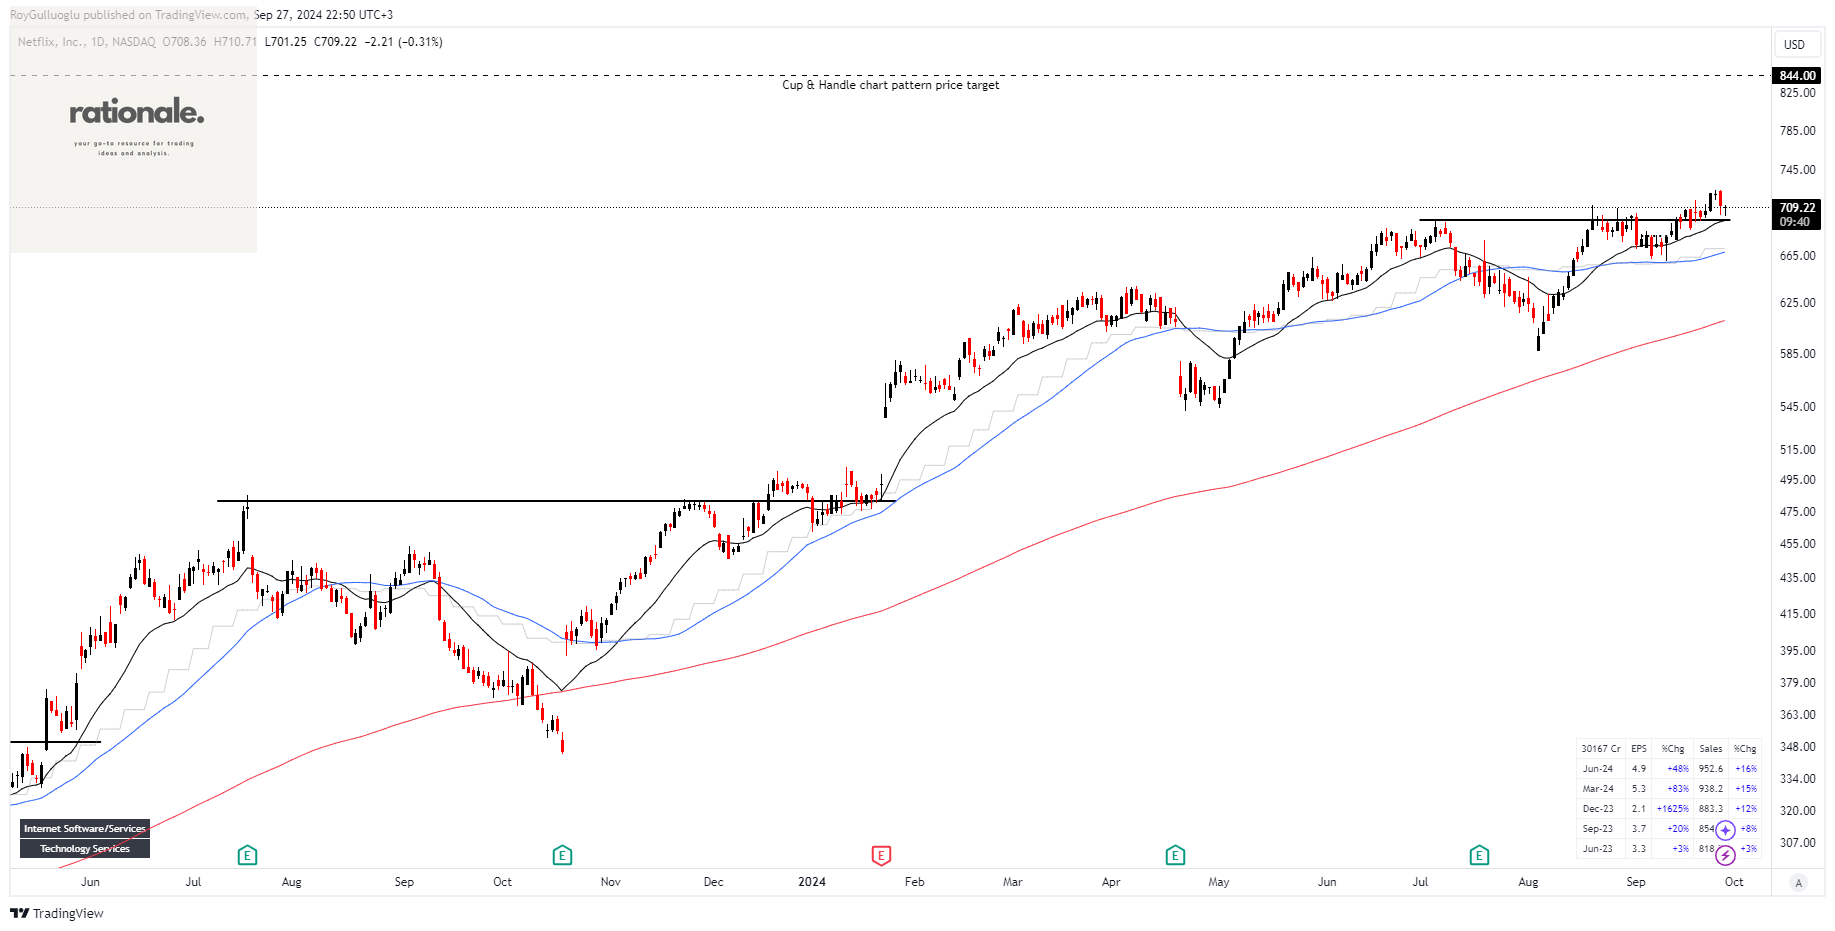
The above daily chart formed an approximately 2-month-long Cup & Handle continuation chart pattern as a bullish continuation after an uptrend.
The horizontal boundary at 697.5 levels acted as a resistance within this pattern.
A daily close above 718.42 levels validated the breakout from the 2-month-long Cup & Handle continuation chart pattern.
Currently, the price pulled back to the support level.
Based on this chart pattern, the potential price target is 844 levels.
NFLX, classified under the "communications" sector, falls under the “Large Cap - Growth” stock category.
Booz Allen Hamilton Holding Corporation-(BAH/NYSE)-Long Idea
Booz Allen Hamilton Holding Corporation provides management and technology consulting, analytics, engineering, digital solutions, mission operations, and cyber services to governments, corporations, and not-for-profit organizations in the United States and internationally.
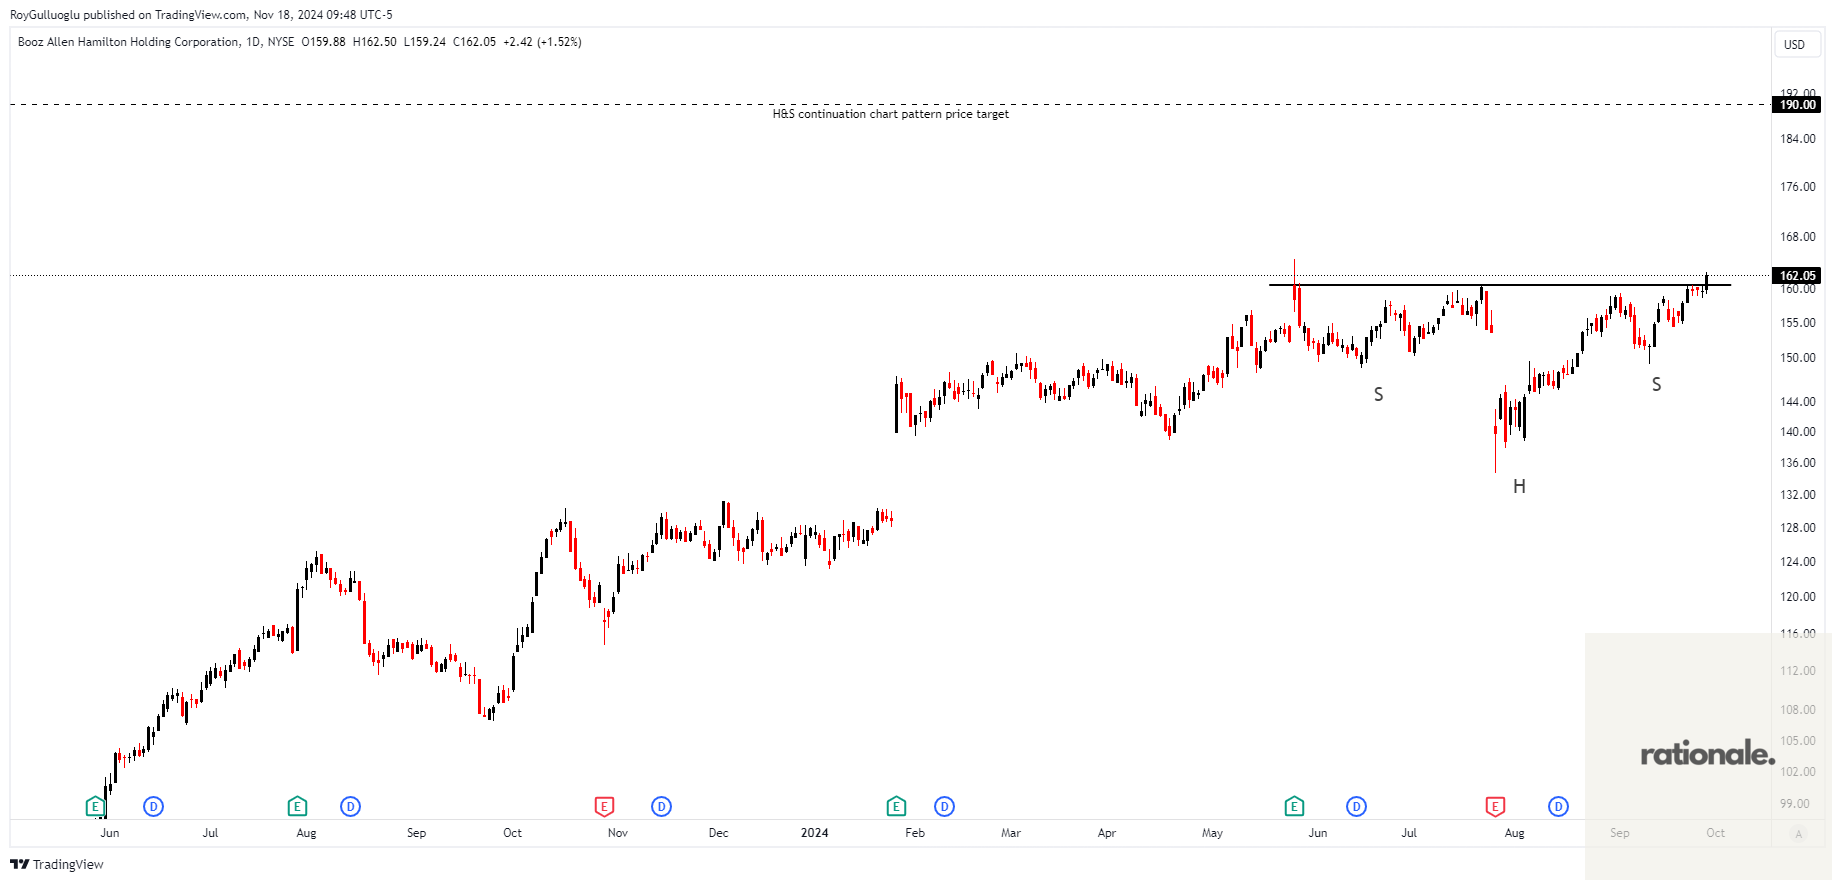
The above daily chart formed an approximately 3-month-long H&S continuation chart pattern as a bullish continuation after an uptrend.
The horizontal boundary at 160.5 levels acts as a resistance within this pattern.
A daily close above 165.31 levels would validate the breakout from the 3-month-long H&S continuation chart pattern.
Based on this chart pattern, the potential price target is 190 levels.
BAH, classified under the "industrials" sector, falls under the “Large Cap - Value” stock category.
Tesla, Inc.-(TSLA/NASDAQ)-Long Idea
Tesla, Inc. designs, develops, manufactures, leases, and sells electric vehicles, and energy generation and storage systems in the United States, China, and internationally.
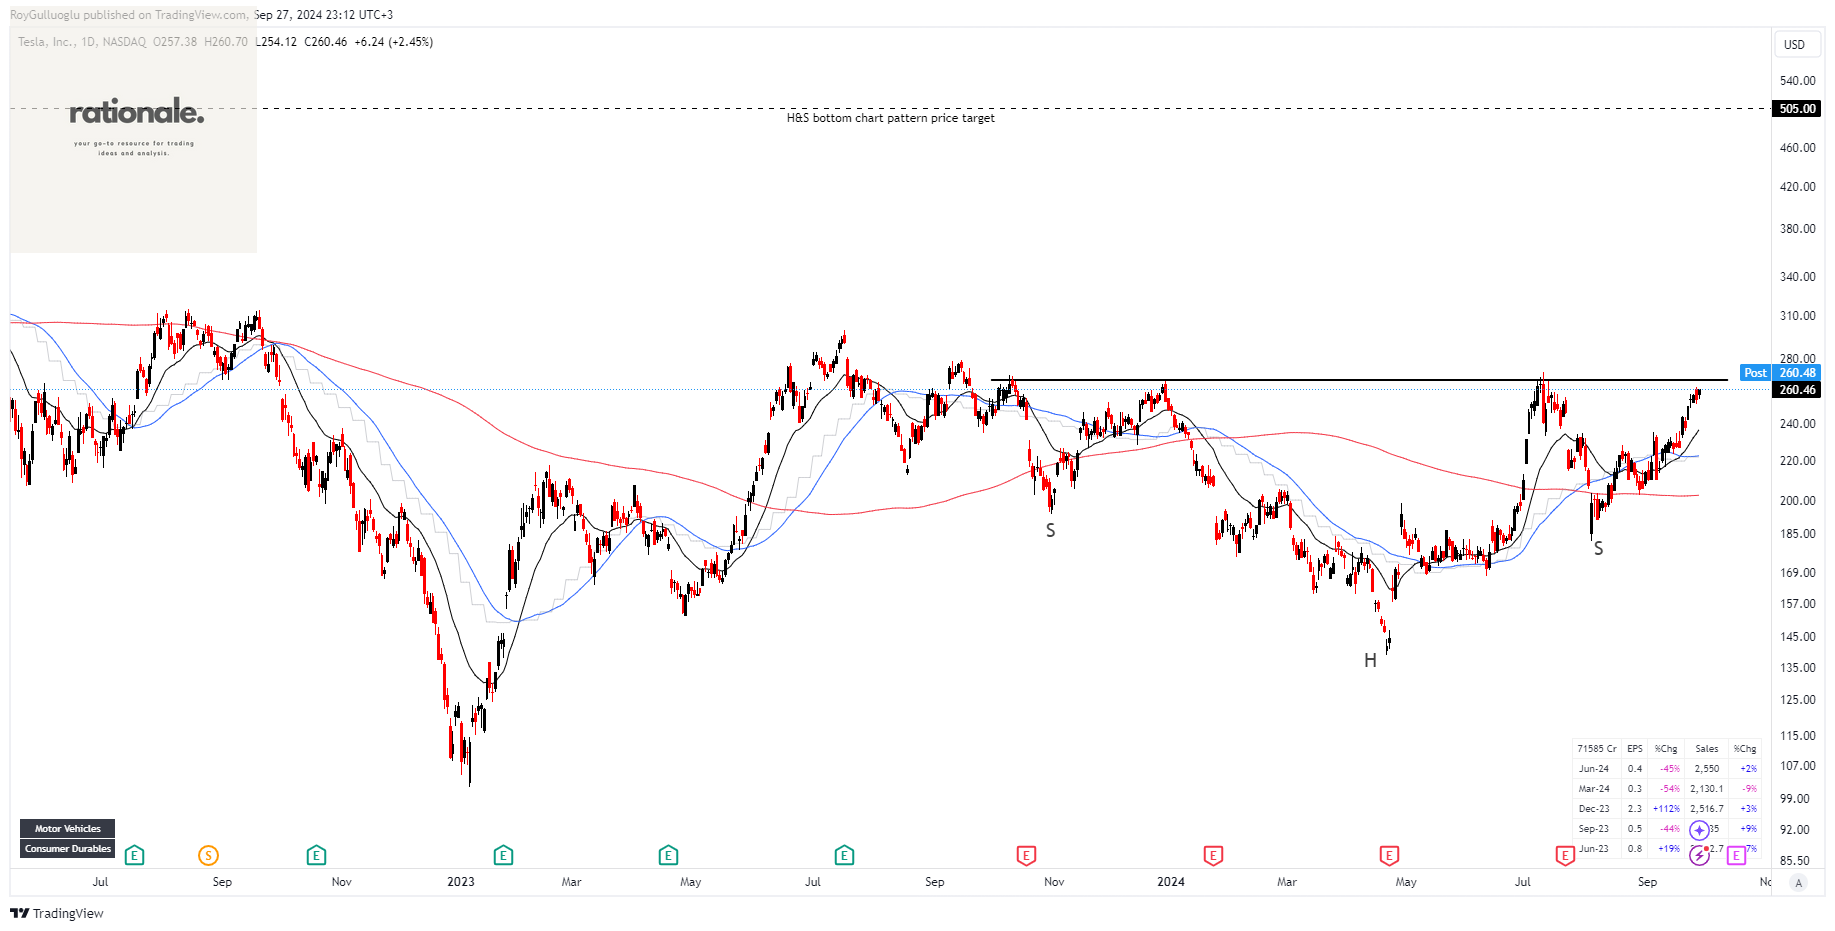
The above daily chart formed an approximately 8-month-long H&S continuation chart pattern as a bullish continuation after an uptrend.
The horizontal boundary at 260 levels acts as a resistance within this pattern.
A daily close above 267.8 levels validated the breakout from the 8-month-long H&S continuation chart pattern.
Based on this chart pattern, the potential price target is 505 levels.
TSLA, classified under the "consumer cyclical" sector, falls under the “Large Cap - Growth” stock category.
BWX Technologies, Inc.-(BWXT/NYSE)-Long Idea
BWX Technologies, Inc., together with its subsidiaries, manufactures and sells nuclear components in the United States, Canada, and internationally.
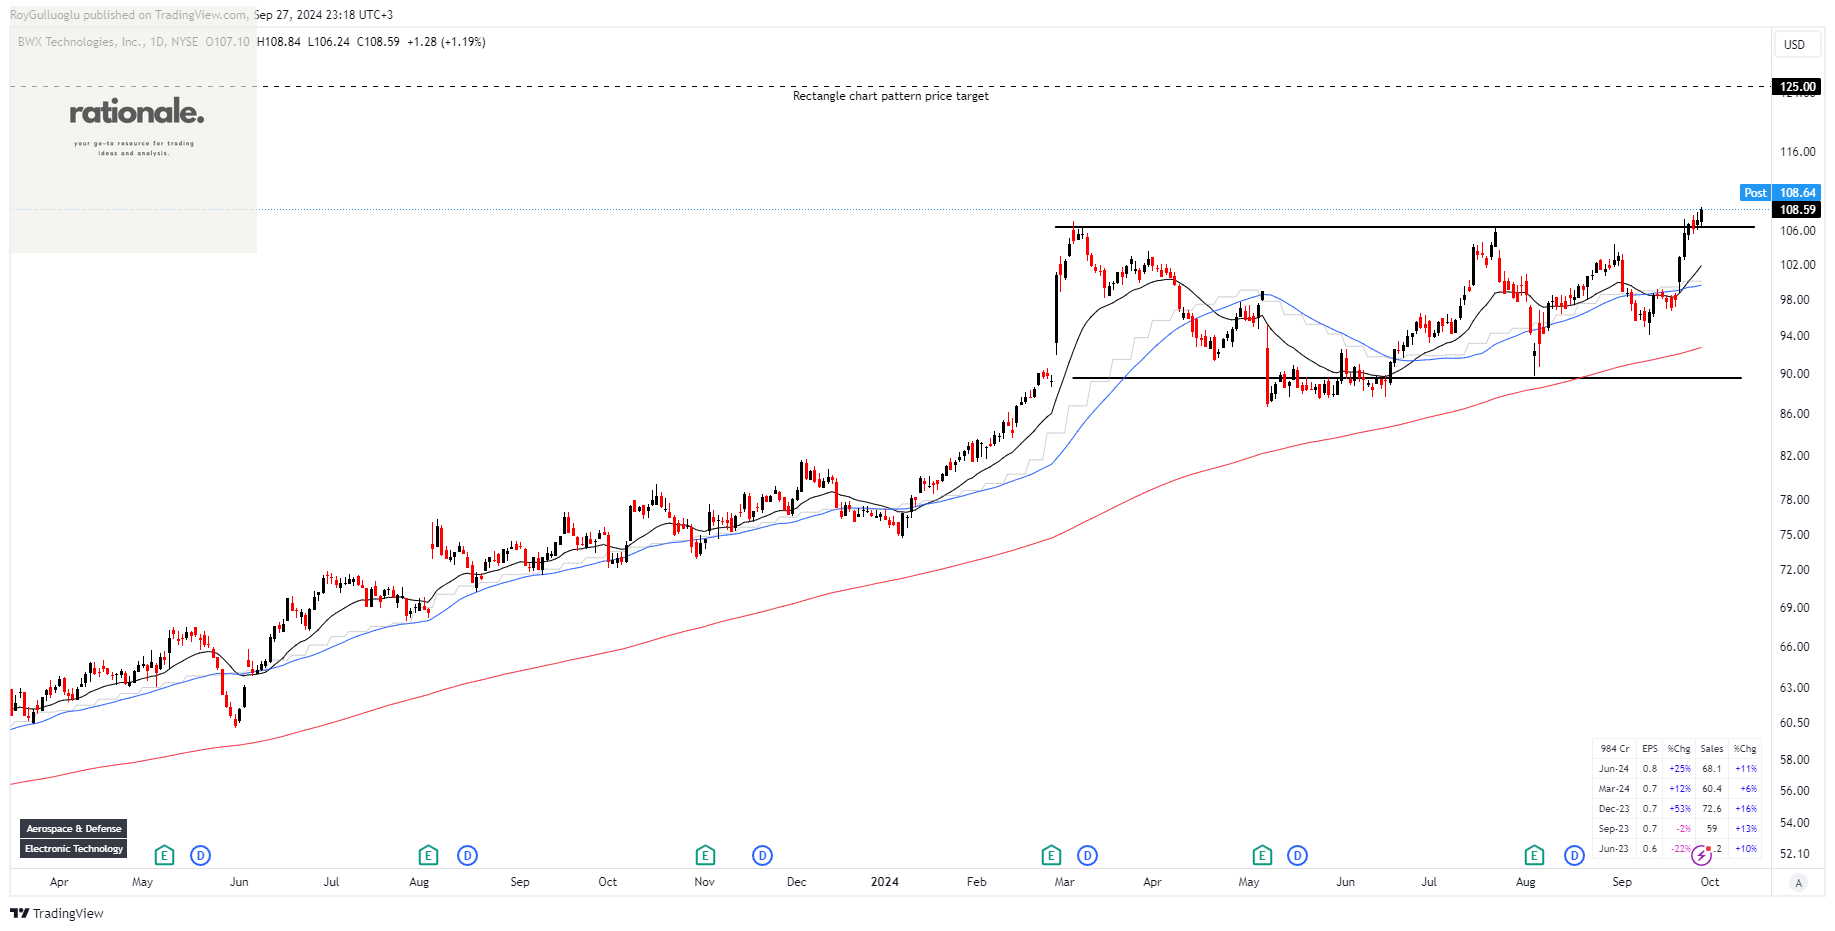
The above daily chart formed an approximately 5-month-long rectangle chart pattern as a bullish continuation after an uptrend.
The horizontal boundary at 106.36 levels acts as a resistance within this pattern.
A daily close above 109.55 levels would validate the breakout from the 5-month-long rectangle chart pattern.
Based on this chart pattern, the potential price target is 125 levels.
BWXT, classified under the "industrials" sector, falls under the “Mid Cap - Value” stock category.
Novo Nordisk A/S-(NOVO/OMXCOP)-Short Idea
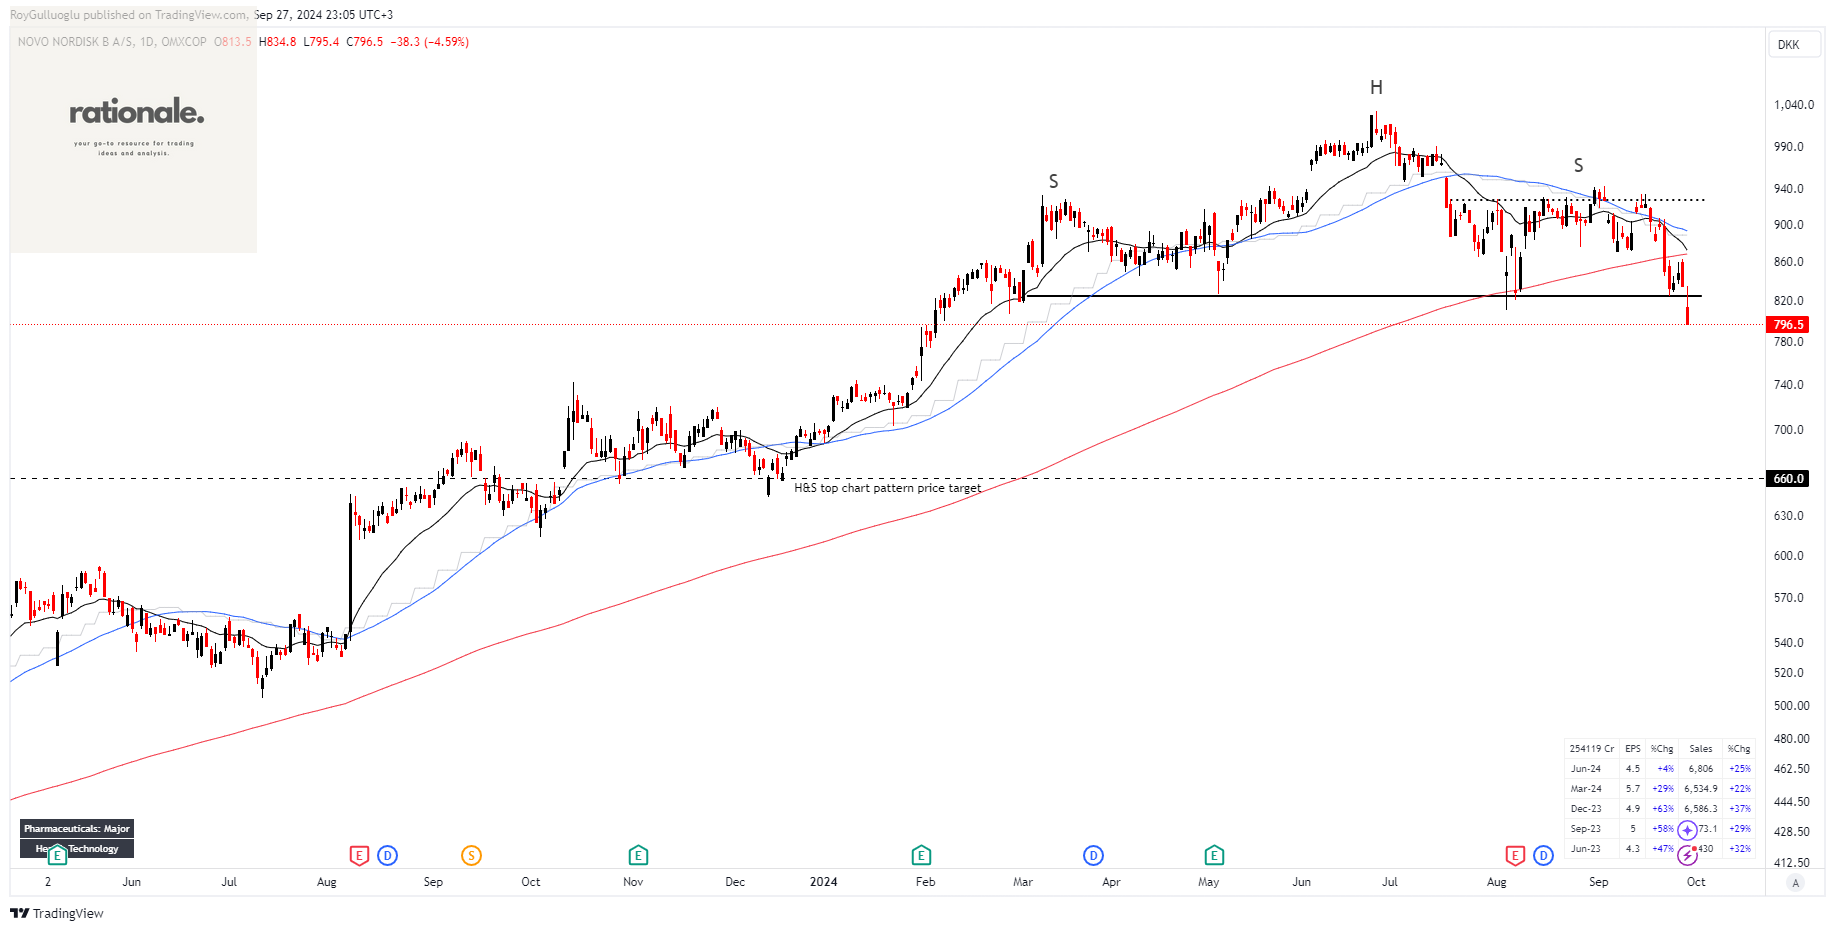
Novo Nordisk A/S, together with its subsidiaries, engages in the research and development, manufacture, and distribution of pharmaceutical products in Europe, the Middle East, Africa, Mainland China, Hong Kong, Taiwan, North America, and internationally.
The above daily chart formed an approximately 5-month-long H&S top chart pattern as a bearish reversal after an uptrend.
The horizontal boundary at 824.3 levels acts as a support within this pattern.
A daily close below 799.57 levels validated the breakdown from the 5-month-long H&S top chart pattern.
Based on this chart pattern, the potential price target is 660 levels.
NOVO, classified under the "healthcare" sector, falls under the “Large Cap - Value” stock category.