

Trade Ideas Fx-Futures-Etf-Crypto
USDCAD, ICLN(ARCA), QQQ(ARCA), XRT(ARCA)

USDCAD-Long Idea
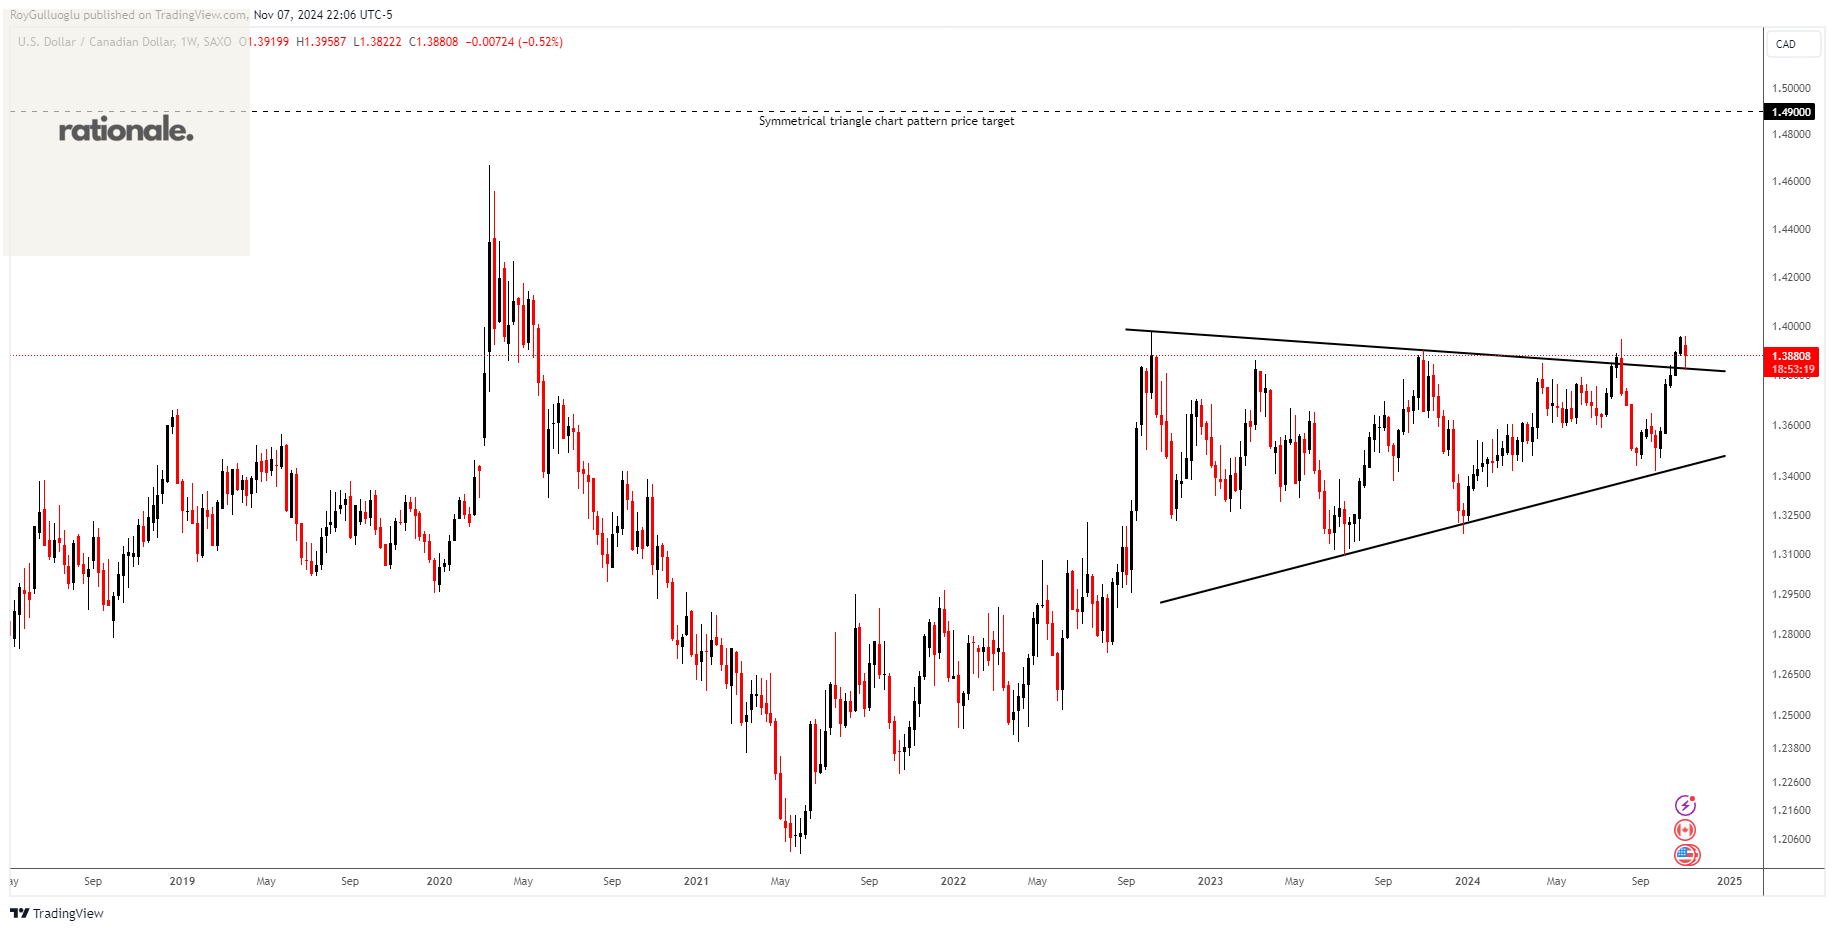
The above weekly chart formed an approximately 25-month-long symmetrical triangle chart pattern as a bullish continuation after an uptrend.
The horizontal boundary at 1.39 levels acts as a resistance within this pattern.
A daily close above 1.4039 levels (%1 or %1.5 low of the support for FX, Futures) would validate the breakout from the 25-month-long symmetrical triangle chart pattern.
Based on this chart pattern, the potential price target is approximately 1.49 levels.
iShares Global Clean Energy ETF-(ICLN/ARCA)-Short Idea
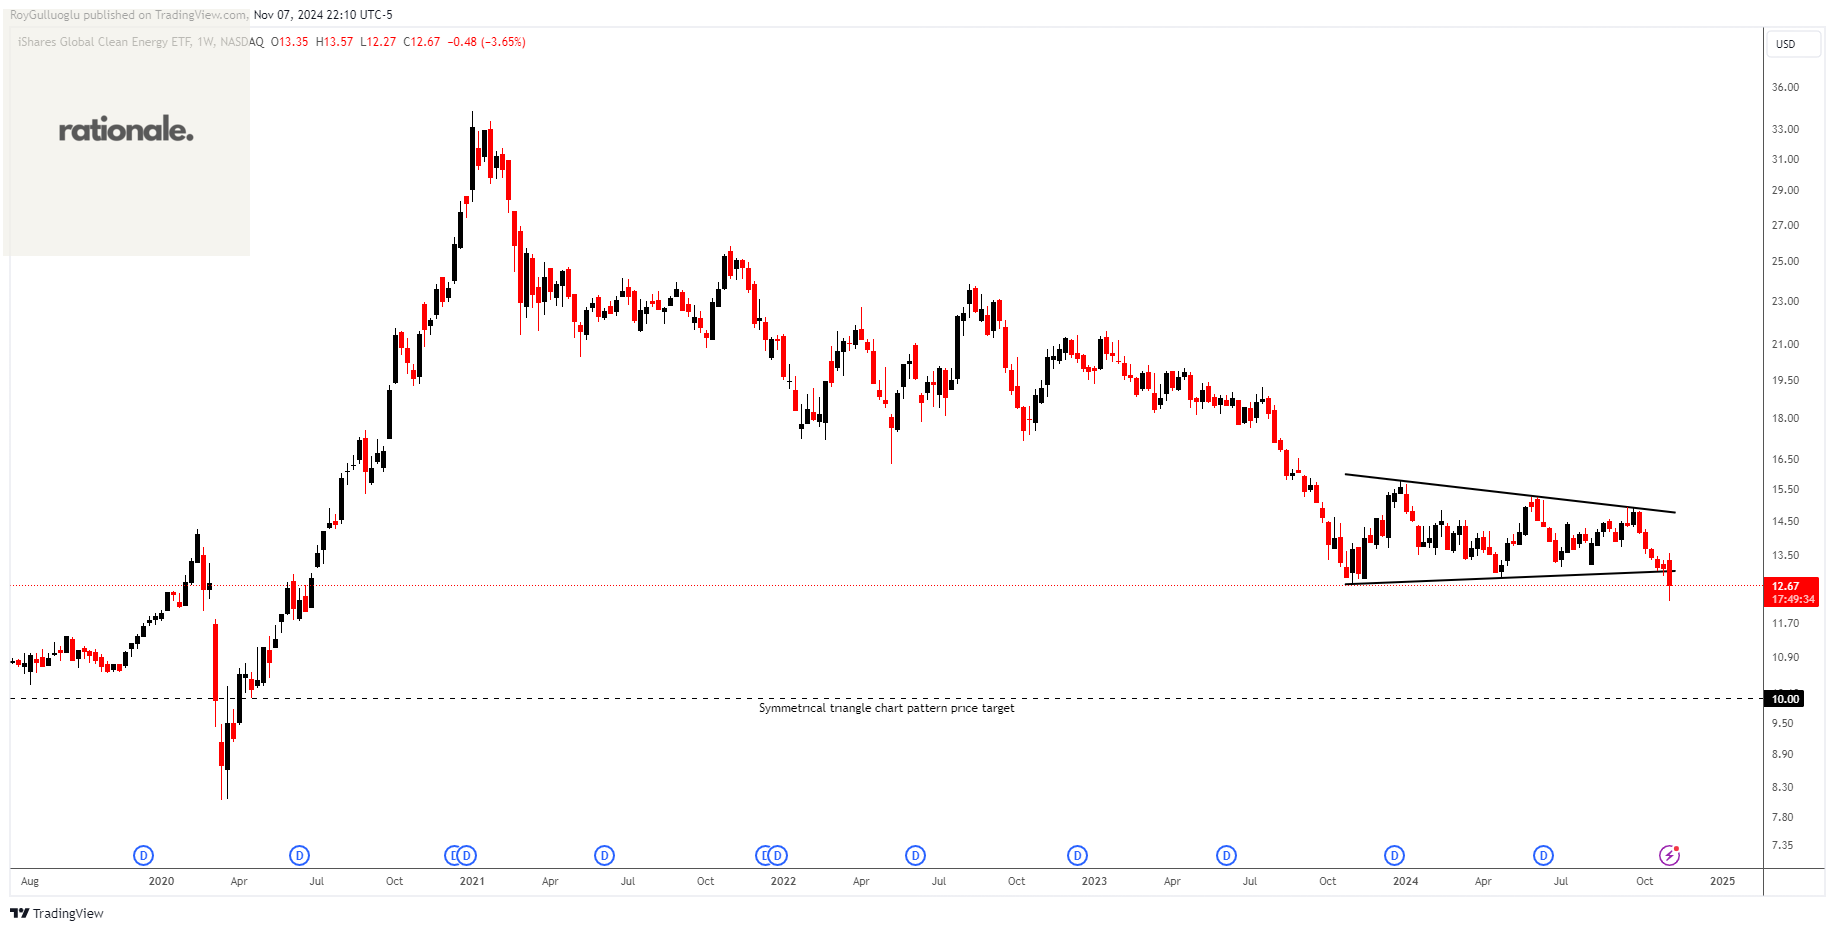
ICLN invests in global clean energy companies, which are defined as those involved in the biofuels, ethanol, geothermal, hydroelectric, solar, and wind industries.
The above weekly chart formed an approximately 12-month-long H&S top chart pattern as a bearish reversal after an uptrend.
A daily close below 12.47 levels would validate the breakdown from the 12-month-long H&S top chart pattern.
Based on this chart pattern, the potential price target is approximately 10 levels.
Invesco QQQ Trust-(QQQ/ARCA)-Long Idea
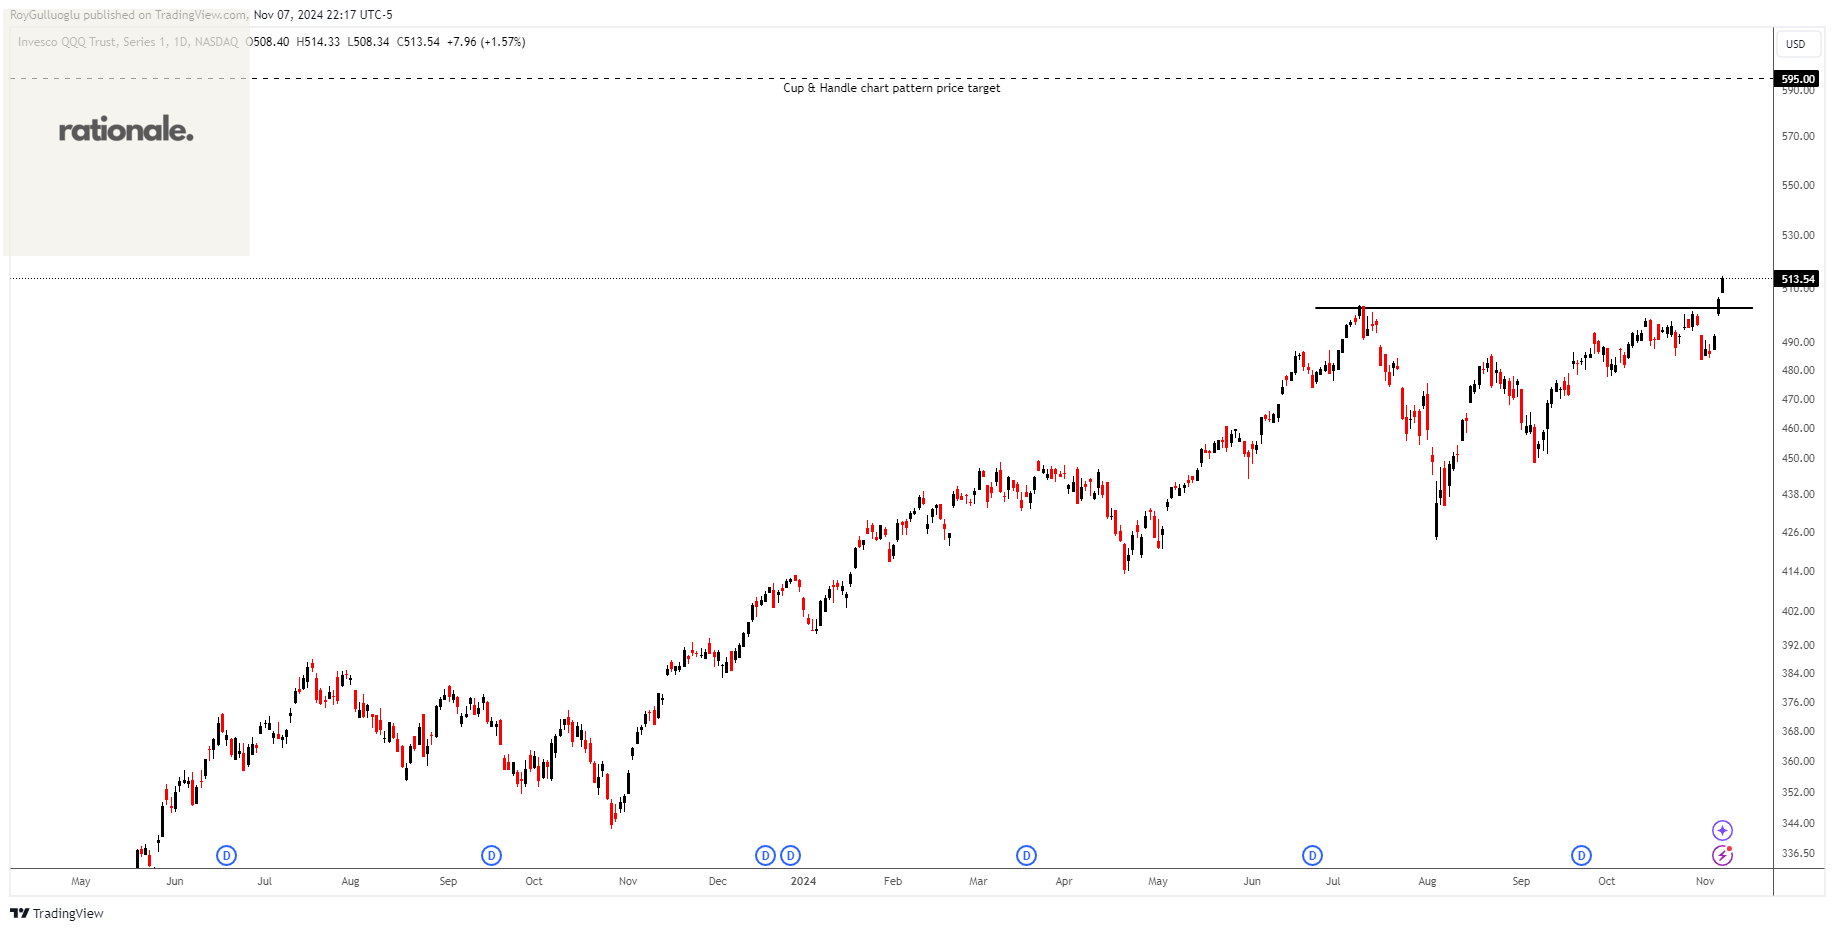
QQQ tracks a modified-market-cap-weighted index of 100 NASDAQ-listed stocks.
The above weekly chart formed an approximately 3-month-long cup & handle chart pattern as a bullish continuation after an uptrend.
Within this pattern, the horizontal boundary at 502.46 levels acts as a resistance.
A daily close above 517.5 levels would validate the breakout from the 3-month-long cup & handle chart pattern.
Based on this chart pattern, the potential price target is 595 levels.
SPDR S&P Retail ETF-(XRT/ARCA)-Long Idea
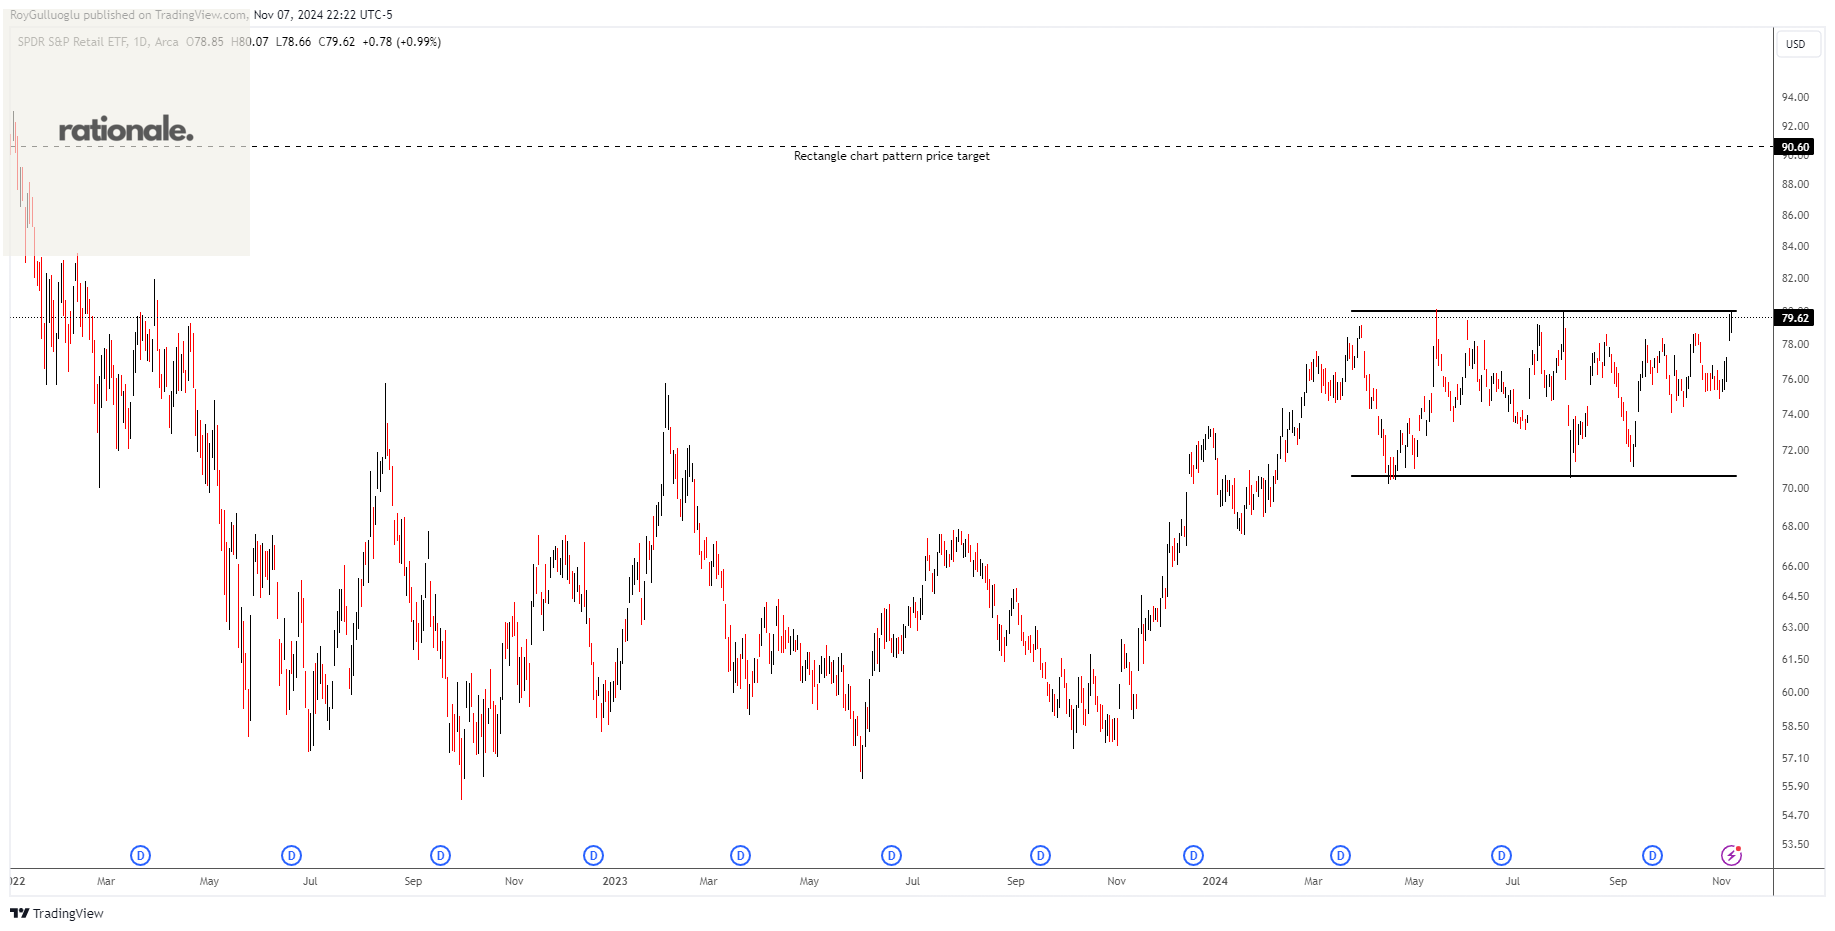
In seeking to track the performance of the S&P Retail Select Industry Index (the "index"), the fund employs a sampling strategy.
The above daily chart formed an approximately 5-month-long rectangle chart pattern as a bullish continuation after an uptrend.
Within this pattern, the horizontal boundary at 80 levels acts as a resistance.
A daily close above 82.4 levels would validate the breakout from the 5-month-long rectangle chart pattern.
Based on this chart pattern, the potential price target is 90.6 levels.
Hello Roy, maybe the last chart is XRT instead of ARKQ? Thanks. Ricky.