


Mr. Cooper Group Inc.-(COOP/NASDAQ)-Long Idea
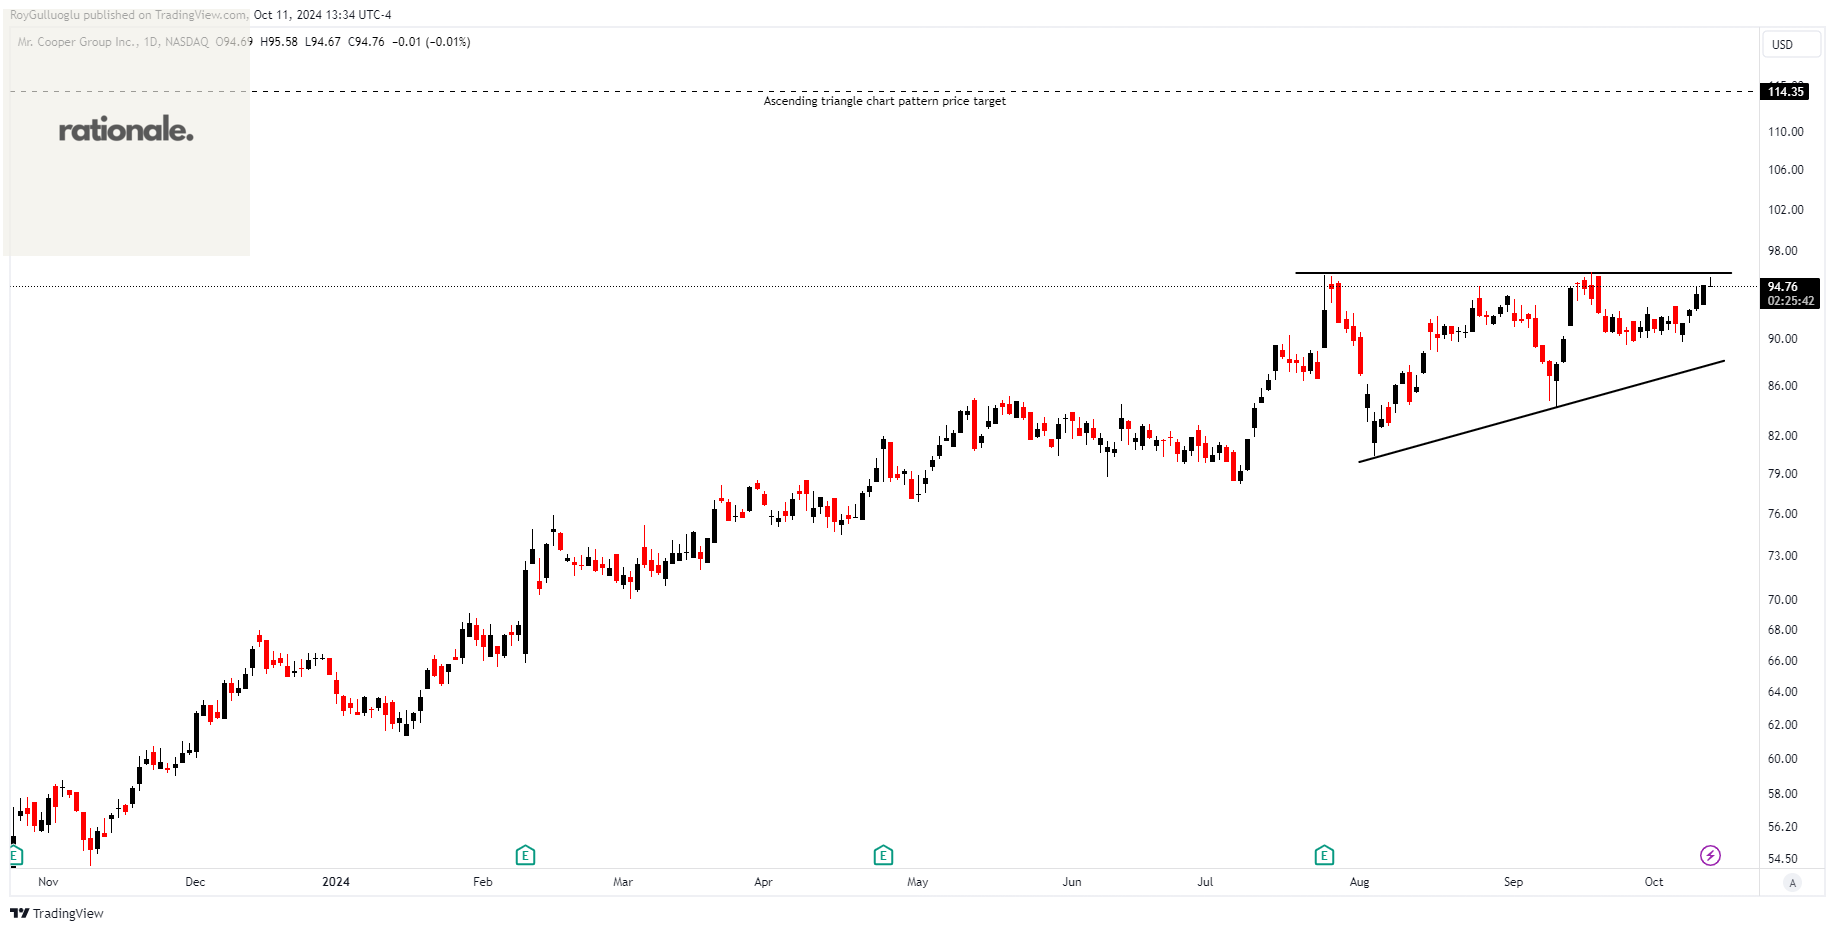
Mr. Cooper Group Inc., together with its subsidiaries, operates as a non-bank servicer of residential mortgage loans in the United States.
The above daily chart formed an approximately 2-month-long ascending triangle chart pattern as a bullish continuation after an uptrend.
The horizontal boundary at 95.88 levels acts as a resistance within this pattern.
A daily close above 98.75 levels would validate the breakout from the 2-month-long ascending triangle chart pattern.
Based on this chart pattern, the potential price target is 114.35 levels.
COOP, classified under the "financial services" sector, falls under the “Mid Cap - Income” stock category.
SPX Technologies, Inc.-(SPXC/NYSE)-Long Idea
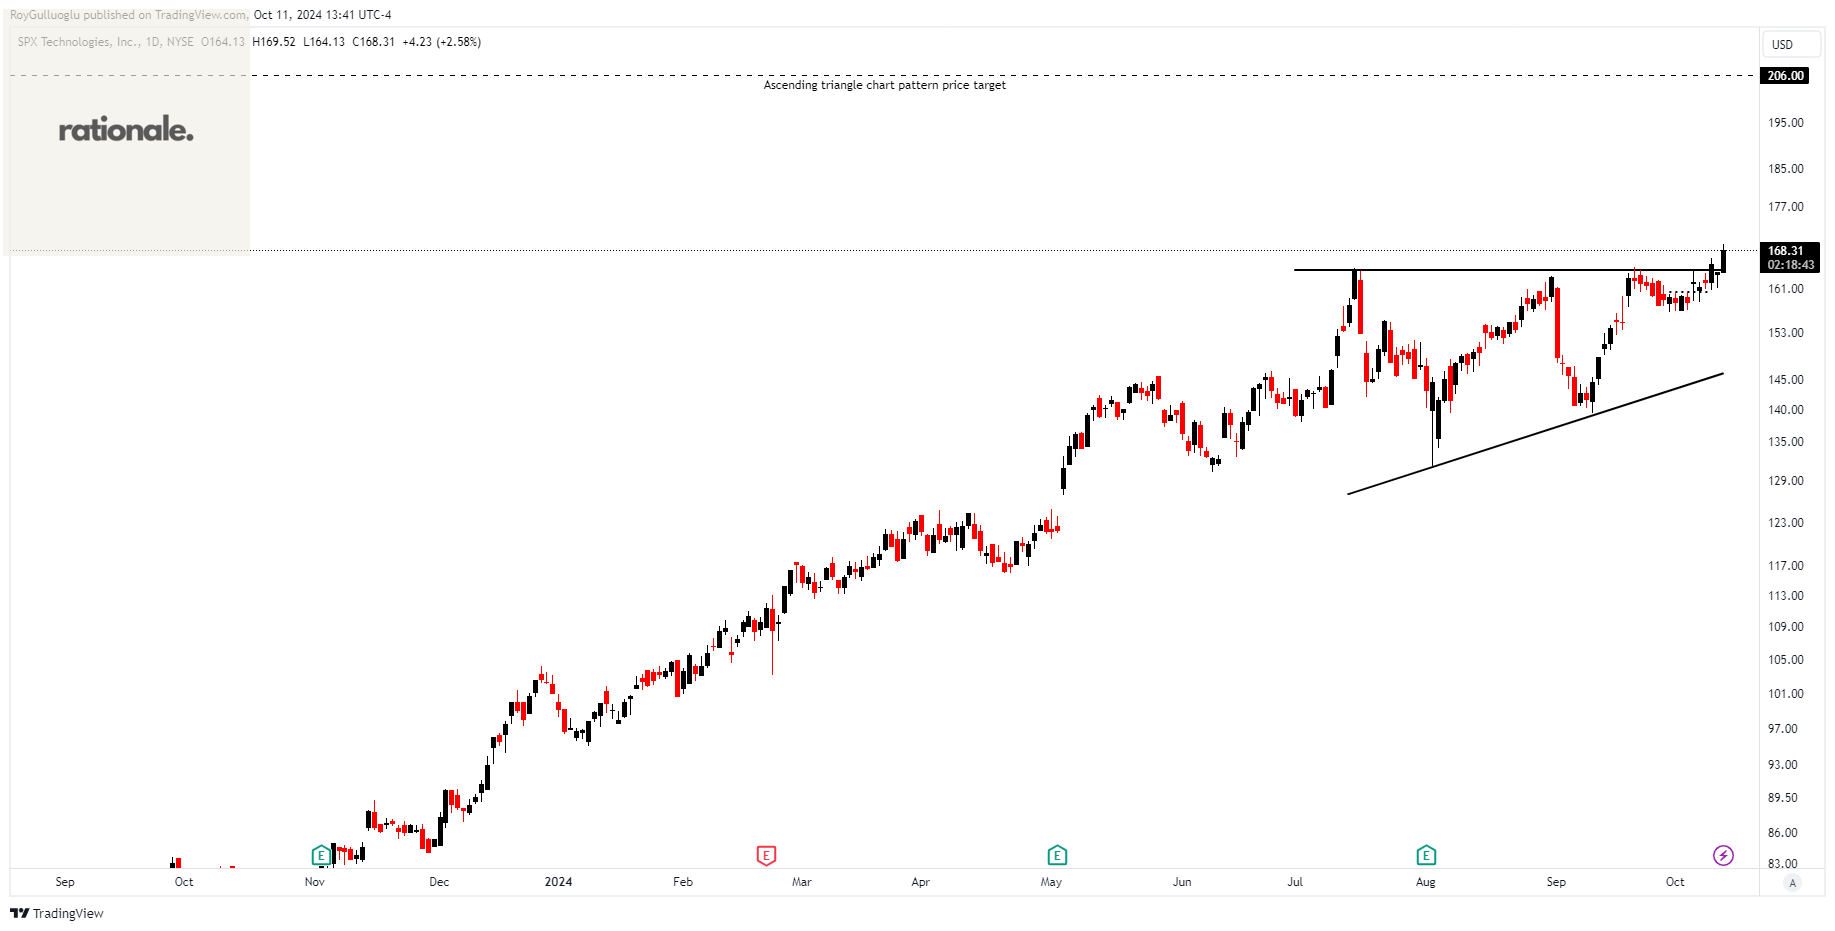
SPX Technologies, Inc. supplies infrastructure equipment serving the heating, ventilation, and cooling (HVAC); and detection and measurement markets worldwide.
The above daily chart formed an approximately 2-month-long ascending triangle chart pattern as a bullish continuation after an uptrend.
The horizontal boundary at 164.61 levels acts as a resistance within this pattern.
A daily close above 169.54 levels would validate the breakout from the 2-month-long ascending triangle chart pattern.
Based on this chart pattern, the potential price target is 206 levels.
SPXC, classified under the "industrials" sector, falls under the “Mid Cap - Value” stock category.
Energy Transfer LP-(ET/NYSE)-Long Idea
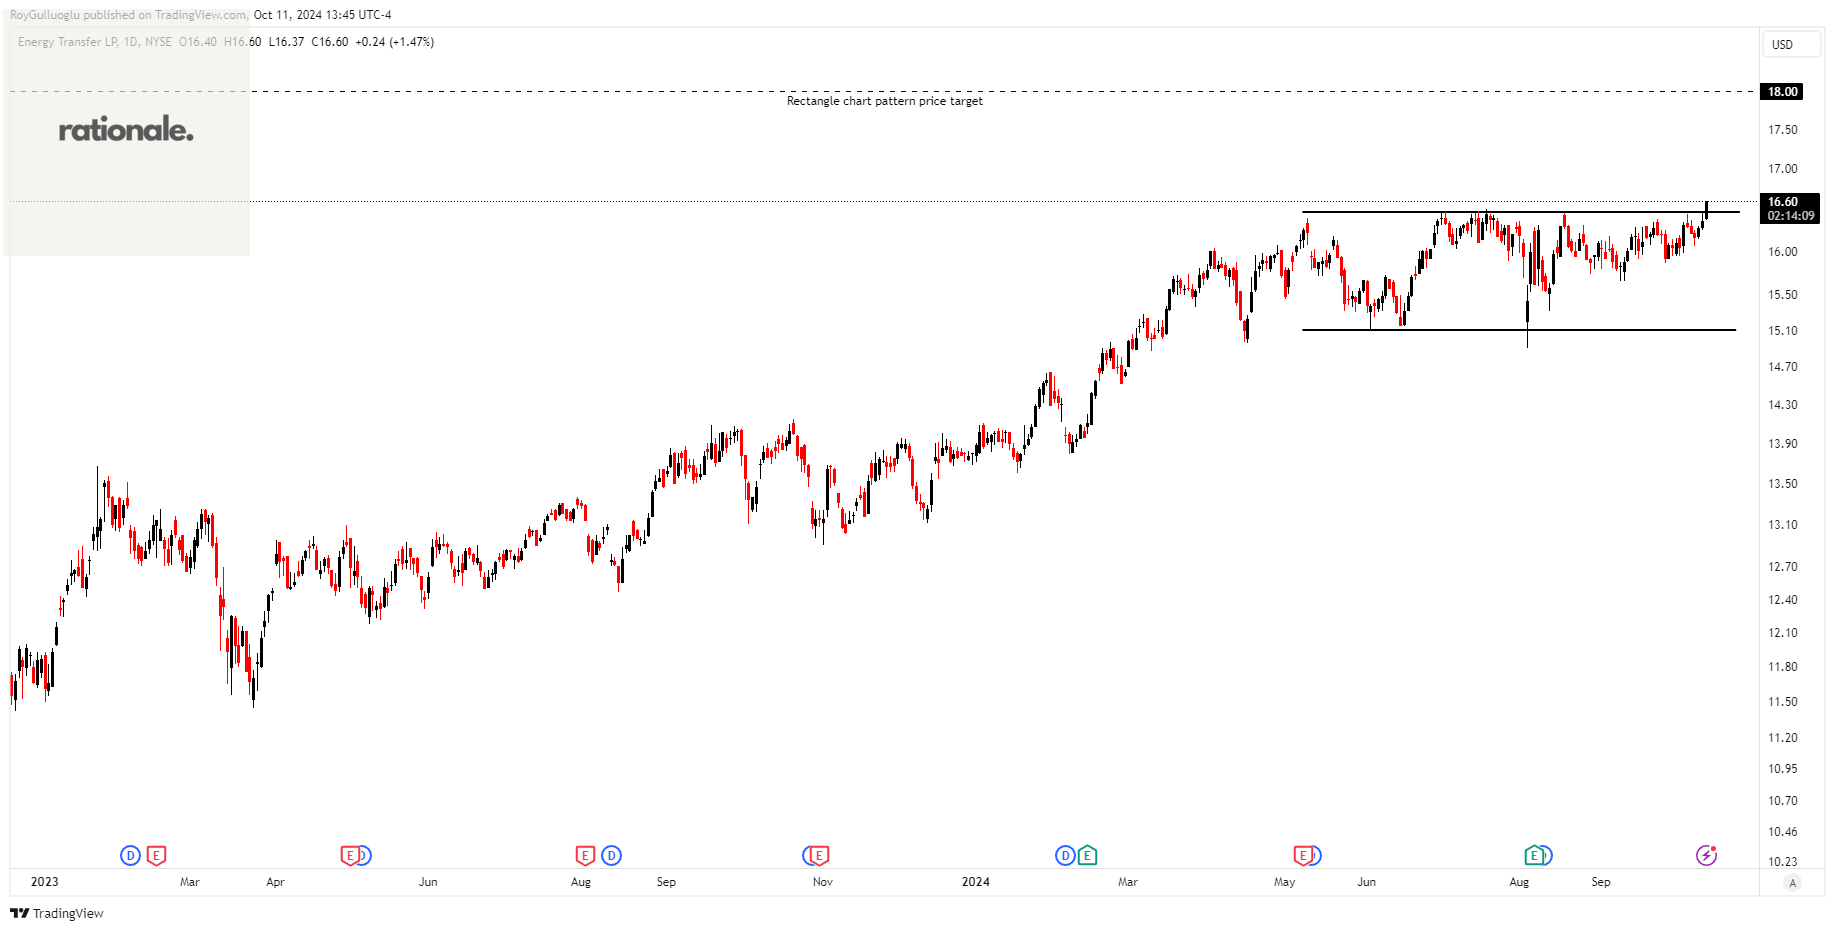
Energy Transfer LP provides energy-related services. The company owns and operates natural gas transportation pipeline, and natural gas storage facilities in Texas and Oklahoma; and approximately 20,090 miles of interstate natural gas pipeline.
The above daily chart formed an approximately 3-month-long rectangle chart pattern as a bullish continuation after an uptrend.
The horizontal boundary at 16.47 levels acts as a resistance within this pattern.
A daily close above 16.96 levels would validate the breakout from the 3-month-long rectangle chart pattern.
Based on this chart pattern, the potential price target is 18 levels.
ET, classified under the "energy" sector, falls under the “Large Cap - Income” stock category.
Carnival Corporation & plc-(CCL/LSE)-Long Idea

Carnival Corporation & plc engages in the provision of leisure travel services in North America, Australia, Europe, Asia, and internationally.
The above daily chart formed an approximately 7-month-long rectangle chart pattern as a bullish continuation after an uptrend.
The horizontal boundary at 1391 levels acted as a resistance within this pattern.
A daily close above 1432.73 levels validated the breakout from the 7-month-long rectangle chart pattern.
Based on this chart pattern, the potential price target is 1947 levels.
CCL, classified under the "consumer cyclical" sector, falls under the “Large Cap - Growth” stock category
Morinaga&Co., Ltd.-(2201/TSE)-Long Idea
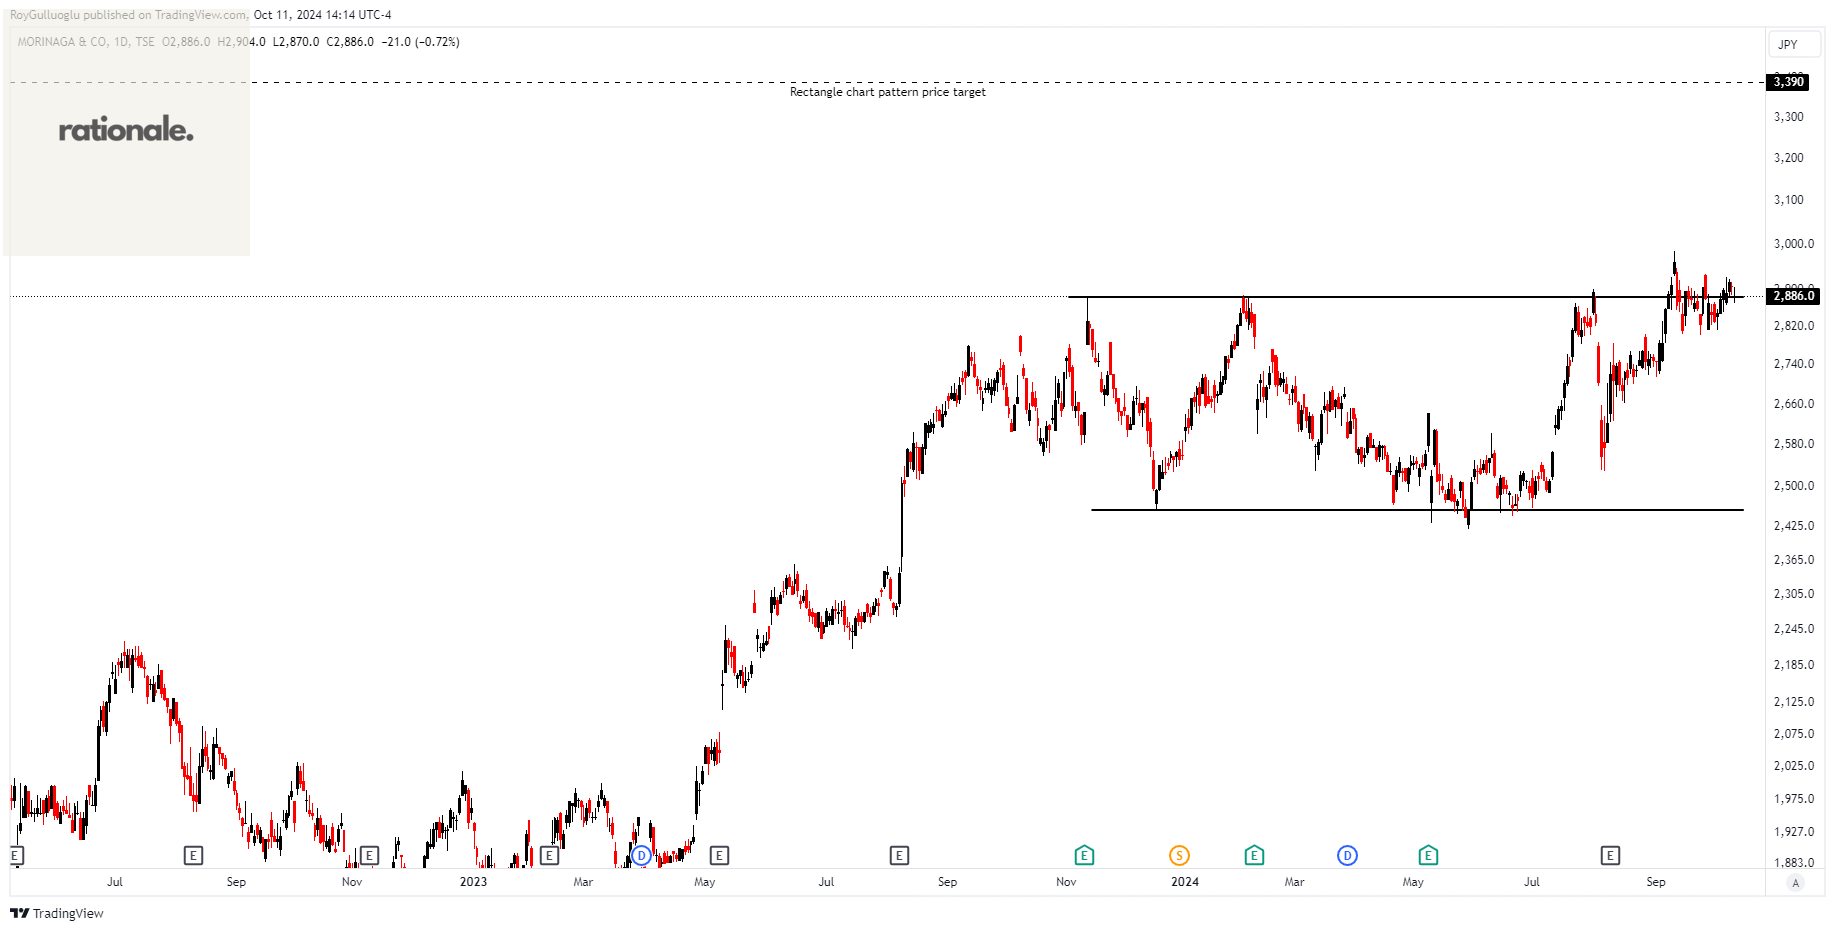
Morinaga & Co., Ltd. manufactures, purchases, and sells confectionaries, food stuffs, frozen desserts, and health products in Japan and internationally.
The above daily chart formed an approximately 7-month-long rectangle chart pattern as a bullish continuation after an uptrend.
The horizontal boundary at 2883.5 levels acts as a resistance within this pattern.
A daily close above 2970 levels would validate the breakout from the 7-month-long rectangle chart pattern.
Based on this chart pattern, the potential price target is 3390 levels.
2201, classified under the "consumer defensive" sector, falls under the “Small Cap - Value” stock category.
Teşekkürler Roy