

Trade Ideas Equities
PANW(NASDAQ), PACB(NYSE), RNA(NASDAQ), DSGX(NASDAQ), LHX(NYSE), SYRE(NASDAQ), HEN(XETR), FME(XETR), LXS(XETR)

Palo Alto Networks, Inc.-(PANW/NASDAQ)-Long Idea
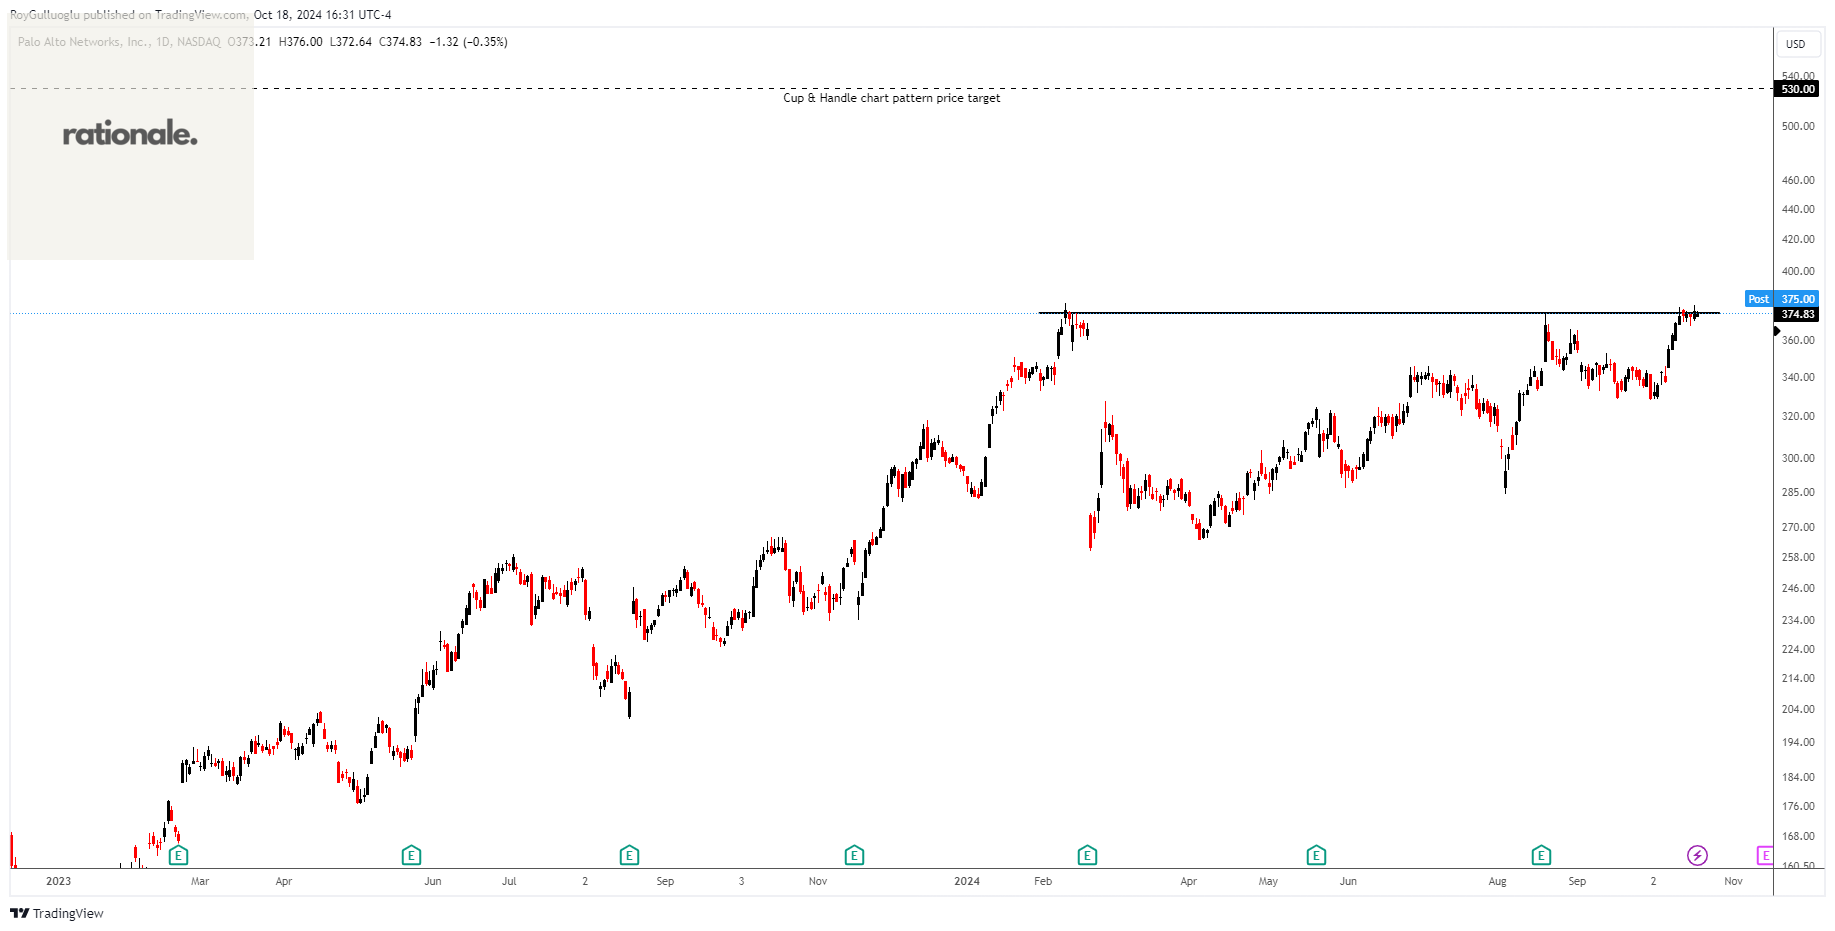
Palo Alto Networks, Inc. provides cybersecurity solutions worldwide. The company's network security platforms include Prisma Access, a security services edge (SSE) solution, as well as Strata Cloud Manager, a network security management solution.
The above daily chart formed an approximately 6-month-long cup & handle chart pattern as a bullish continuation after an uptrend.
The horizontal boundary at 375 levels acts as a resistance within this pattern.
A daily close above 386.25 levels would validate the breakout from the 6-month-long cup & handle chart pattern.
Based on this chart pattern, the potential price target is 530 levels.
PANW, classified under the "technology" sector, falls under the “Large Cap - Growth” stock category.
Pacific Biosciences of California, Inc.-(PACB/NYSE)-Long Idea
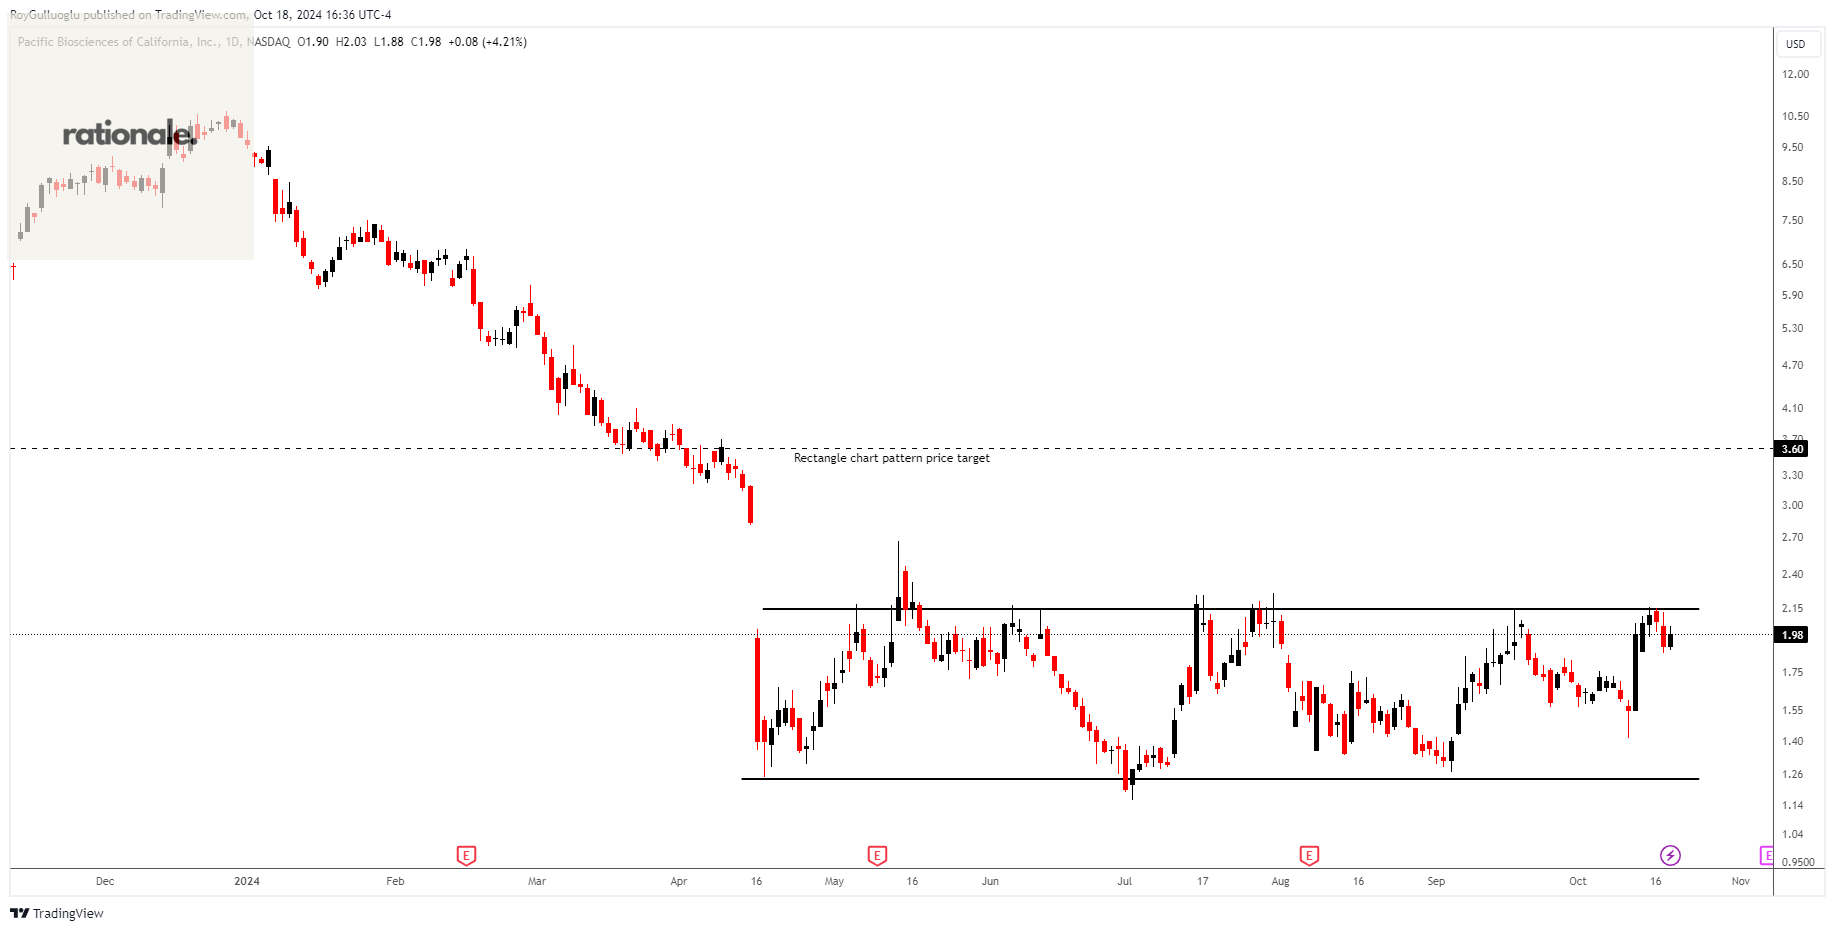
Pacific Biosciences of California, Inc. designs, develops, and manufactures sequencing solution to resolve genetically complex problems.
The above daily chart formed an approximately 4-month-long rectangle chart pattern as a bullish reversal after a downtrend.
The horizontal boundary at 2.14 levels acts as a resistance within this pattern.
A daily close above 2.20 levels would validate the breakout from the 4-month-long rectangle chart pattern.
Based on this chart pattern, the potential price target is 3.6 levels.
PACB, classified under the "healthcare" sector, falls under the “Small Cap - Value” stock category.
Avidity Biosciences, Inc.-(RNA/NASDAQ)-Long Idea
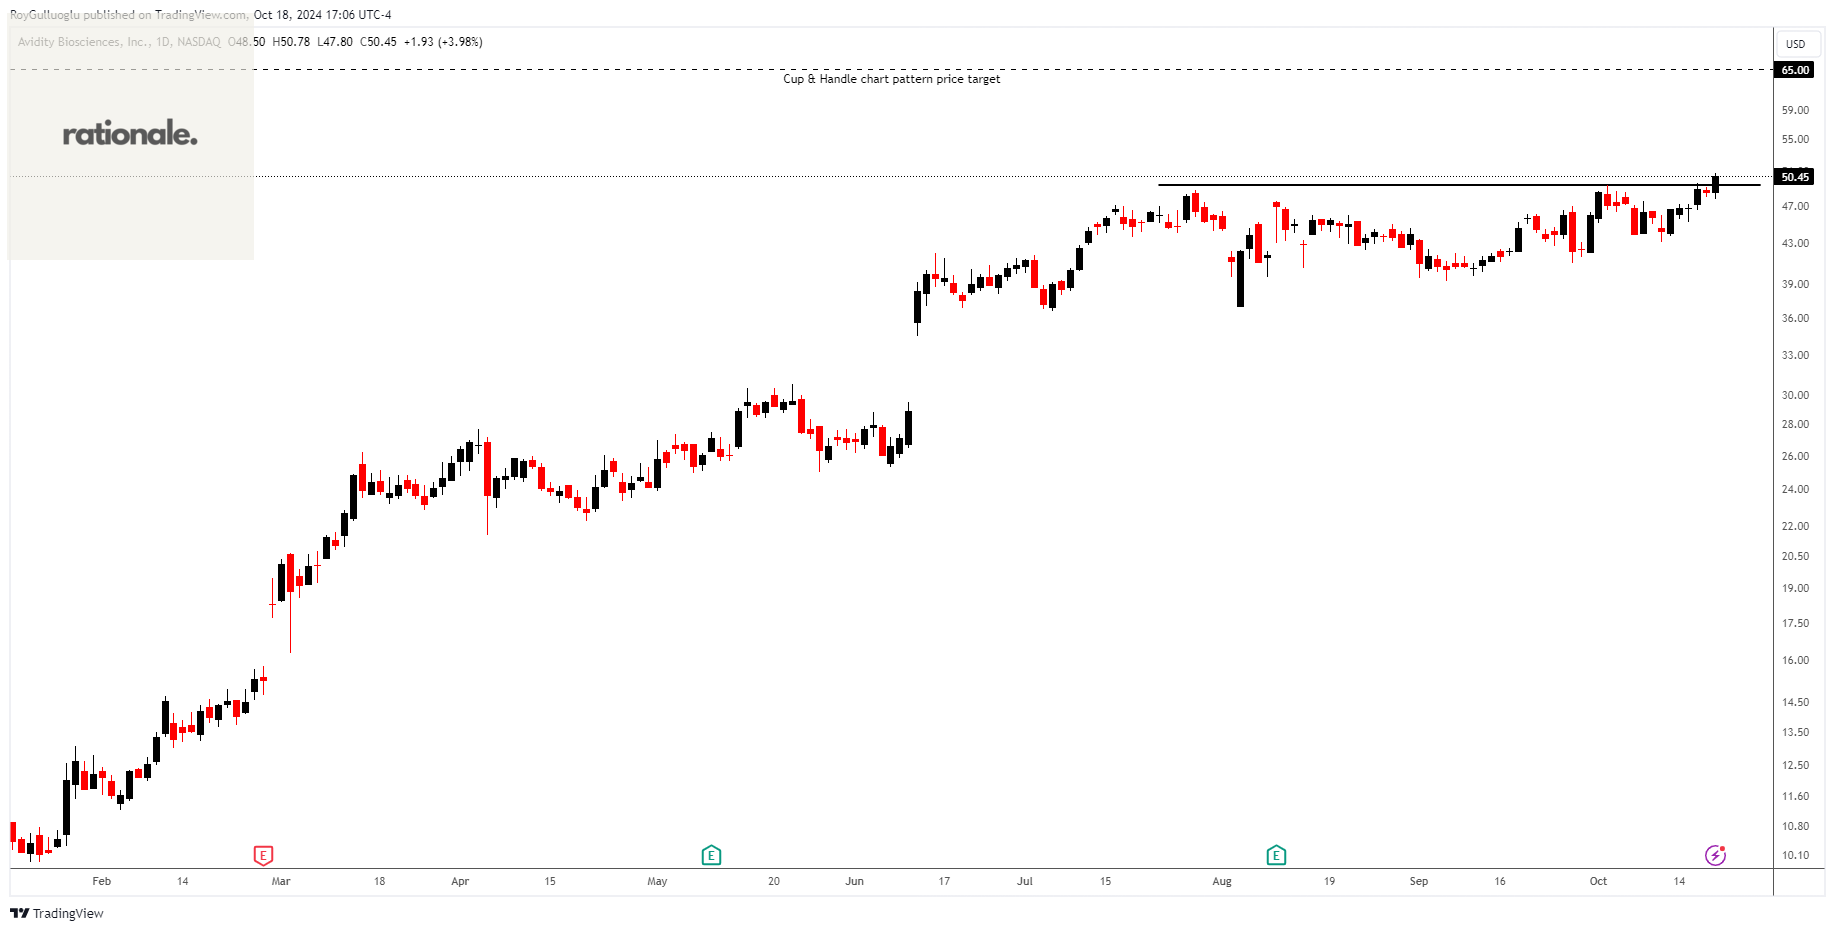
Avidity Biosciences, Inc., a biopharmaceutical company, engages in the delivery of RNA therapeutics. It develops antibody oligonucleotide conjugates (AOC) that are designed to treat diseases previously untreatable with RNA therapeutics.
The above daily chart formed an approximately 2-month-long cup & handle chart pattern as a bullish continuation after an uptrend.
The horizontal boundary at 49.38 levels acts as a resistance within this pattern.
A daily close above 50.86 levels would validate the breakout from the 6-month-long cup & handle chart pattern.
Based on this chart pattern, the potential price target is 65 levels.
RNA, classified under the "healthcare" sector, falls under the “Mid Cap - Value” stock category.
The Descartes Systems Group Inc.-(DSGX/NASDAQ)-Long Idea
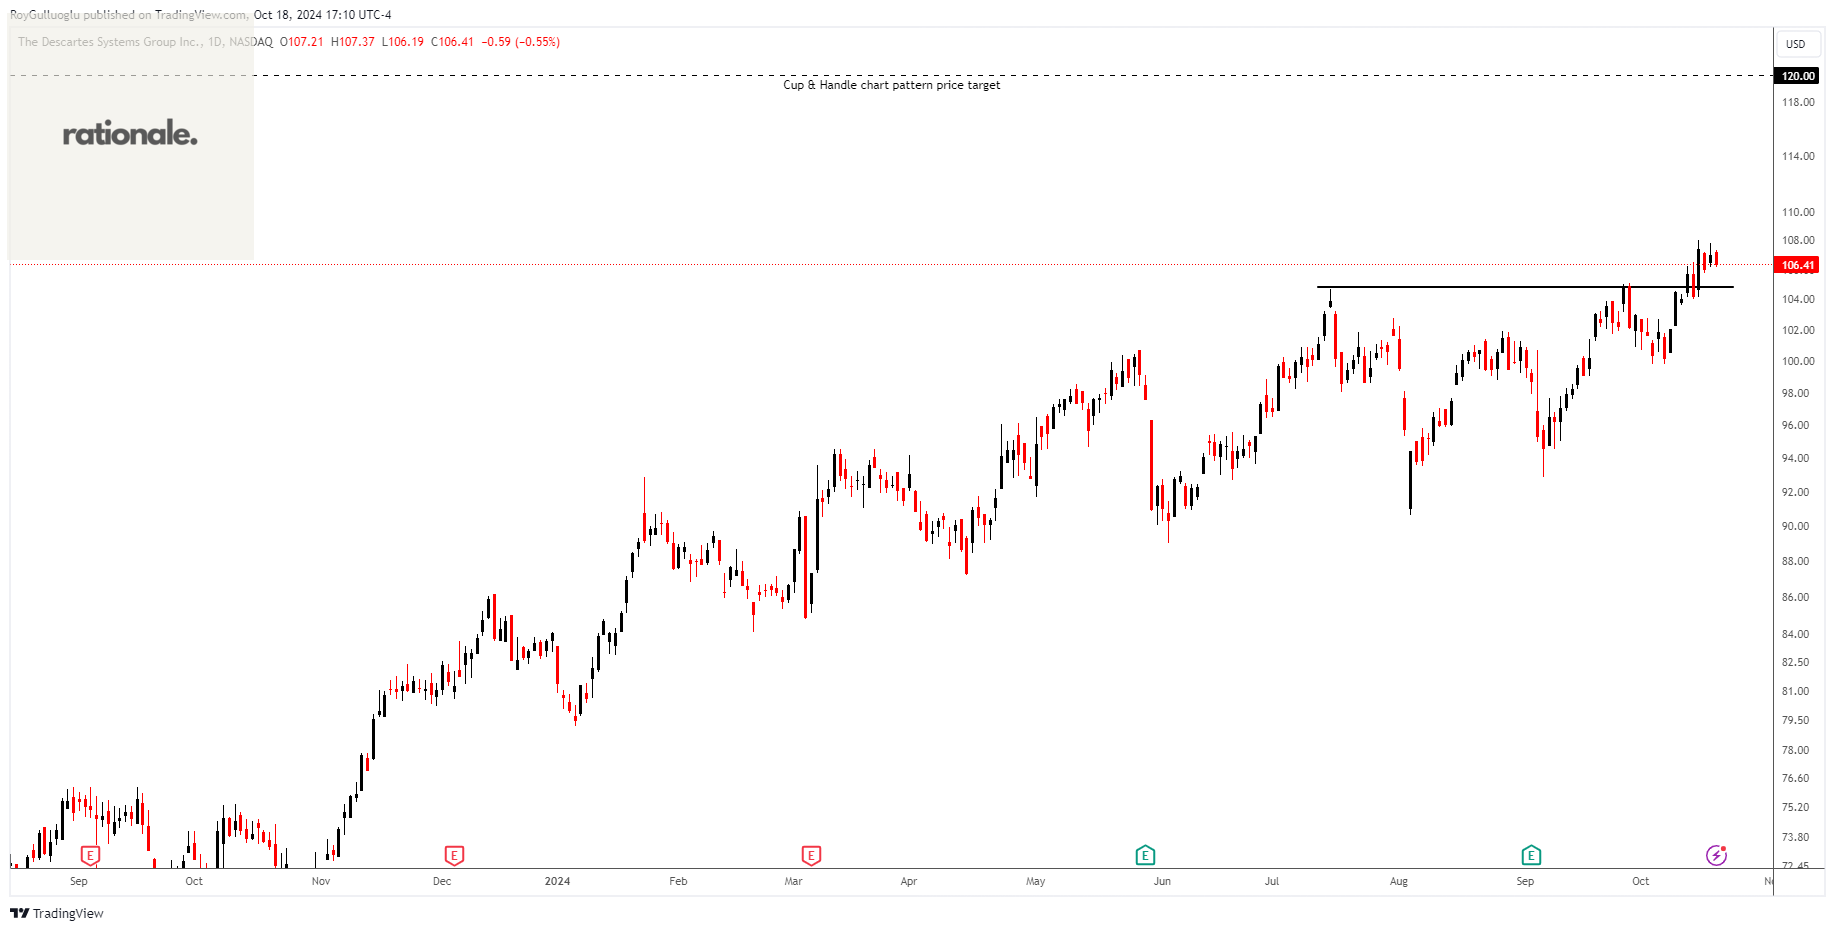
The Descartes Systems Group Inc. provides cloud-based logistics and supply chain management solutions worldwide. Its Logistics Technology platform offers a range of modular, interoperable web and wireless logistics management solutions.
The above daily chart formed an approximately 2-month-long cup & handle chart pattern as a bullish continuation after an uptrend.
The horizontal boundary at 104.85 levels acts as a resistance within this pattern.
A daily close above 108 levels would validate the breakout from the 2-month-long cup & handle chart pattern.
Based on this chart pattern, the potential price target is 120 levels.
DSGX, classified under the "technology" sector, falls under the “Mid Cap - Growth” stock category.
L3Harris Technologies, Inc.-(LHX/NYSE)-Long Idea
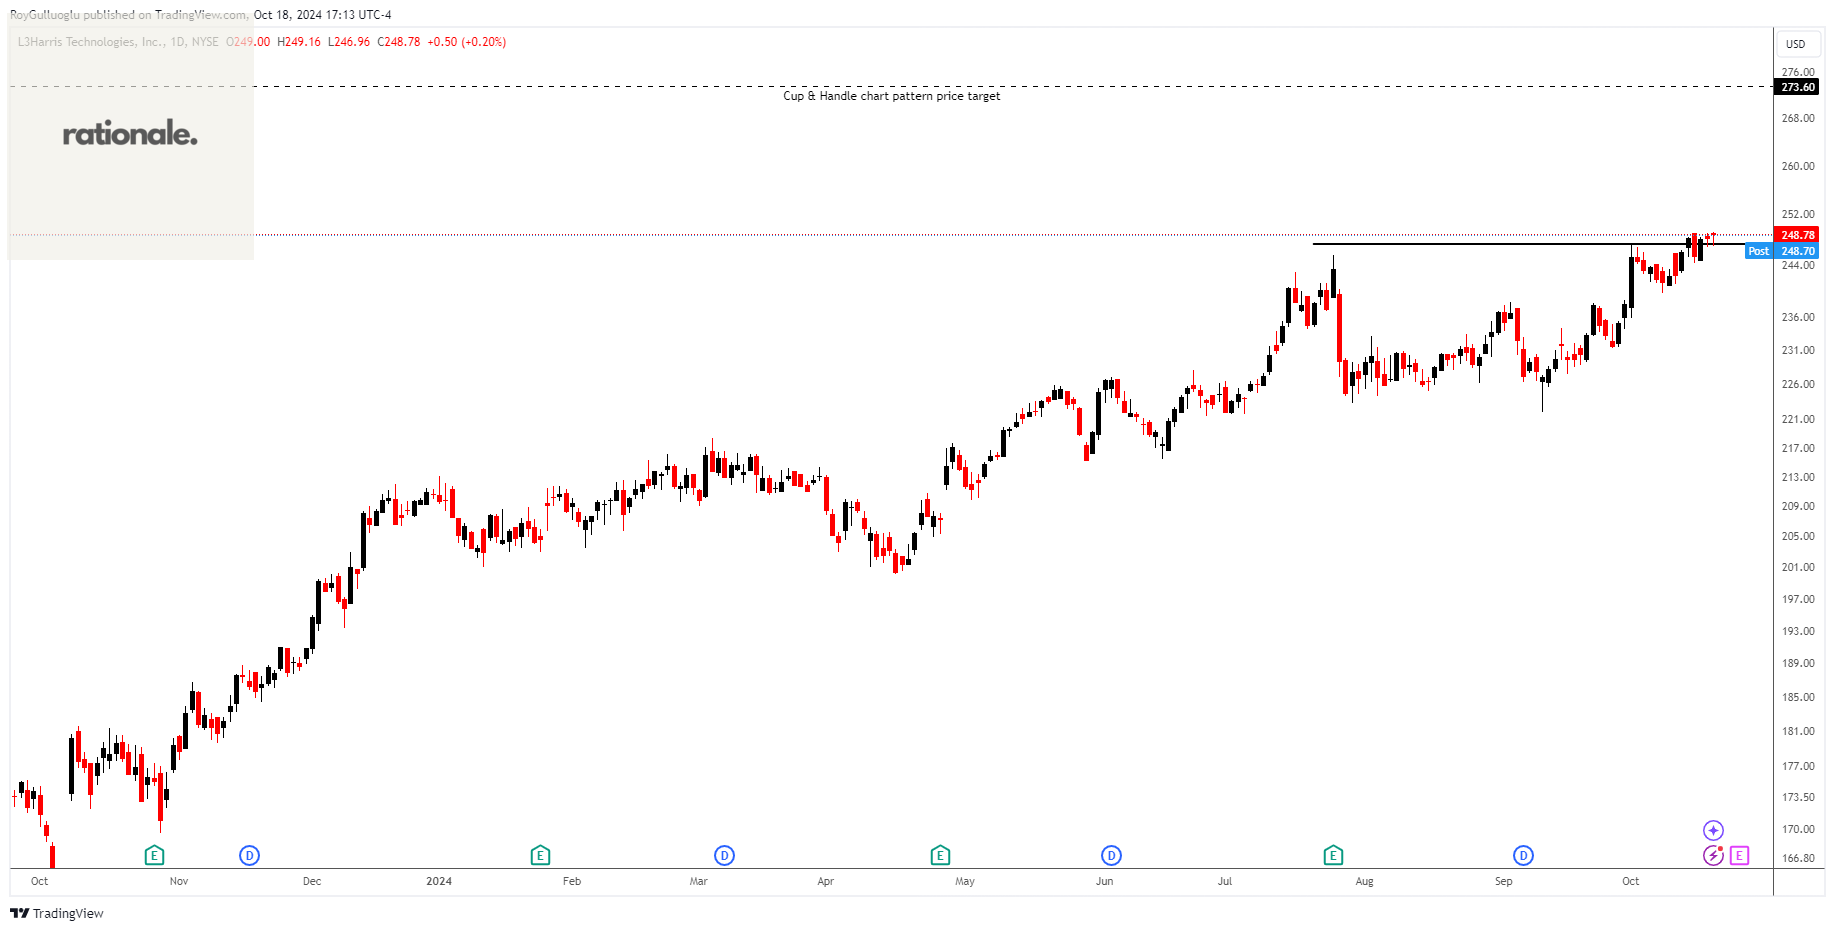
L3Harris Technologies, Inc. provides mission-critical solutions for government and commercial customers worldwide.
The above daily chart formed an approximately 2-month-long cup & handle chart pattern as a bullish continuation after an uptrend.
The horizontal boundary at 247.3 levels acts as a resistance within this pattern.
A daily close above 254.7 levels would validate the breakout from the 2-month-long cup & handle chart pattern.
Based on this chart pattern, the potential price target is 273.6 levels.
LHX, classified under the "industrials" sector, falls under the “Large Cap - Value” stock category.
Spyre Therapeutics, Inc.-(SYRE/NASDAQ)-Long Idea
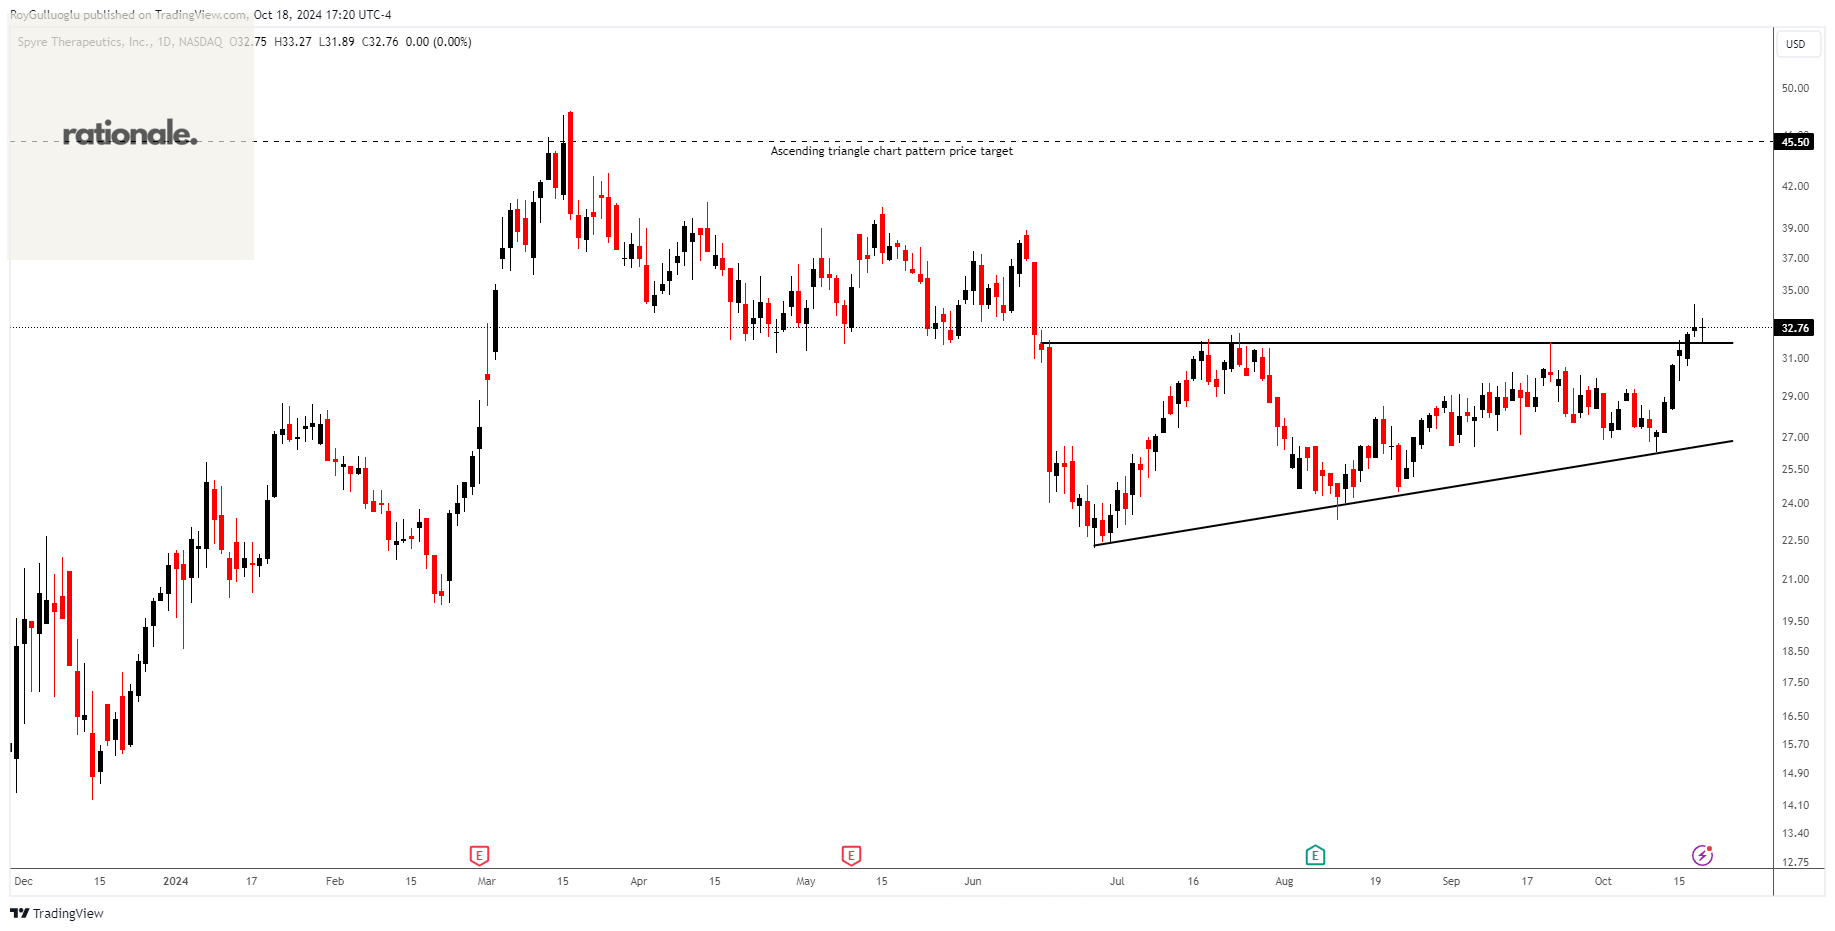
Spyre Therapeutics, Inc., a preclinical stage biotechnology company, focuses on developing therapeutics for patients living with inflammatory bowel disease (IBD).
The above daily chart formed an approximately 3-month-long ascending triangle chart pattern as a bullish reversal after a downtrend.
The horizontal boundary at 31.84 levels acts as a resistance within this pattern.
A daily close above 32.8 levels would validate the breakout from the 3-month-long ascending triangle chart pattern.
Based on this chart pattern, the potential price target is 45.5 levels.
SYRE, classified under the "healthcare" sector, falls under the “Small Cap - Value” stock category.
Henkel AG & Co. KGaA-(HEN/XETR)-Long Idea
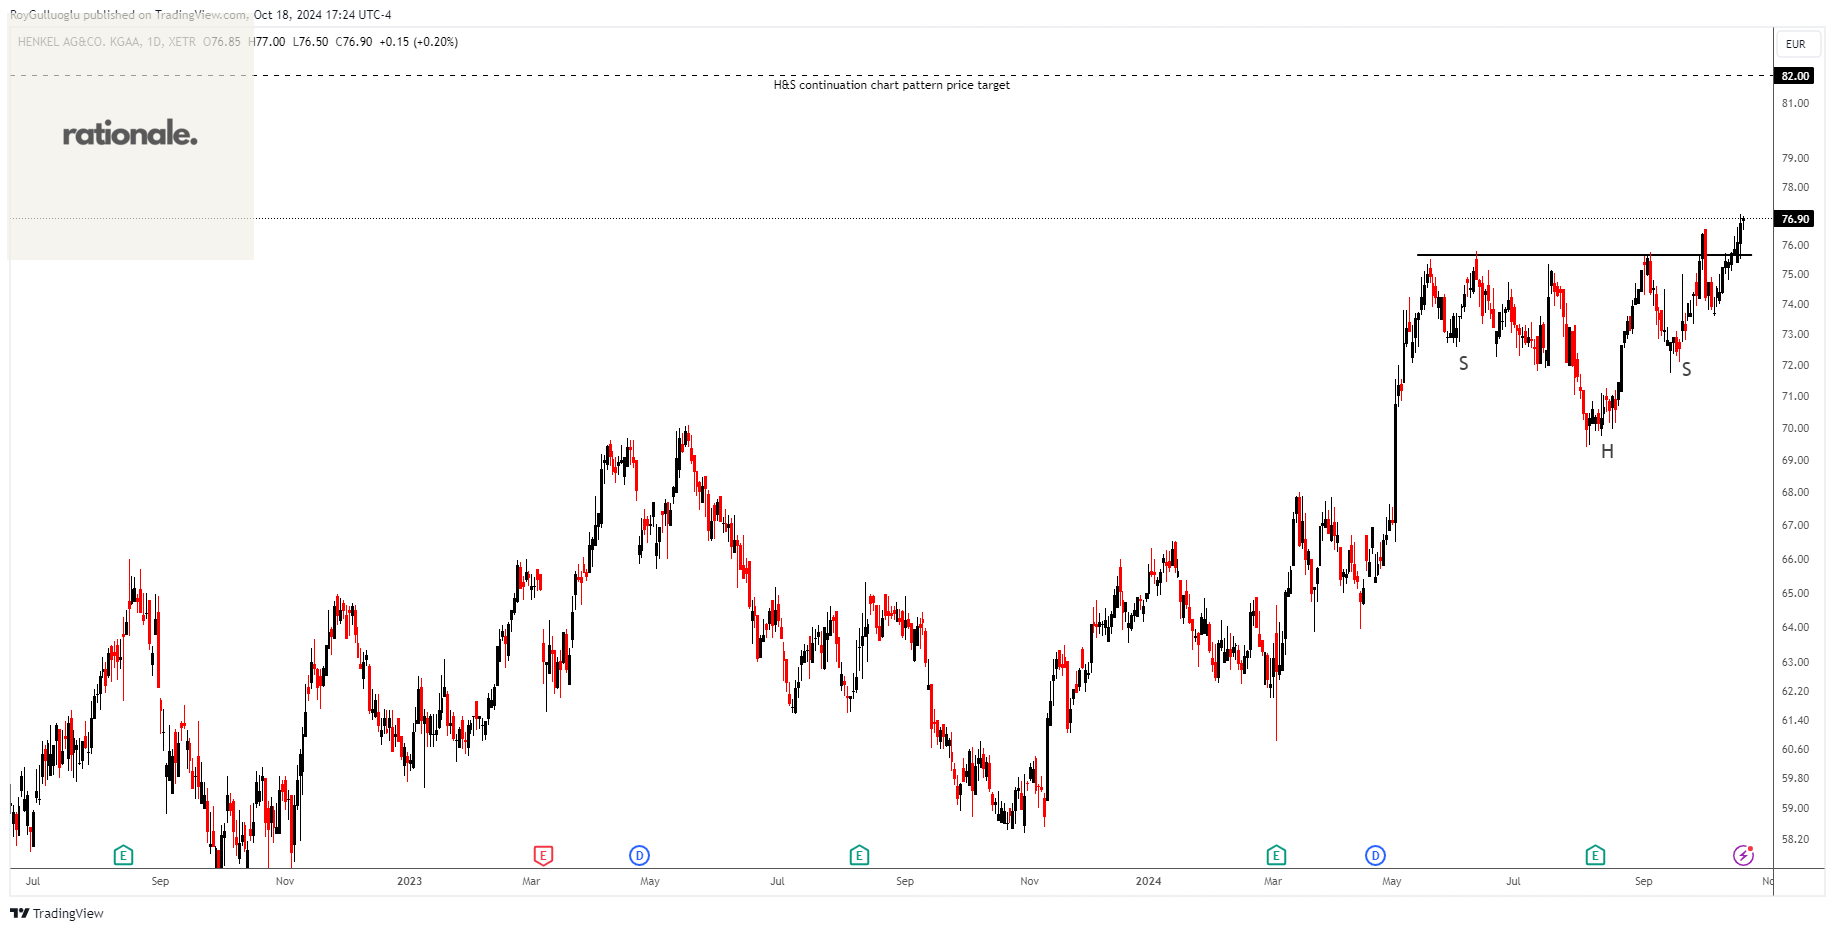
Henkel AG & Co. KGaA, together with its subsidiaries, engages in the adhesive technologies and beauty care, and laundry and home care businesses worldwide.
The above daily chart formed an approximately 3-month-long H&S continuation chart pattern as a bullish continuation after an uptrend.
The horizontal boundary at 75.65 levels acts as a resistance within this pattern.
A daily close above 77.9 levels would validate the breakout from the 3-month-long H&S continuation chart pattern.
Based on this chart pattern, the potential price target is 82 levels.
HEN, classified under the "consumer defensive" sector, falls under the “Large Cap - Value” stock category.
Fresenius Medical Care AG & Co. KGaA-(FME/XETR)-Long Idea
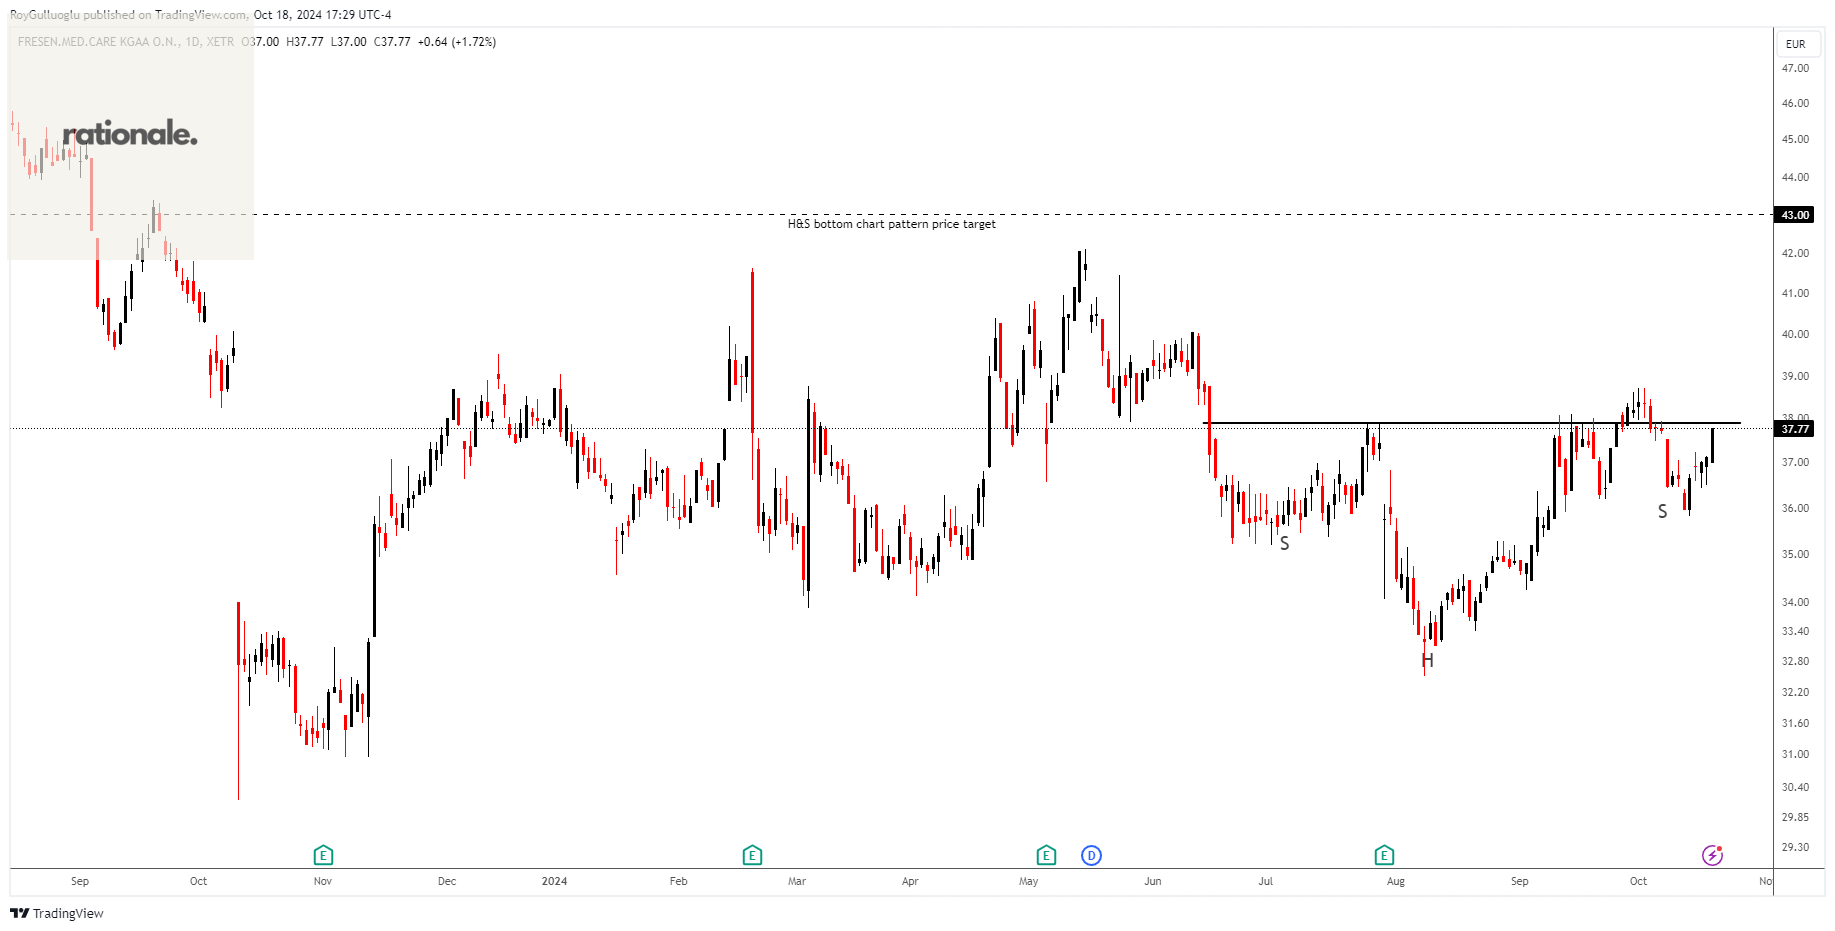
Fresenius Medical Care AG & Co. KGaA is a global healthcare company specializing in providing products and services for individuals with chronic kidney failure. Their primary focus is on dialysis care, which involves filtering and purifying blood when kidneys are no longer able to function properly.
The above daily chart formed an approximately 3-month-long H&S bottom chart pattern as a bullish reversal after a downtrend.
The horizontal boundary at 37.9 levels acts as a resistance within this pattern.
A daily close above 39 levels would validate the breakout from the 3-month-long H&S bottom chart pattern.
Based on this chart pattern, the potential price target is 43 levels.
FME, classified under the "healthcare" sector, falls under the “Large Cap - Value” stock category.
LANXESS Aktiengesellschaft -(LXS/XETR)-Long Idea
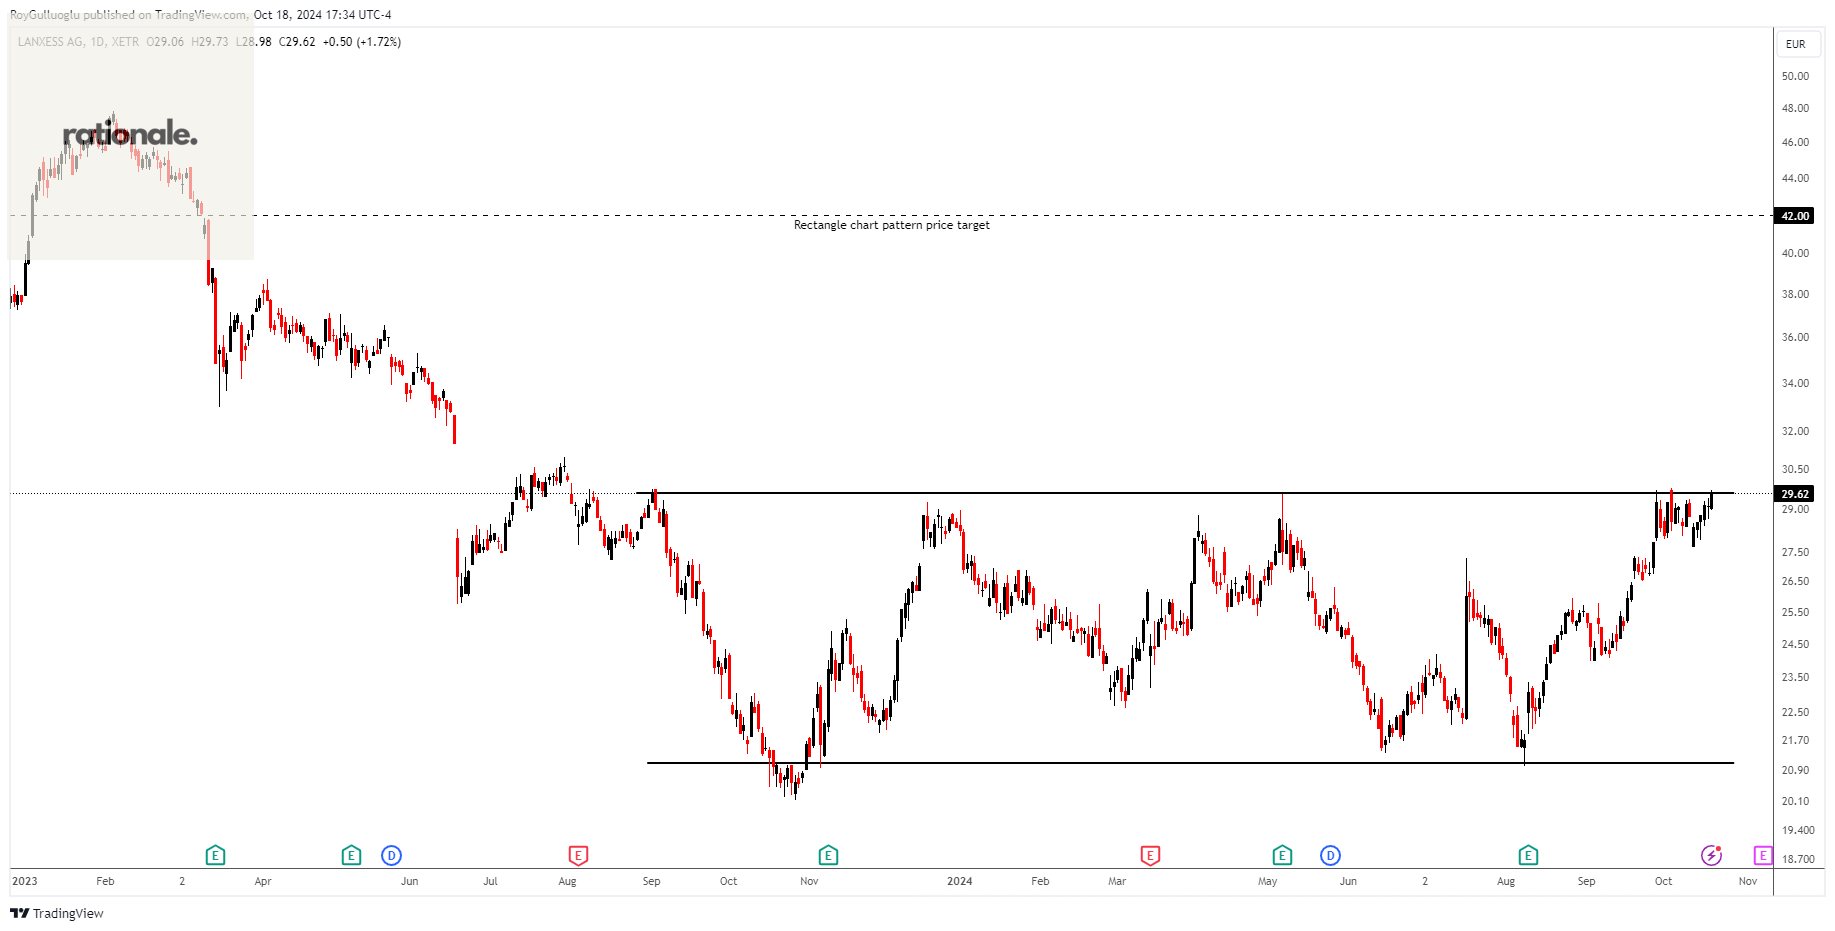
LANXESS Aktiengesellschaft, together with its subsidiaries, operates as a specialty chemicals company that engages in the development, manufacture, and marketing of chemical intermediates, additives, specialty chemicals, and consumer protection products worldwide.
The above daily chart formed an approximately 9-month-long rectangle chart pattern as a bullish reversal after a downtrend.
The horizontal boundary at 29.6levels acts as a resistance within this pattern.
A daily close above 30.48 levels would validate the breakout from the 9-month-long rectangle chart pattern.
Based on this chart pattern, the potential price target is 42 levels.
LXS, classified under the "basic materials" sector, falls under the “Mid Cap - Value” stock category.