


Waste Connections, Inc.-(WCN/NYSE)-Short Idea
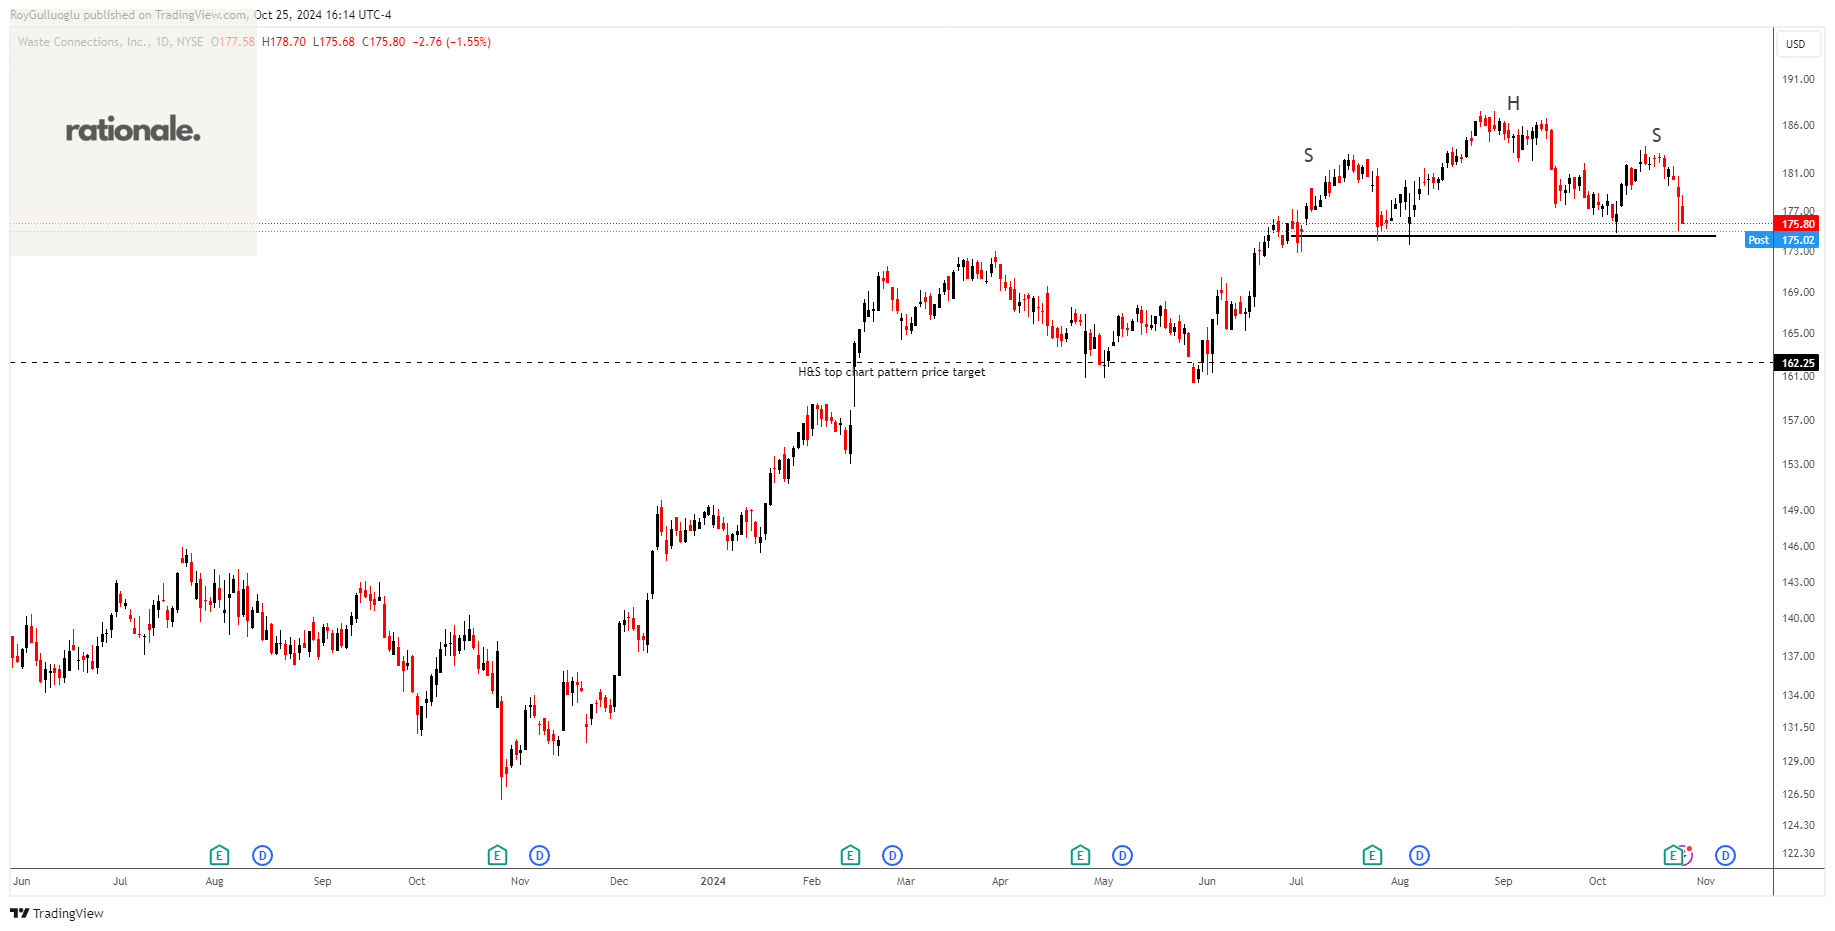
Waste Connections, Inc. provides non-hazardous waste collection, transfer, disposal, and resource recovery services in the United States and Canada.
The above daily chart formed an approximately 3-month-long H&S top chart pattern as a bearish reversal after an uptrend.
The horizontal boundary at 175 levels acts as a resistance within this pattern.
A daily close below 170 levels would validate the breakout from the 3-month-long H&S top chart pattern.
Based on this chart pattern, the potential price target is 162.25 levels.
WCN, classified under the "industrials" sector, falls under the “Large Cap - Value” stock category.
Itron, Inc.-(ITRI/NASDAQ)-Long Idea
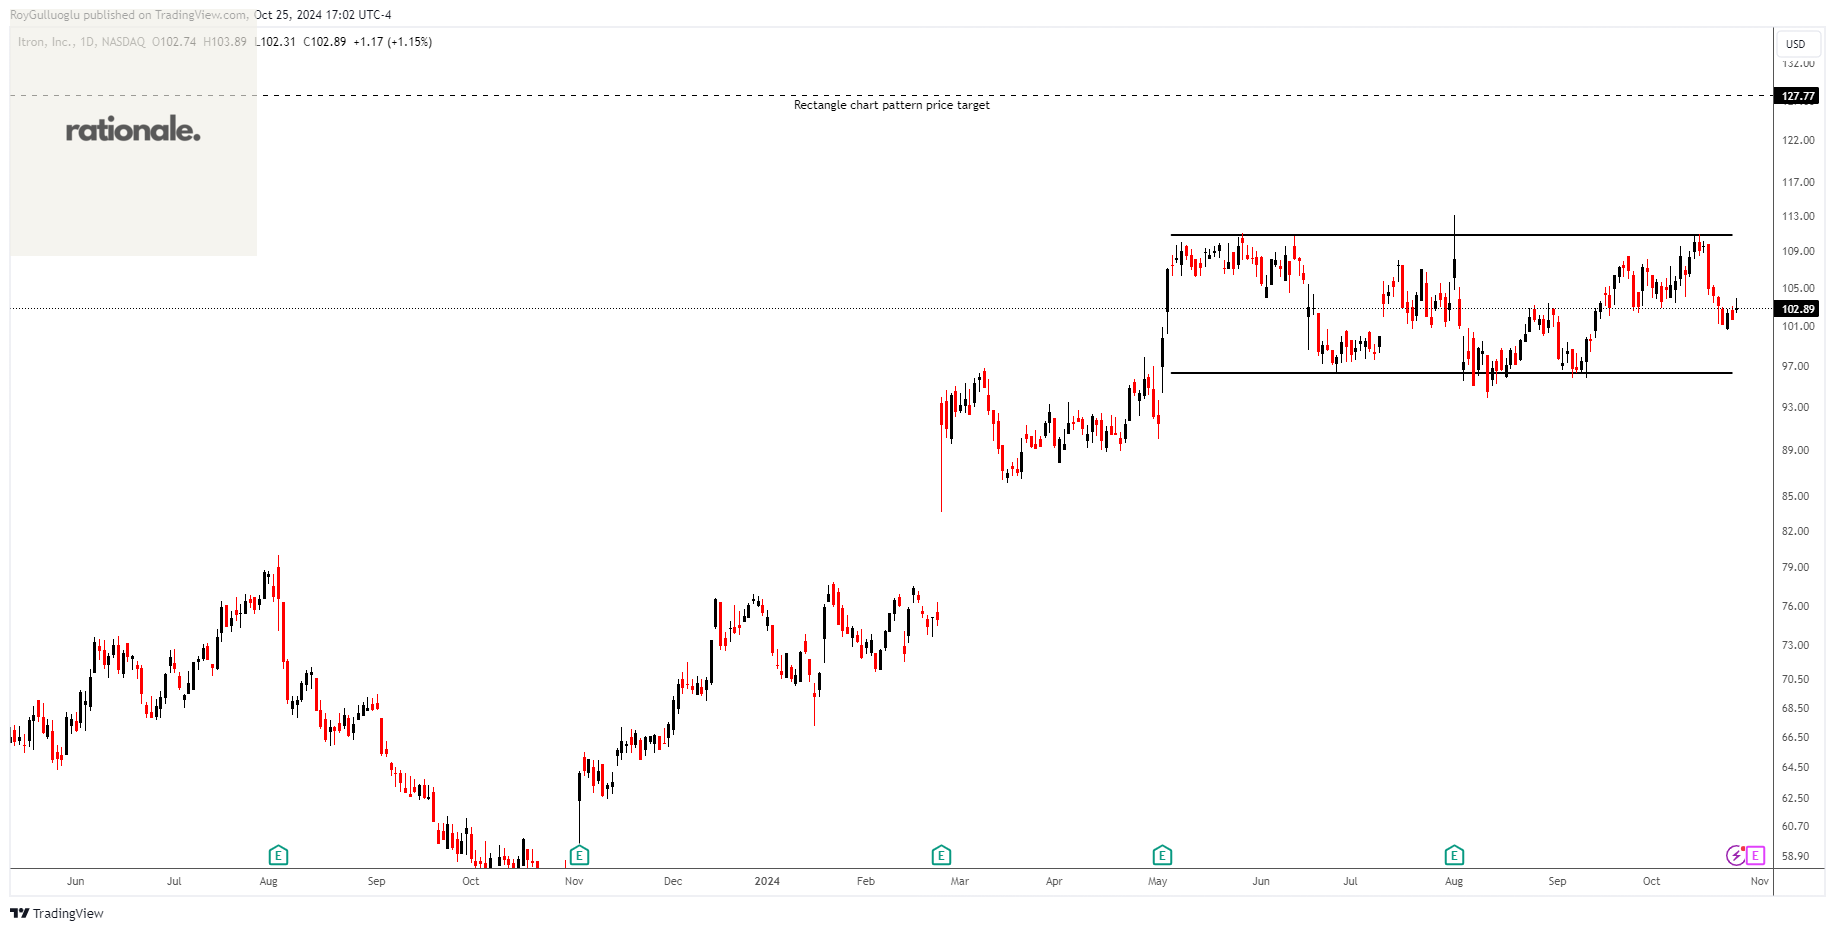
Itron, Inc., a technology, solutions, and service company, provides end-to-end solutions that help manage energy, water, and smart city operations worldwide.
The above daily chart formed an approximately 4-month-long rectangle chart pattern as a bullish continuation after an uptrend.
The horizontal boundary at 110.8 levels acts as a resistance within this pattern.
A daily close above 114.12 levels would validate the breakout from the 4-month-long rectangle chart pattern.
Based on this chart pattern, the potential price target is 127.77 levels.
ITRI, classified under the "technology" sector, falls under the “Mid Cap - Growth” stock category.
Zscaler, Inc.-(ZS/NASDAQ)-Long Idea
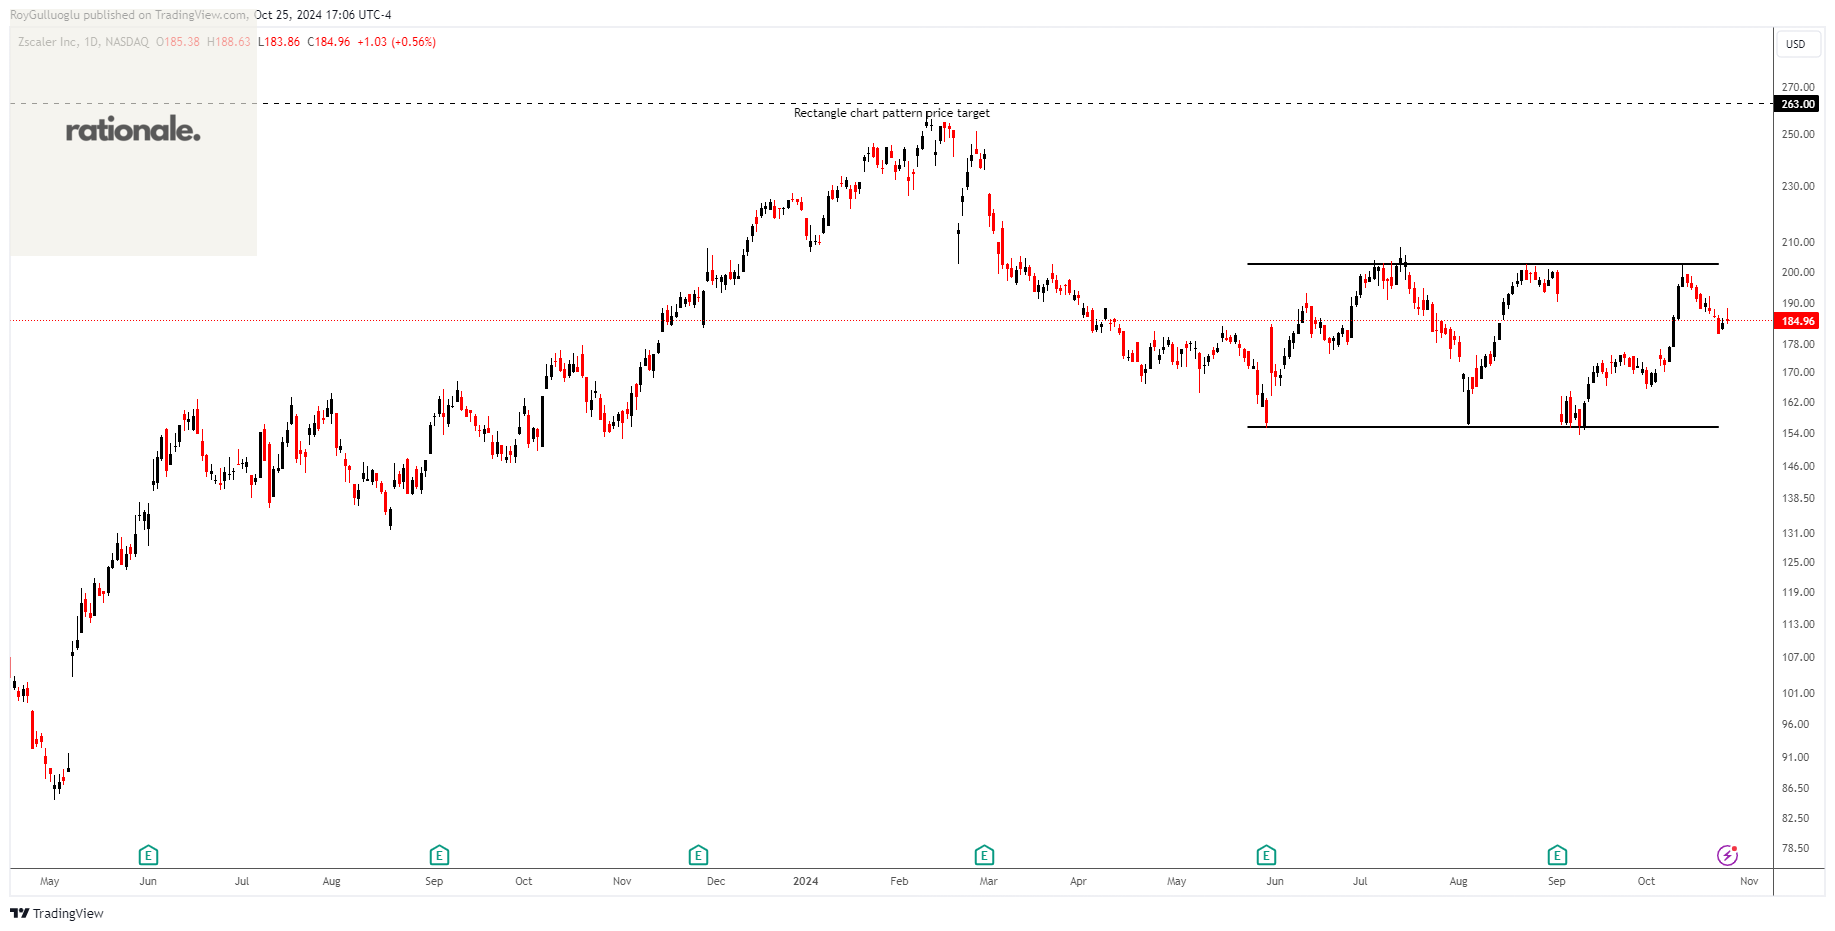
Zscaler, Inc. operates as a cloud security company worldwide.
The above daily chart formed an approximately 3-month-long rectangle chart pattern as a bullish reversal after a downtrend.
The horizontal boundary at 202.58 levels acts as a resistance within this pattern.
A daily close above 208.65 levels would validate the breakout from the 3-month-long rectangle chart pattern.
Based on this chart pattern, the potential price target is 263 levels.
ZS, classified under the "technology" sector, falls under the “Large Cap - Growth” stock category.
XOMA Royalty Corporation-(XOMA/NASDAQ)-Long Idea
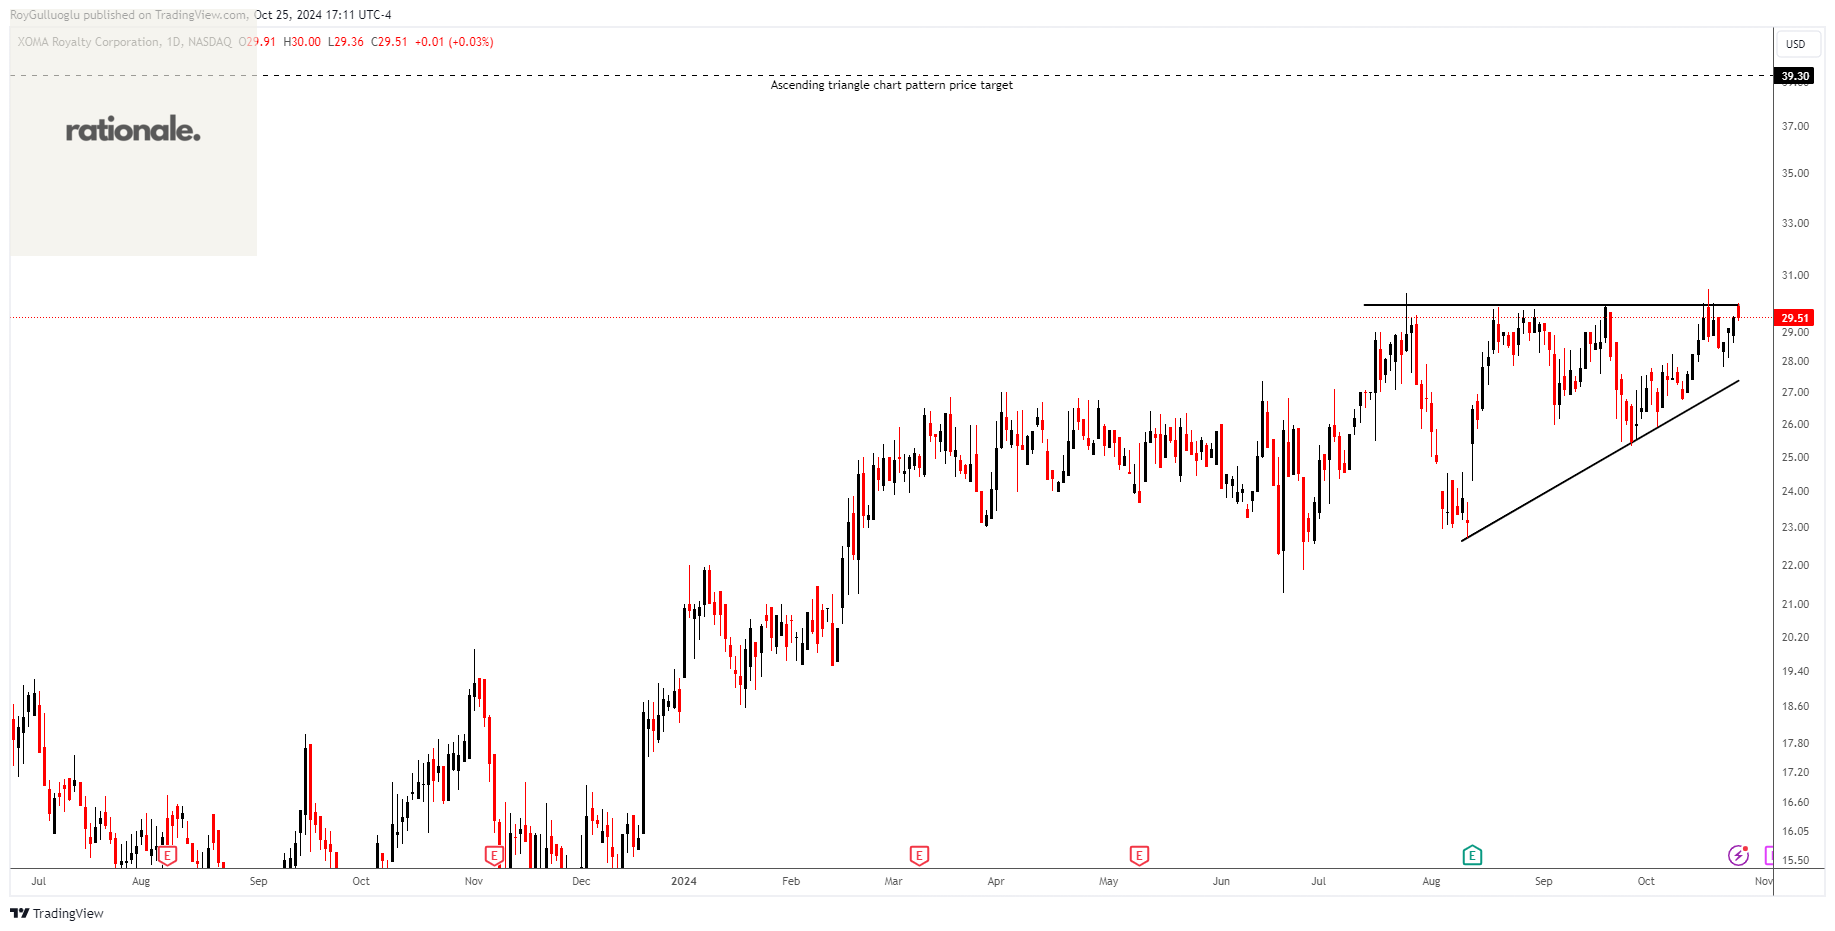
XOMA Royalty Corporation operates as a biotech royalty aggregator in the United States and the Asia Pacific.
The above daily chart formed an approximately 2-month-long ascending triangle chart pattern as a bullish continuation after an uptrend.
The horizontal boundary at 29.95 levels acts as a resistance within this pattern.
A daily close above 30.85 levels would validate the breakout from the 2-month-long ascending triangle chart pattern.
Based on this chart pattern, the potential price target is 39.3 levels.
XOMA, classified under the "healthcare" sector, falls under the “Small Cap - Value” stock category.
Alphabet Inc.-(GOOG/NASDAQ)-Long Idea
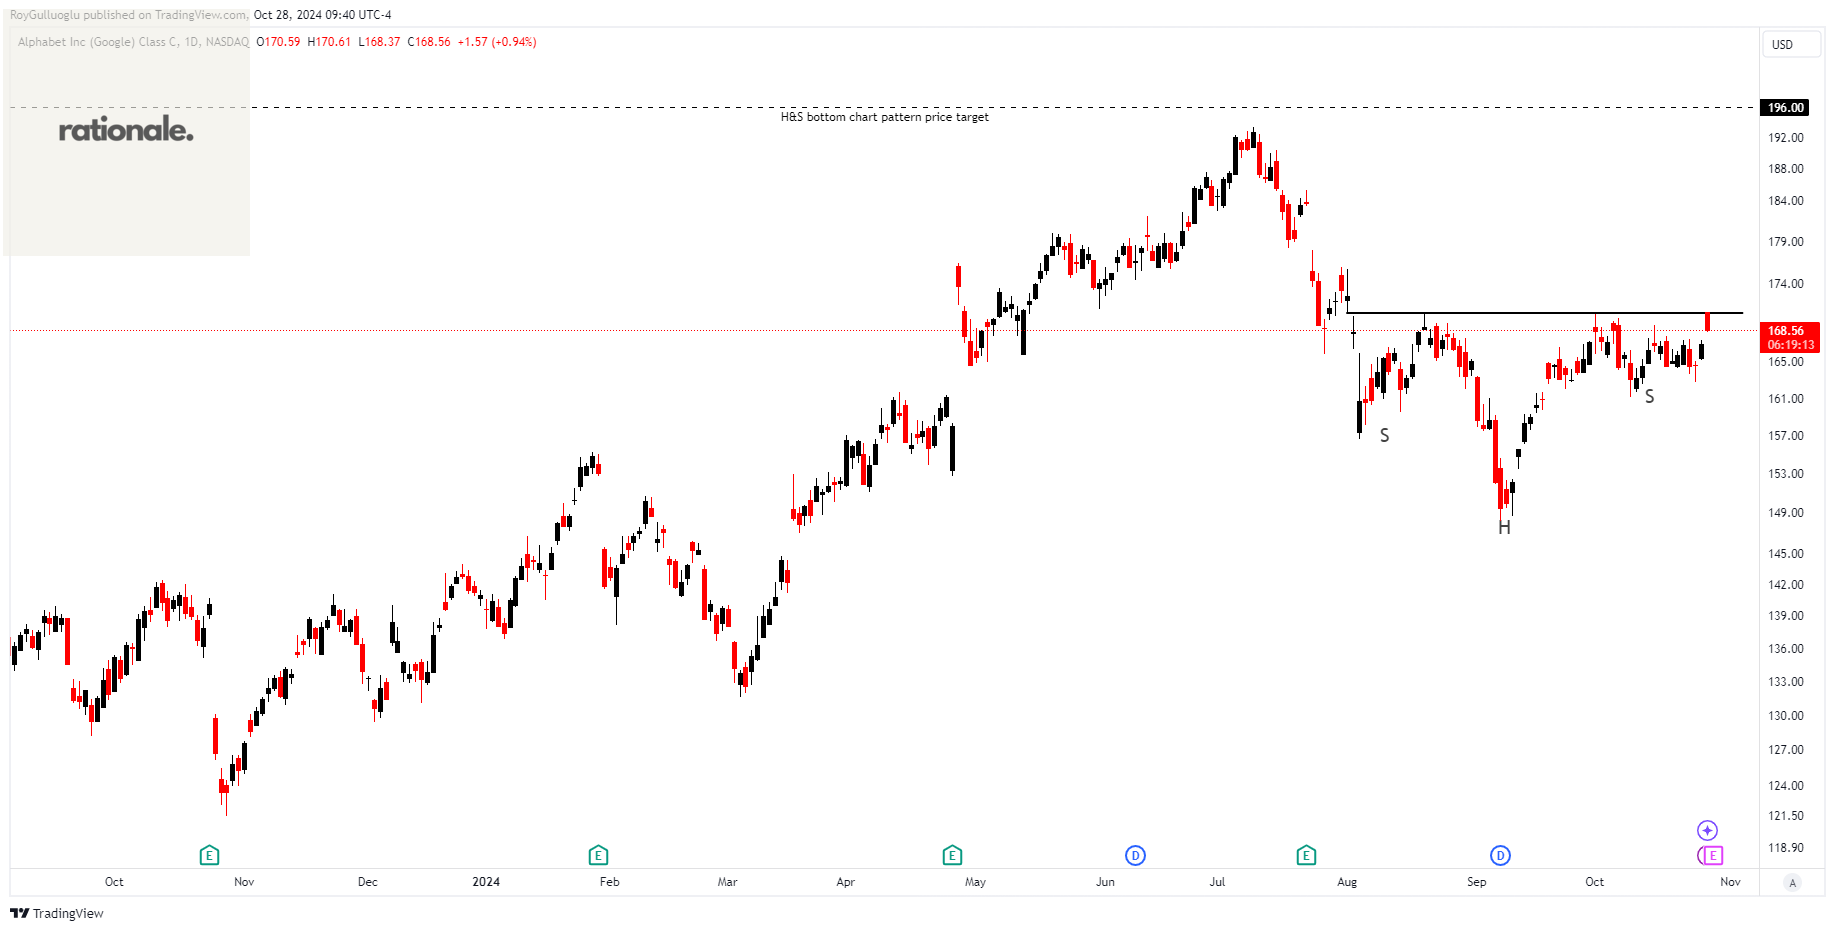
Alphabet Inc. offers various products and platforms in the United States, Europe, the Middle East, Africa, the Asia-Pacific, Canada, and Latin America
The above daily chart formed an approximately 2-month-long H&S bottom chart pattern as a bullish reversal after a downtrend.
The horizontal boundary at 170.5 levels acts as a resistance within this pattern.
A daily close above 175 levels would validate the breakout from the 2-month-long cup & handle chart pattern.
Based on this chart pattern, the potential price target is 196 levels.
GOOG, classified under the "communication services" sector, falls under the “Large Cap - Growth” stock category.