

Trade Ideas Equities
HNI(NYSE), KR(NYSE), KEN(NYSE), CLSK(NASDAQ), APH(NYSE), FAST(NASDAQ)

HNI Corporation-(HNI/NYSE)-Long Idea
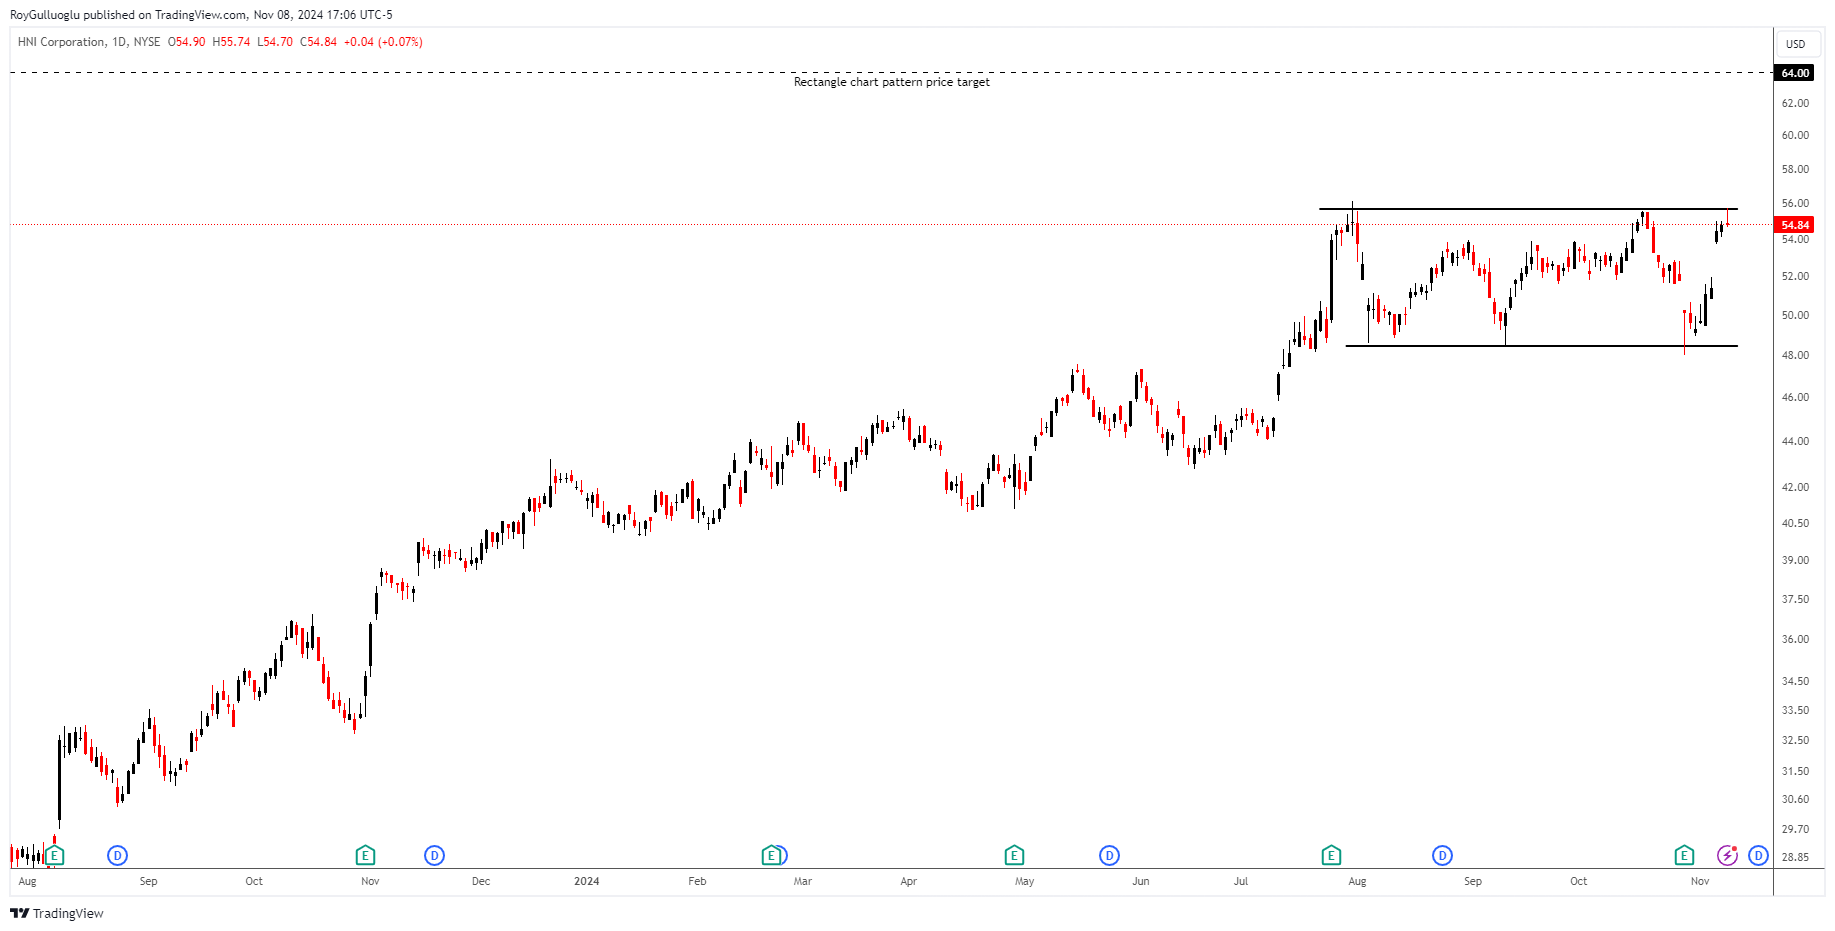
HNI Corporation, together with its subsidiaries, engages in the manufacture, sale, and marketing of workplace furnishings and residential building products primarily in the United States and Canada.
The above daily chart formed an approximately 3-month-long rectangle chart pattern chart pattern as a bullish continuation after an uptrend.
The horizontal boundary at 55.68 levels acts as a resistance within this pattern.
A daily close above 57.35 levels would validate the breakout from the rectangle chart patterns.
Based on this chart pattern, the potential price target is 64 levels.
HNI, classified under the "industrials" sector, falls under the “Mid Cap - Value” stock category.
The Kroger Co.-(KR/NYSE)-Long Idea
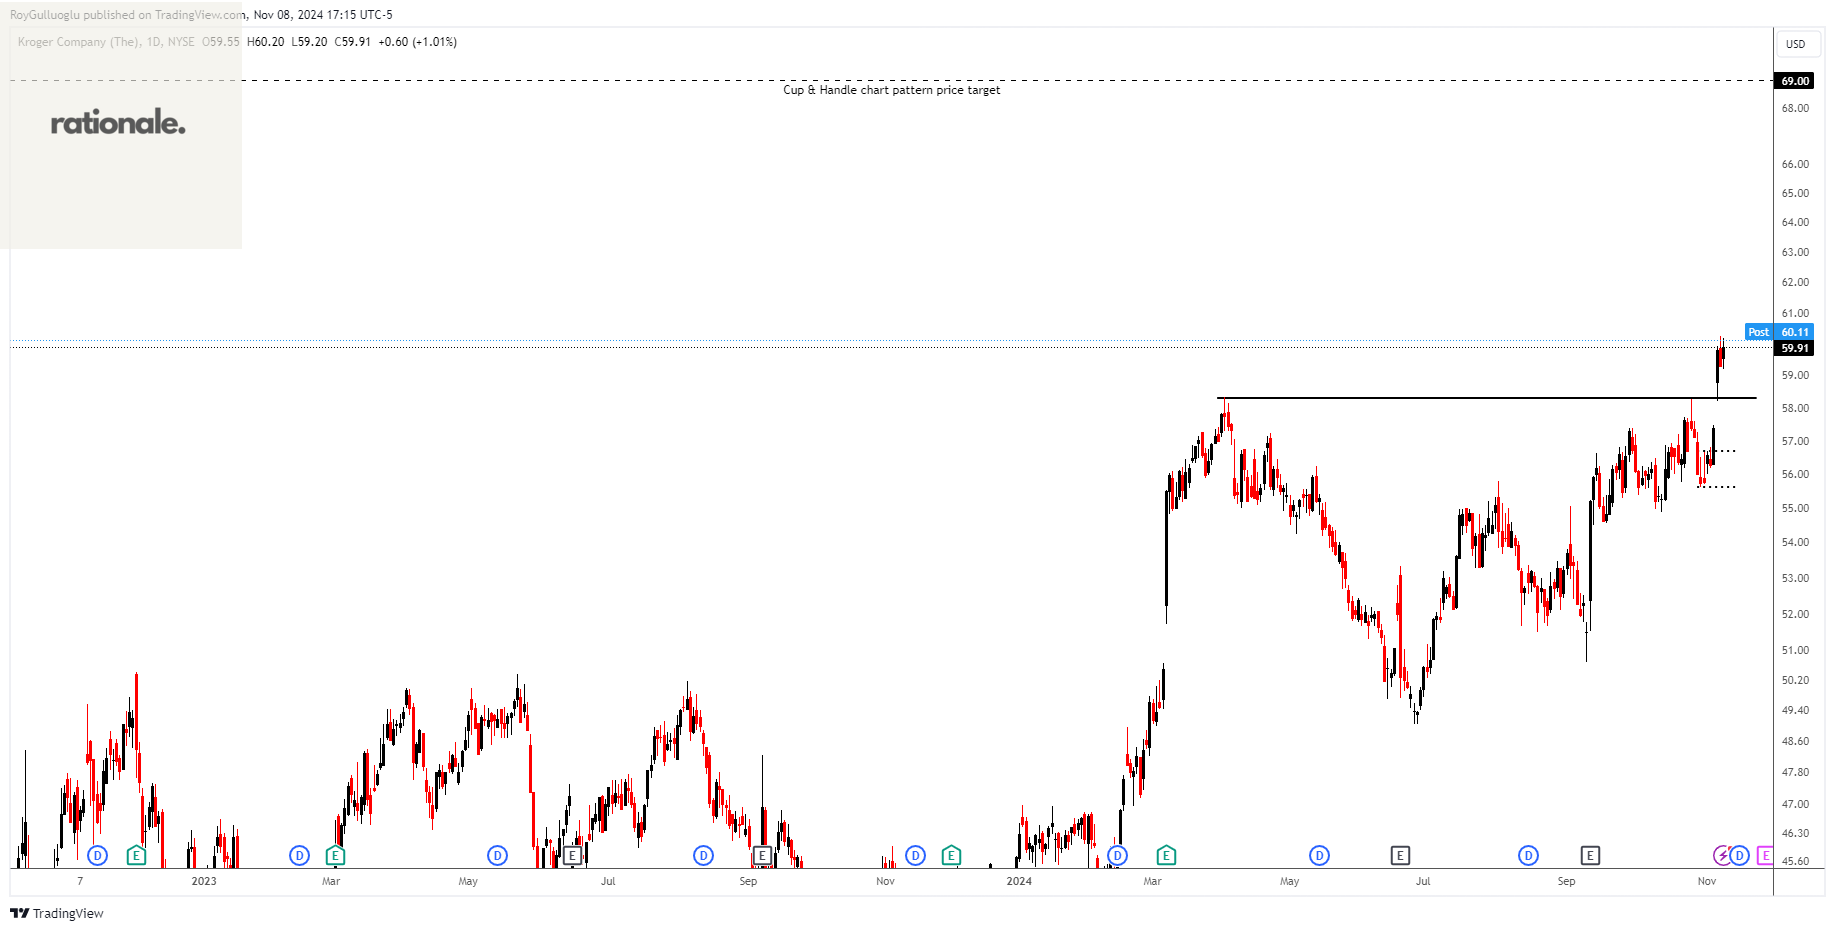
The Kroger Co. operates as a food and drug retailer in the United States. The company operates combination food and drug stores, multi-department stores, marketplace stores, and price-impact warehouses.
The above daily chart formed an approximately 5-month-long cup & handle chart pattern as a bullish continuation after an uptrend.
The horizontal boundary at 58.29 levels acted as a resistance within this pattern.
A daily close above 60 levels validated the breakout from the 5-month-long cup & handle chart pattern.
Based on this chart pattern, the potential price target is 69 levels.
KR, classified under the "consumer defensive" sector, falls under the “Large Cap - Value” stock category.
Kenon Holdings Ltd.-(KEN/NYSE)-Long Idea
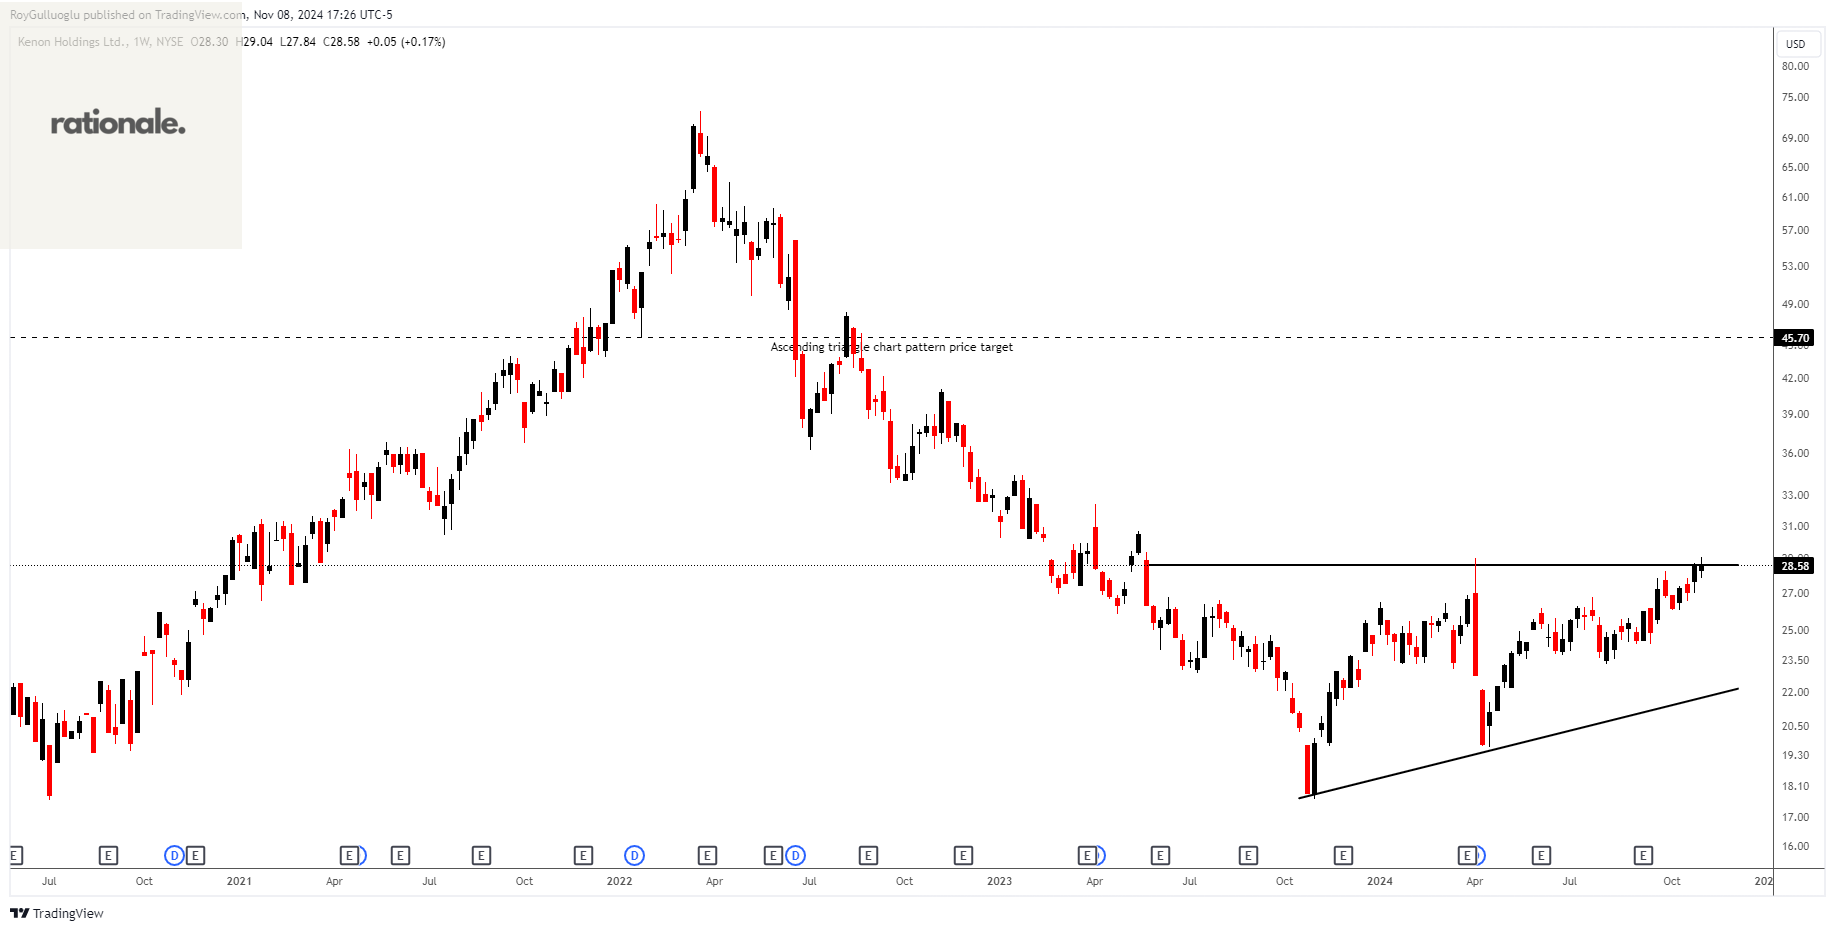
Kenon Holdings Ltd., through its subsidiaries, operates as an owner, developer, and operator of power generation facilities in Israel, the United States, and internationally.
The above weekly chart formed an approximately 18-month-long ascending triangle chart pattern as a bullish reversal after a downtrend.
The horizontal boundary at 28.56 levels acts as a resistance within this pattern.
A daily close above 29.42 levels would validate the breakout from the 18-month-long ascending triangle chart pattern.
Based on this chart pattern, the potential price target is 45.7 levels.
KEN, classified under the "utilities" sector, falls under the “Small Cap - Income” stock category.
CleanSpark, Inc.-(CLSK/NASDAQ)-Long Idea
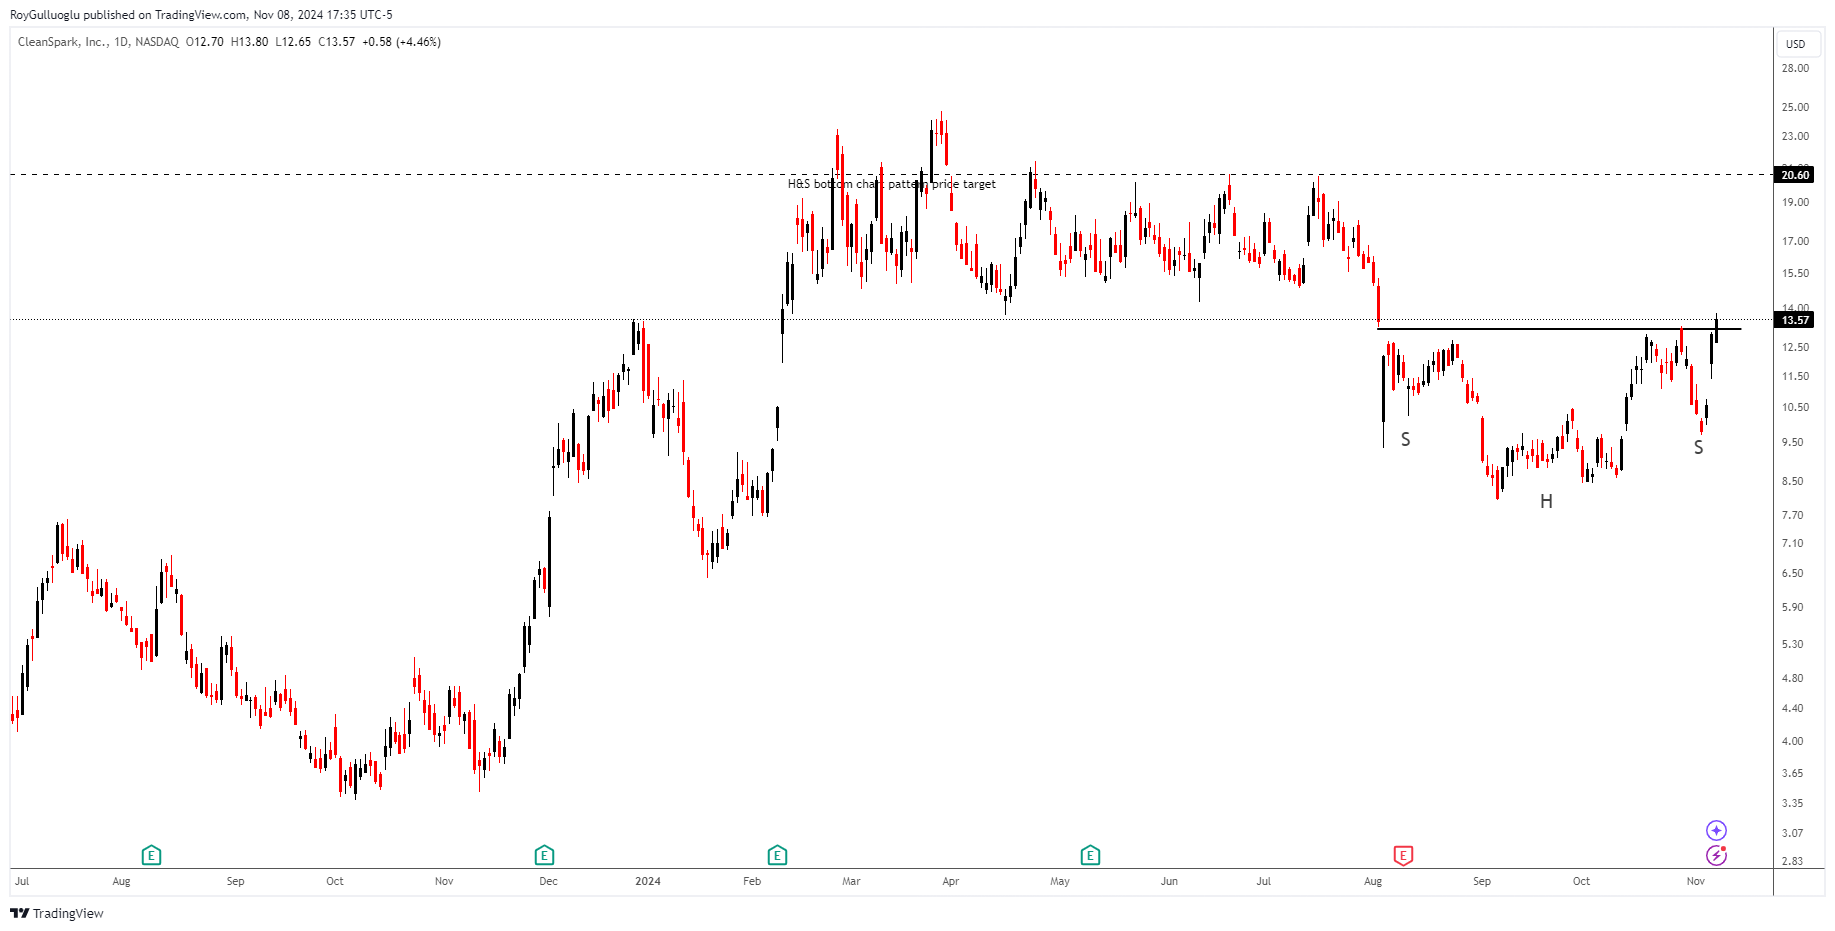
CleanSpark, Inc. operates as a bitcoin miner in the Americas. It owns and operates data centers that primarily run on low-carbon power. Its infrastructure supports Bitcoin, a digital commodity and a tool for financial independence and inclusion.
The above daily chart formed an approximately 3-month-long H&S bottom chart pattern as a bullish reversal after a downtrend.
The horizontal boundary at 13.18 levels acted as a resistance within this pattern.
A daily close above 13.57 levels validated the breakout from the 3-month-long H&S bottom chart pattern.
Based on this chart pattern, the potential price target is 20.6 levels.
CLSK, classified under the "financial services" sector, falls under the “Mid Cap - Income” stock category.
Amphenol Corporation-(APH/NYSE)-Long Idea
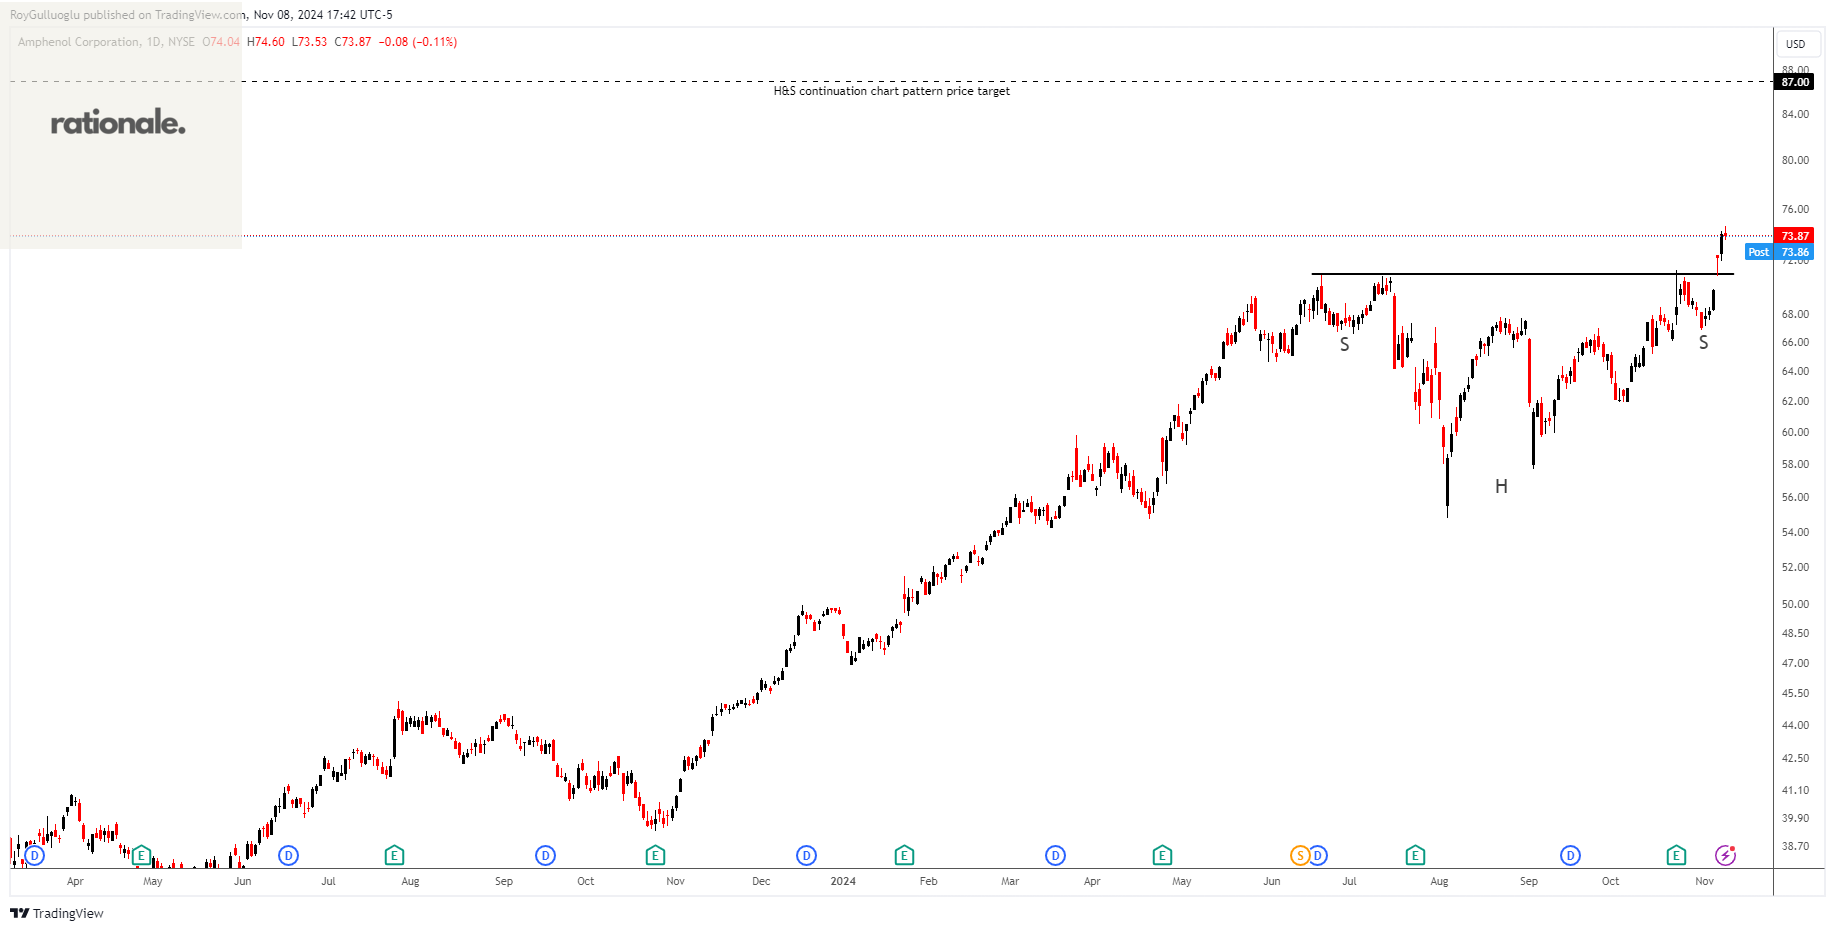
Amphenol Corporation, together with its subsidiaries, primarily designs, manufactures, and markets electrical, electronic, and fiber optic connectors in the United States, China, and internationally.
The above daily chart formed an approximately 3-month-long H&S top chart pattern as a bullish continuation after an uptrend.
The horizontal boundary at 70.89 levels acted as a resistance within this pattern.
A daily close above 73 levels validated the breakout from the 3-month-long H&S top chart pattern.
Based on this chart pattern, the potential price target is 87 levels.
APH, classified under the "technology" sector, falls under the “Large Cap - Growth” stock category.
Fastenal Company-(FAST/NASDAQ)-Long Idea
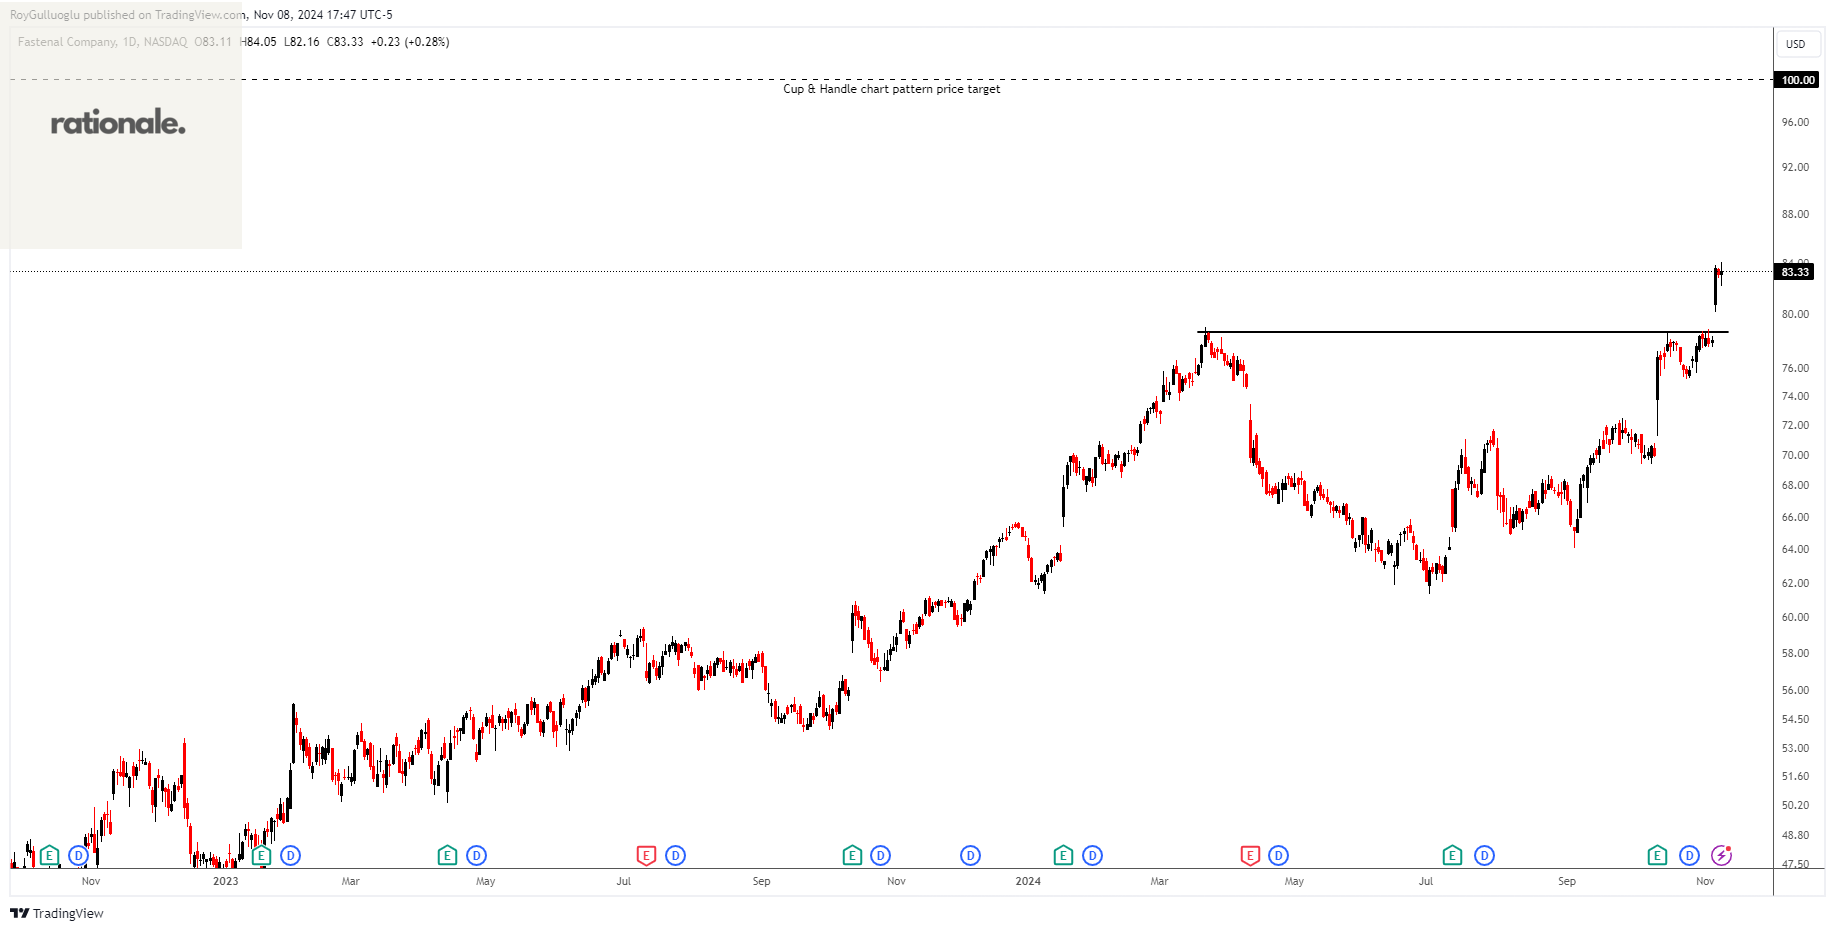
Fastenal Company, together with its subsidiaries, engages in the wholesale distribution of industrial and construction supplies in the United States, Canada, Mexico, North America, and internationally.
The above daily chart formed an approximately 3-month-long cup & handle chart pattern as a bullish continuation after an uptrend.
The horizontal boundary at 78.68 levels acted as a resistance within this pattern.
A daily close above 81.04 levels validated the breakout from the 3-month-long cup & handle chart pattern.
Based on this chart pattern, the potential price target is 100 levels.
FAST, classified under the "industrials" sector, falls under the “Large Cap - Growth” stock category.