

Trade Ideas Fx-Futures-Etf-Crypto
NQ1!, STXUSDT, UNIUSDT, FETUSDT, VETUSDT, BRETUSDT

NQ1!(NASDAQ 100 E-mini Index Futures)-Long Idea
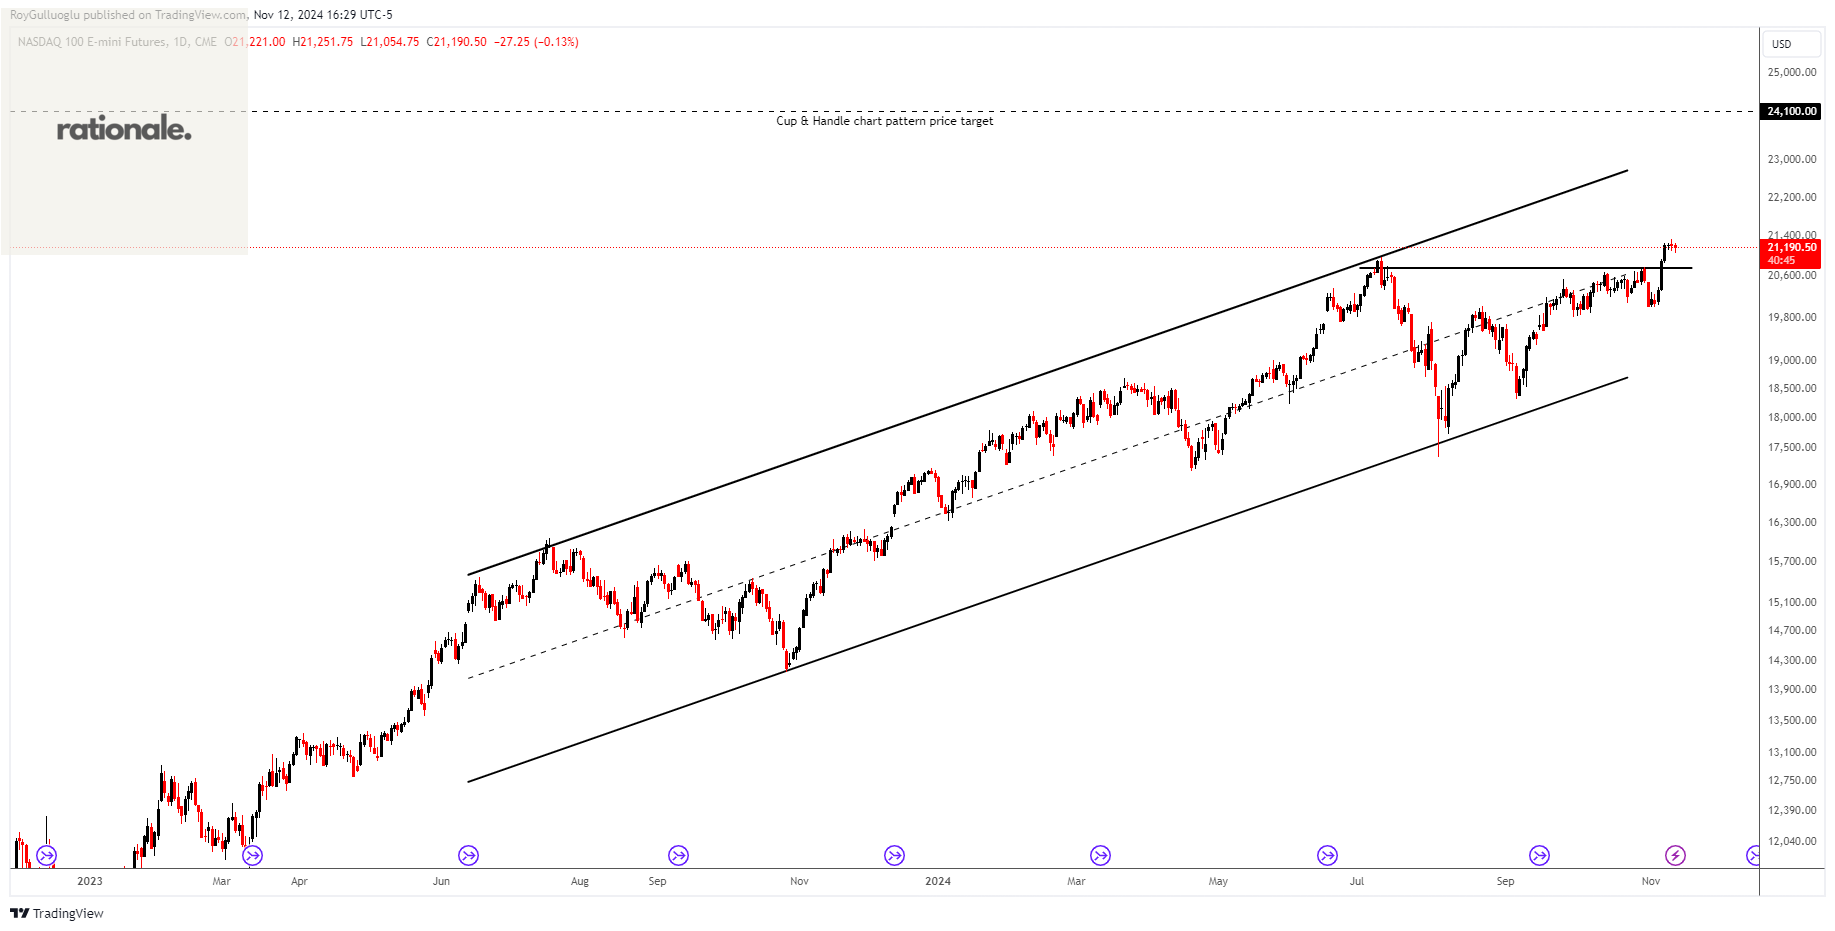
The above daily chart formed an approximately 3-month-long cup & handle chart pattern as a bullish continuation after an uptrend.
Within this pattern, the horizontal boundary at 20772 levels acted as strong support.
A daily close above 21090 levels(%1 or %1.5 high of the resistance for FX, Futures) validated the breakout from the 3-month-long cup & handle chart pattern.
Based on this chart pattern, the potential price target is 24100 levels.
STXUSDT-Long Idea
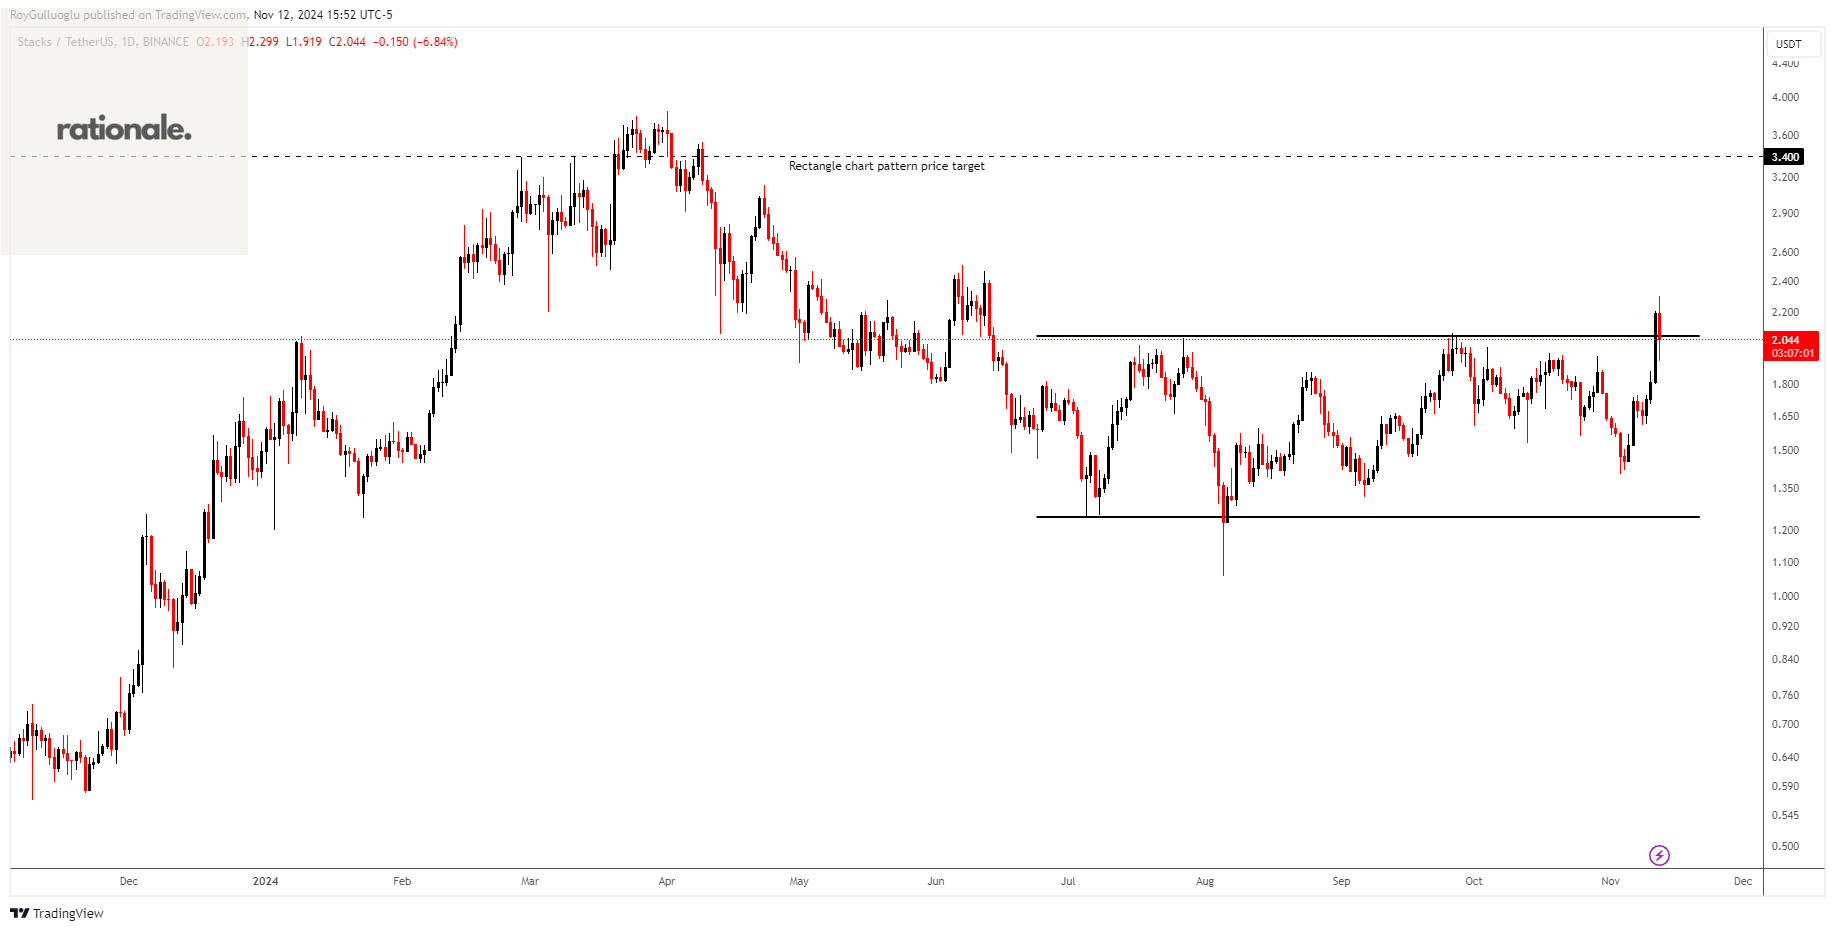
The above daily chart formed an approximately 4-month-long rectangle chart pattern as a bullish reversal after a downtrend.
The horizontal boundary at 2.06 levels acted as a resistance within this pattern.
A daily close above 2.13 levels validated the breakout from the 4-month-long rectangle chart pattern.
Based on this chart pattern, the potential price target is approximately 3.4 levels.
UNIUSDT-Long Idea
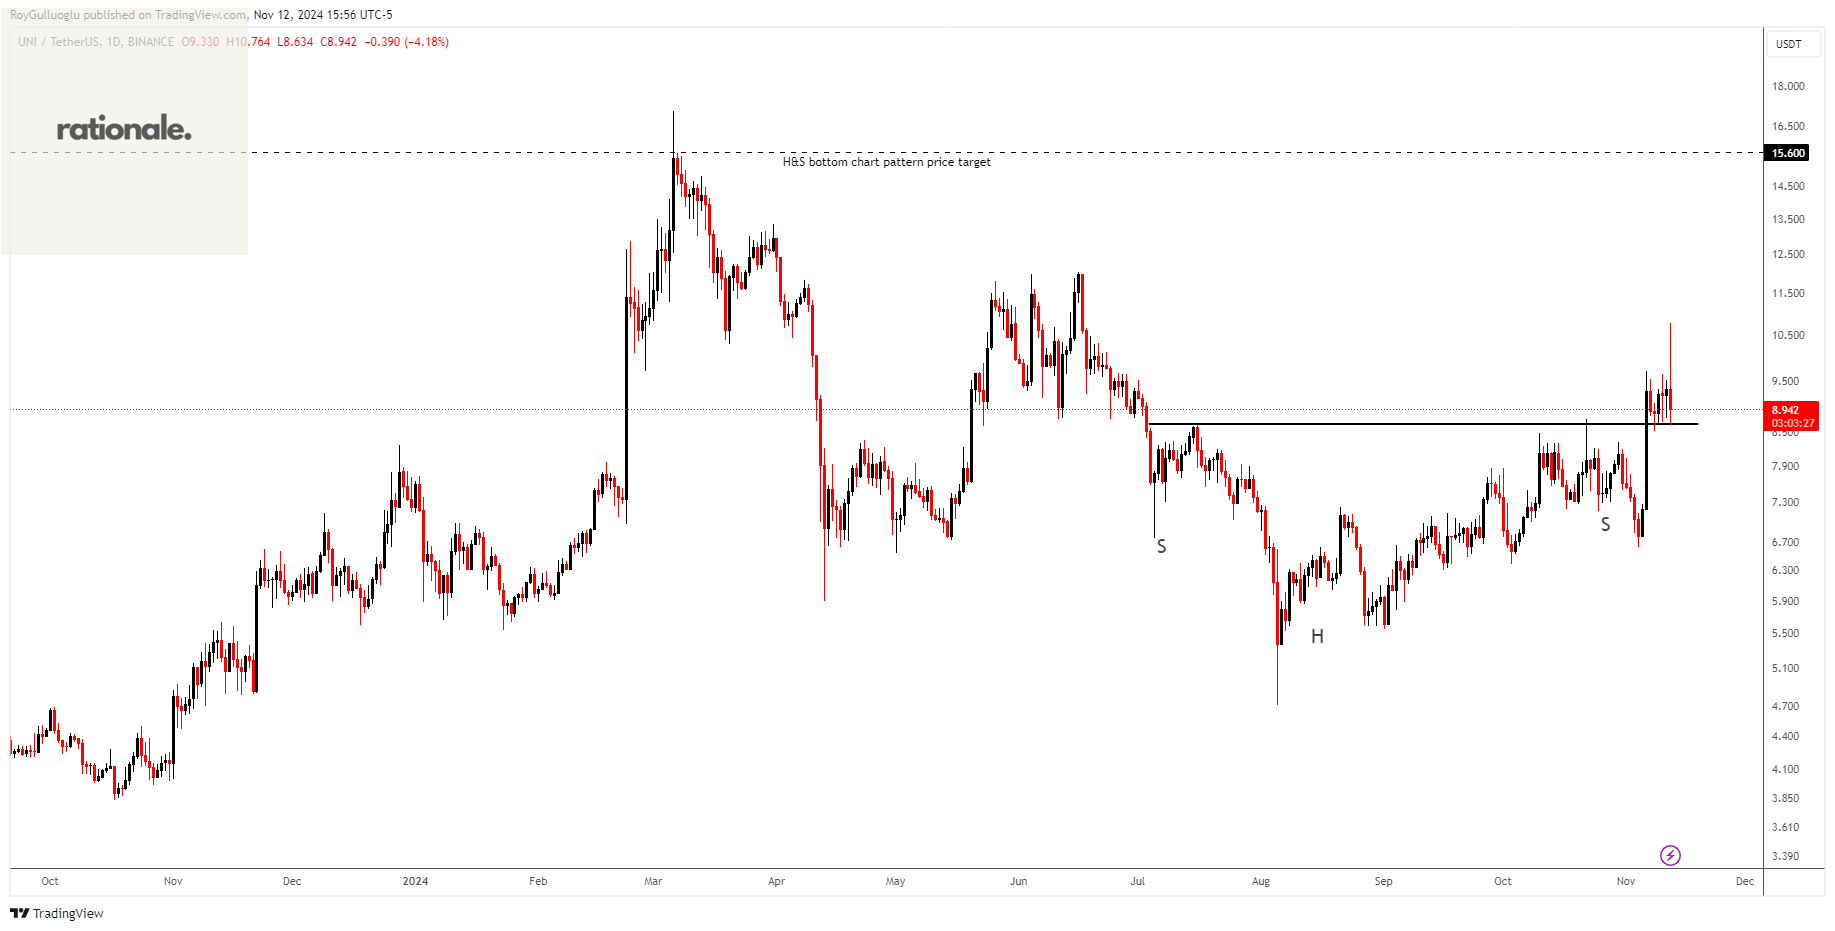
The above daily chart formed an approximately 4-month-long H&S bottom chart pattern as a bullish reversal after a downtrend.
The horizontal boundary at 8.65 levels acted as a resistance within this pattern.
The price is pulling back toward the support level.
A daily close above 8.9 levels validated the breakout from the 4-month-long H&S bottom chart pattern.
Based on this chart pattern, the potential price target is approximately 15.6 levels.
FETUSDT-Long Idea
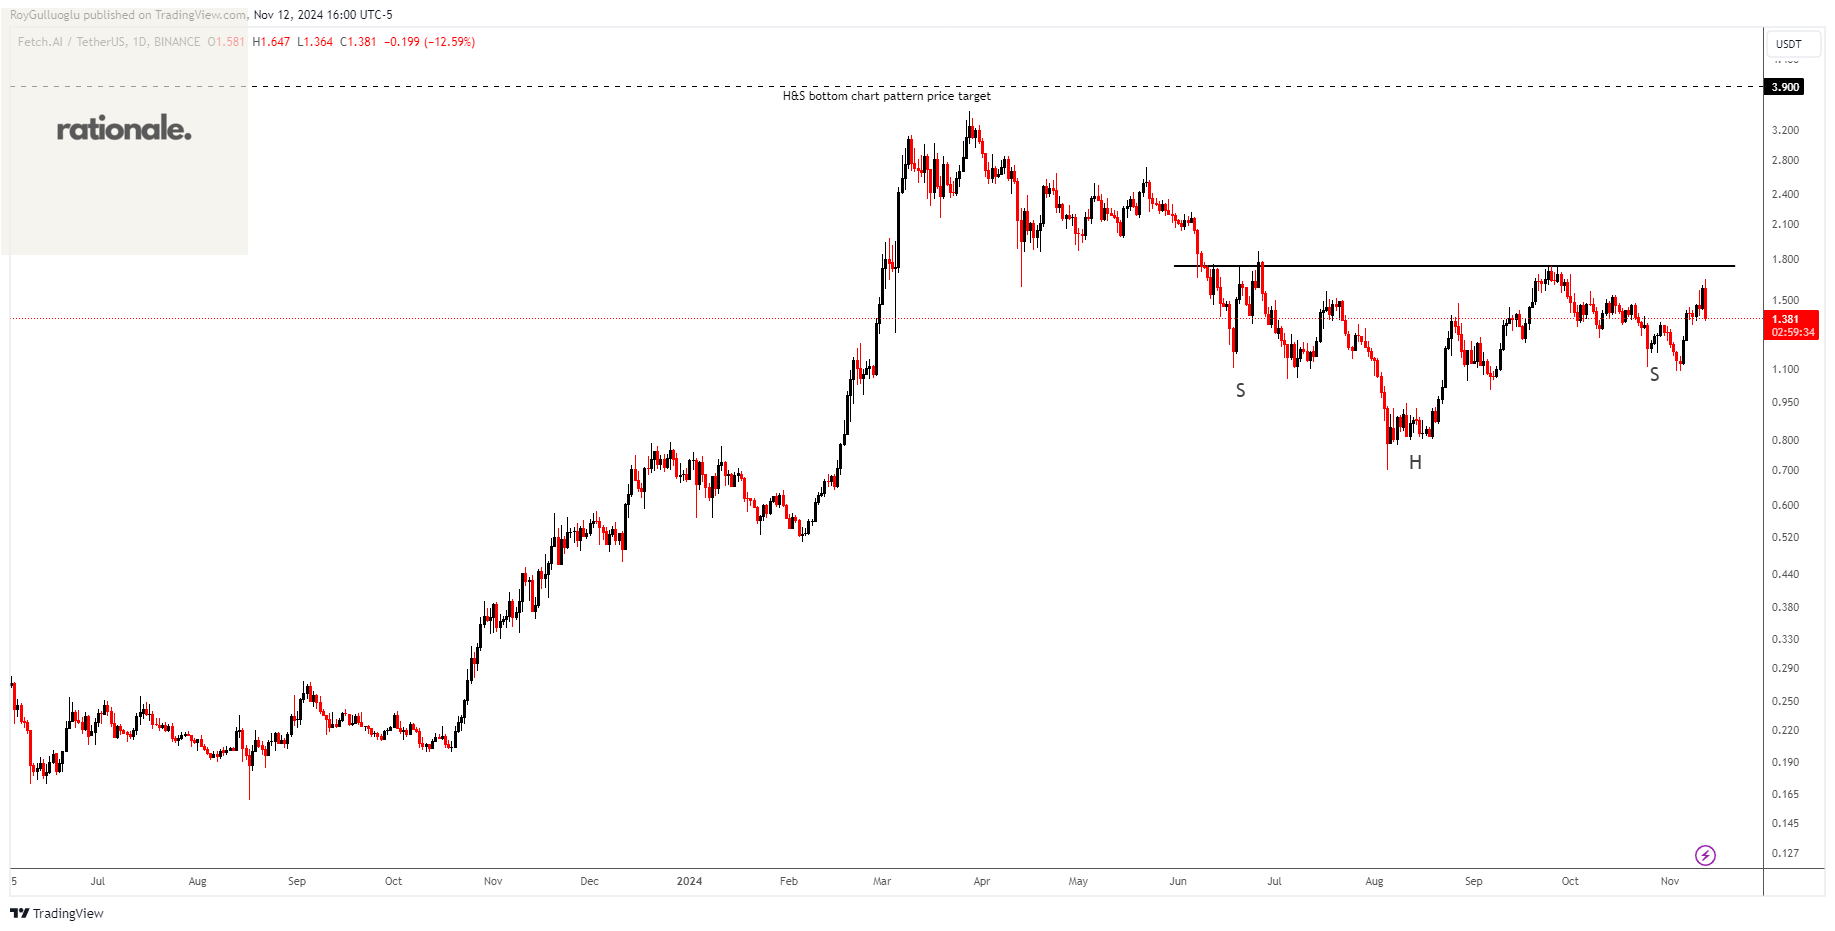
The above daily chart formed an approximately 5-month-long H&S bottom chart pattern as a bullish reversal after a downtrend.
The horizontal boundary at 1.74 levels acts as a resistance within this pattern.
A daily close above 1.79 levels would validate the breakout from the 5-month-long H&S bottom chart pattern.
Based on this chart pattern, the potential price target is approximately 15.6 levels.
VETUSDT-Long Idea
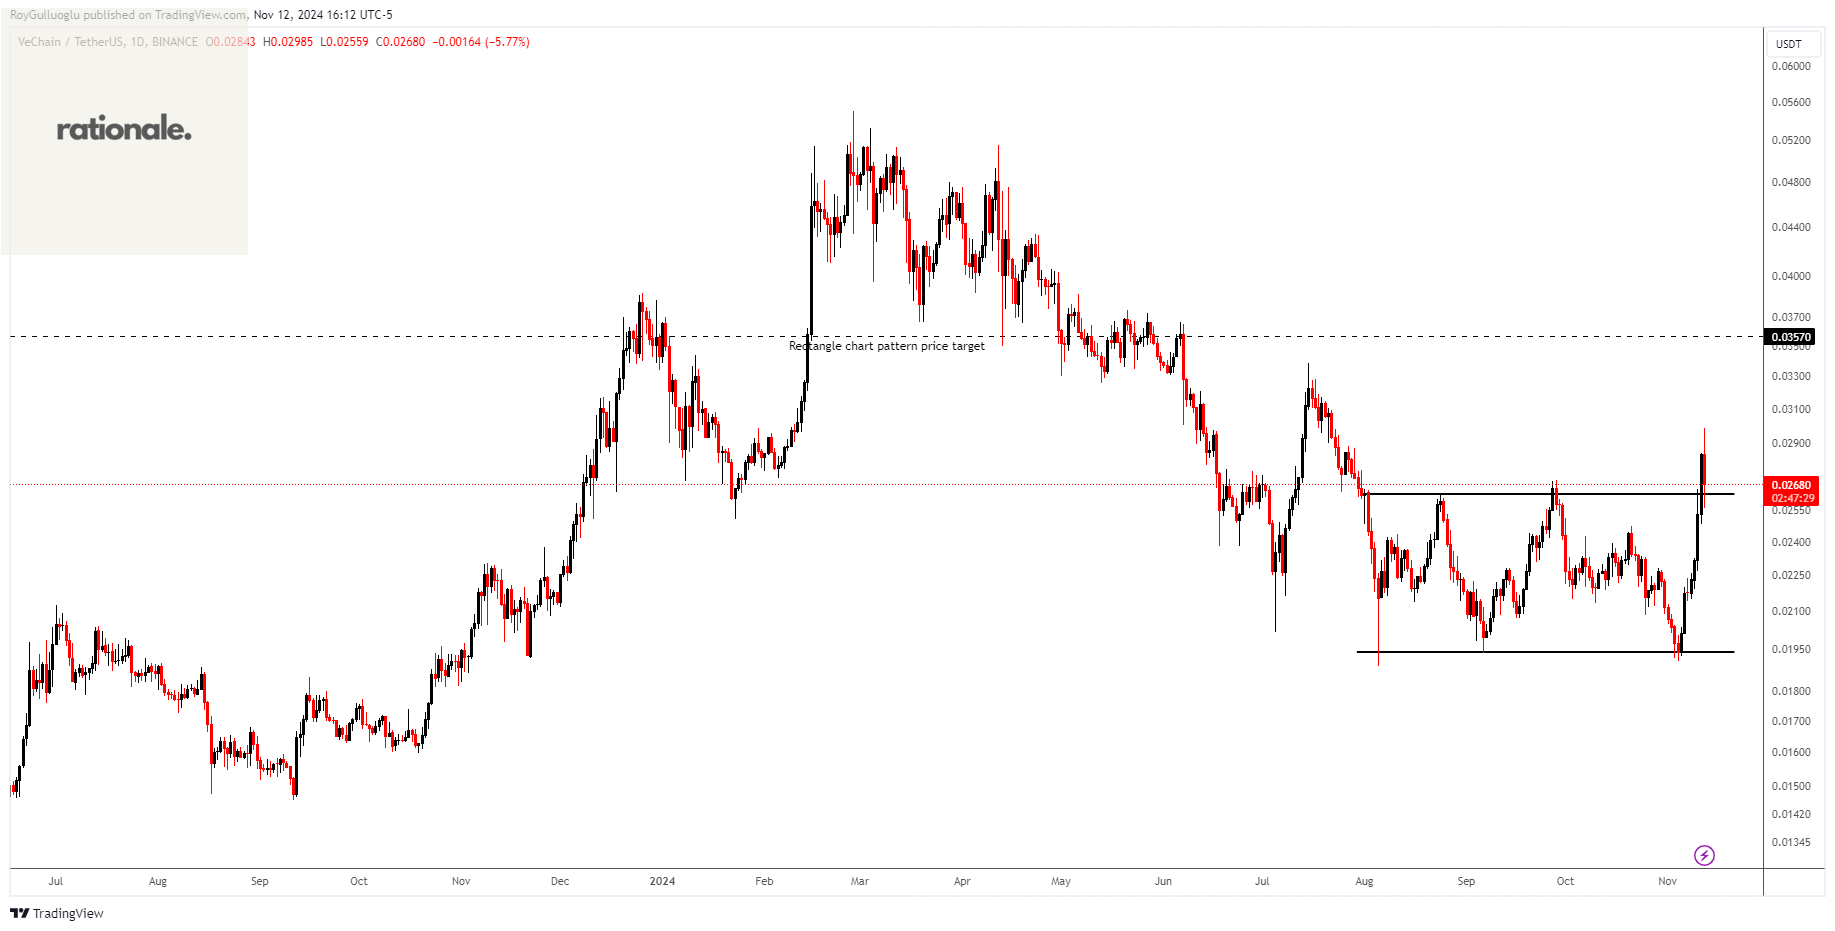
The above daily chart formed an approximately 3-month-long rectangle chart pattern as a bullish reversal after a downtrend.
The horizontal boundary at 0.027 levels acted as a resistance within this pattern.
A daily close above 0.0278 levels validated the breakout from the 3-month-long rectangle chart pattern.
Based on this chart pattern, the potential price target is approximately 3.4 levels.
BRETUSDT-Long Idea
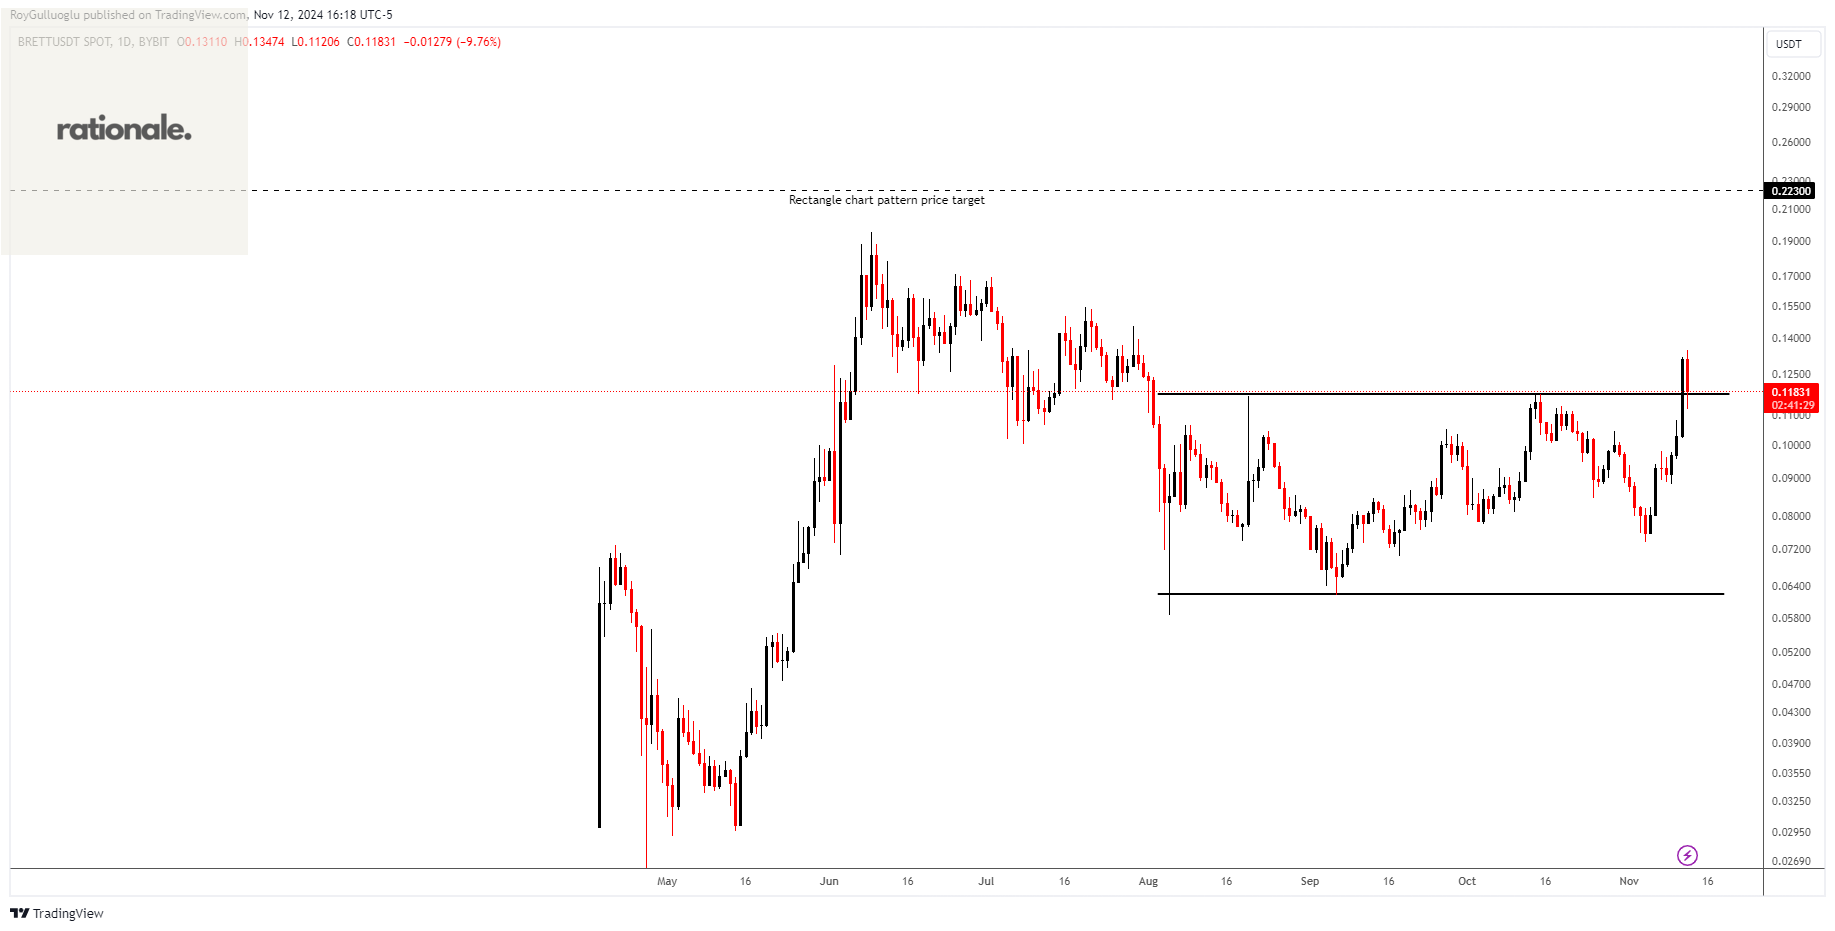
The above daily chart formed an approximately 3-month-long rectangle chart pattern as a bullish reversal after a downtrend.
The horizontal boundary at 0.1173 levels acted as a resistance within this pattern.
A daily close above 0.12 levels validated the breakout from the 3-month-long rectangle chart pattern.
Based on this chart pattern, the potential price target is approximately 0.223 levels.