

Trade Ideas Equities
AZO(NYSE), AER(NYSE), MDB(NASDAQ), MAIN(NYSE) GLE(EURONEXT), TURSG(BIST), NETC(OMXCOP)

AutoZone, Inc.-(AZO/NYSE)-Long Idea
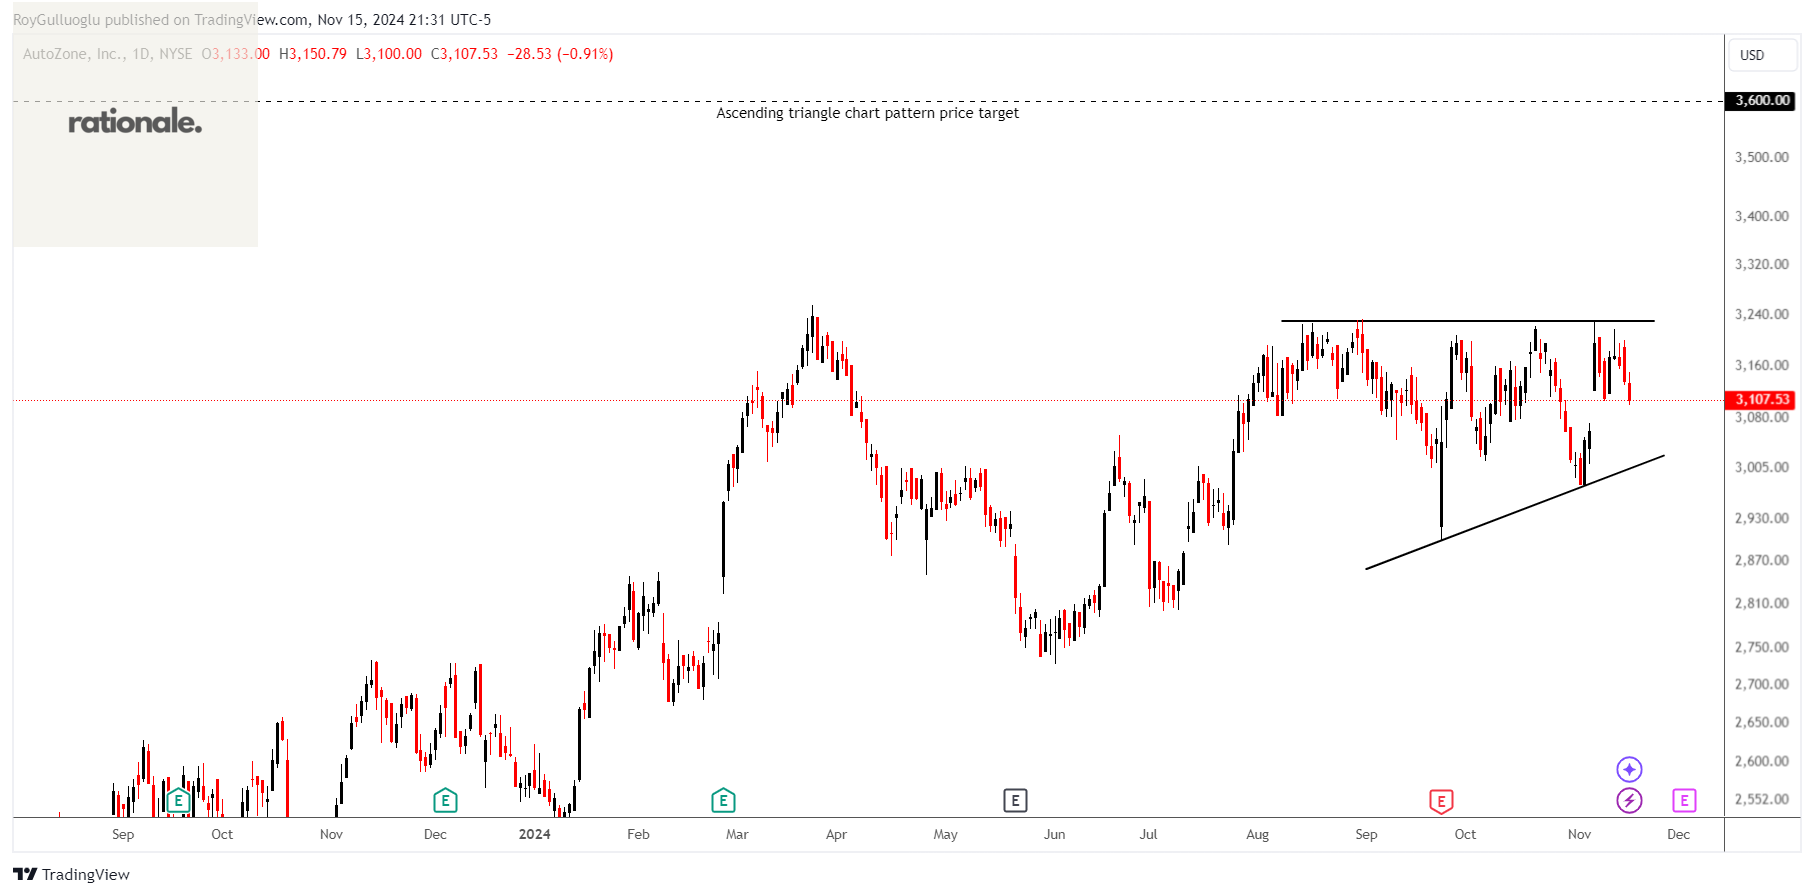
AutoZone, Inc. retails and distributes automotive replacement parts and accessories in the United States, Mexico, and Brazil.
The above daily chart formed an approximately 2-month-long ascending triangle chart pattern chart pattern as a bullish continuation after an uptrend.
The horizontal boundary at 3231 levels acts as a resistance within this pattern.
A daily close above 3328 levels would validate the breakout from the 2-month-long ascending triangle chart pattern.
Based on this chart pattern, the potential price target is 3600 levels.
AZO, classified under the "consumer cyclical" sector, falls under the “Large Cap - Growth” stock category.
AerCap Holdings N.V.-(AER/NYSE)-Long Idea
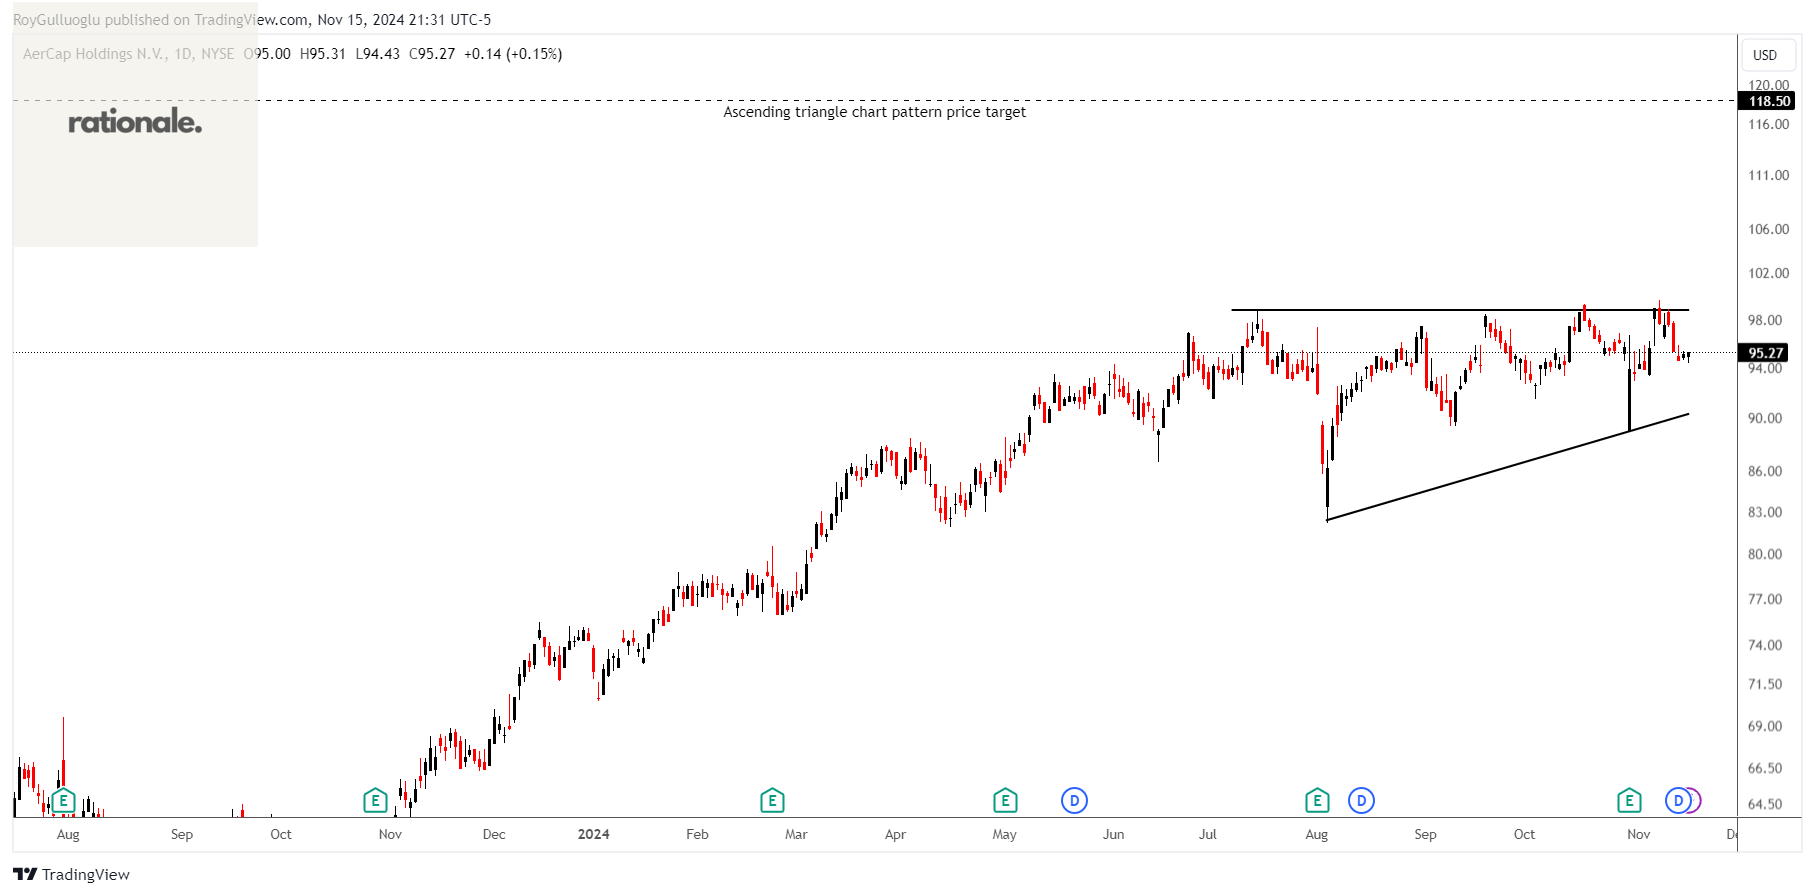
AerCap Holdings N.V. engages in the lease, financing, sale, and management of commercial flight equipment in China, Hong Kong, Macau, the United States, Ireland, and internationally.
The above daily chart formed an approximately 3-month-long ascending triangle chart pattern chart pattern as a bullish continuation after an uptrend.
The horizontal boundary at 98.8 levels acts as a resistance within this pattern.
A daily close above 101.76 levels would validate the breakout from the 3-month-long ascending triangle chart pattern.
Based on this chart pattern, the potential price target is 118.5 levels.
AER, classified under the "industrials" sector, falls under the “Large Cap - Value” stock category.
MongoDB, Inc.-(MDB/NASDAQ)-Long Idea
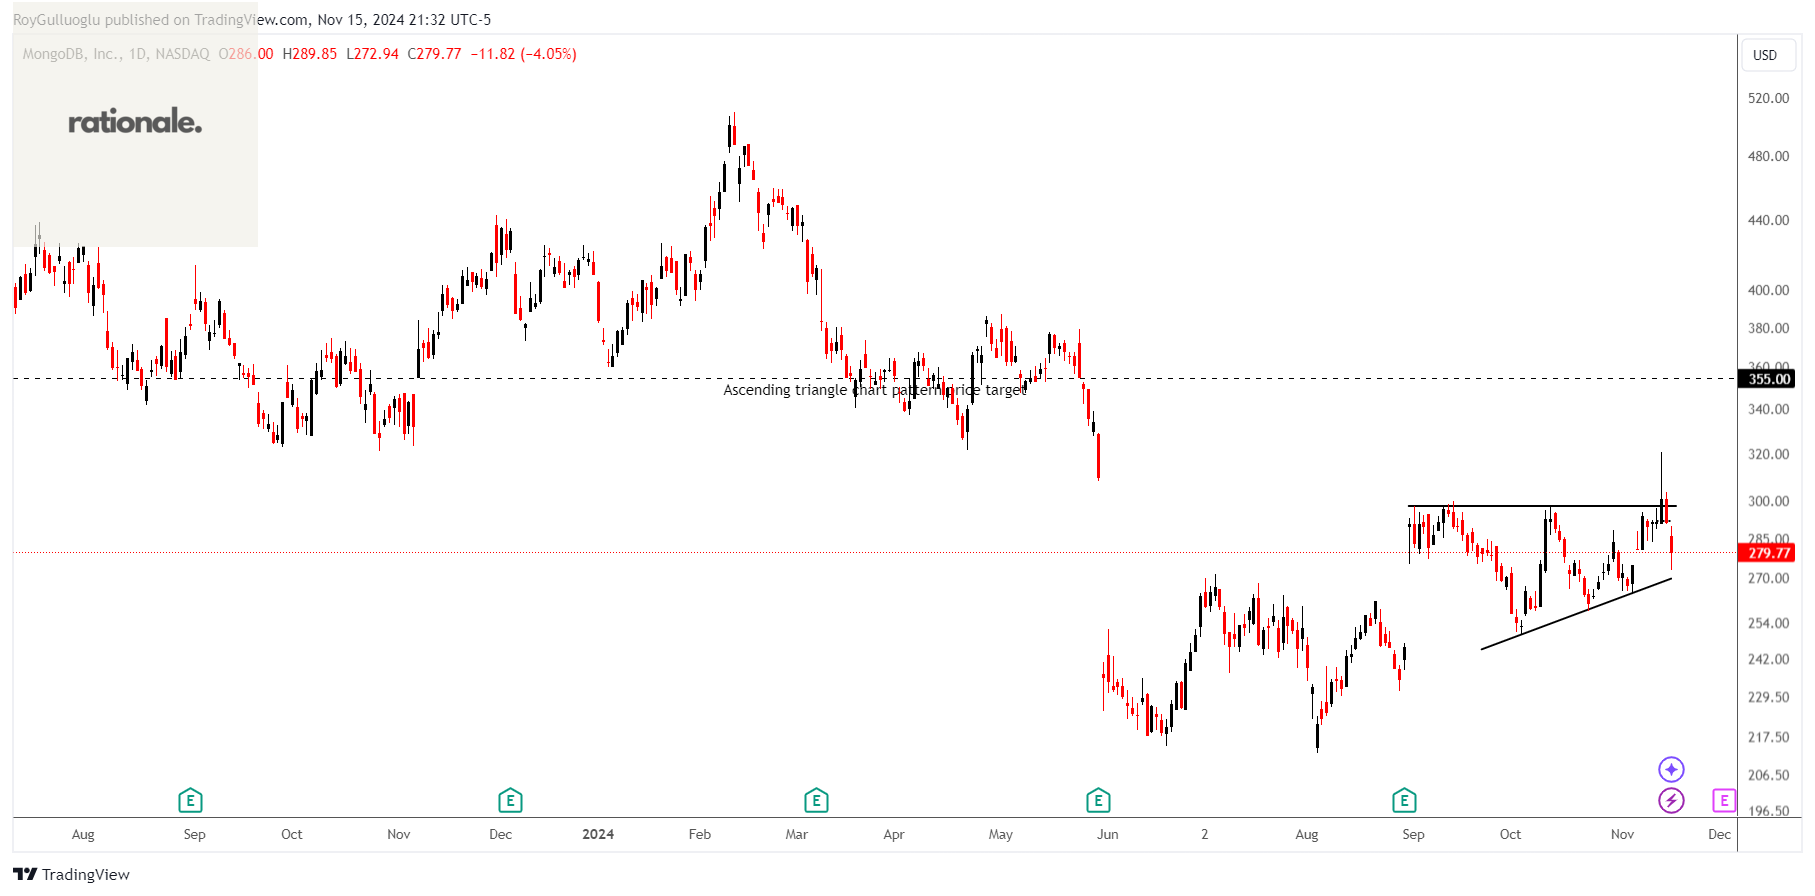
MongoDB, Inc., together with its subsidiaries, provides general purpose database platform worldwide.
The above daily chart formed an approximately 3-month-long ascending triangle chart pattern chart pattern as a bullish continuation after an uptrend.
The horizontal boundary at 298 levels acts as a resistance within this pattern.
A daily close above 307 levels would validate the breakout from the 3-month-long ascending triangle chart pattern.
Based on this chart pattern, the potential price target is 355 levels.
MDB, classified under the "technology" sector, falls under the “Large Cap - Growth” stock category.
Main Street Capital Corporation-(MAIN/NYSE)-Long Idea
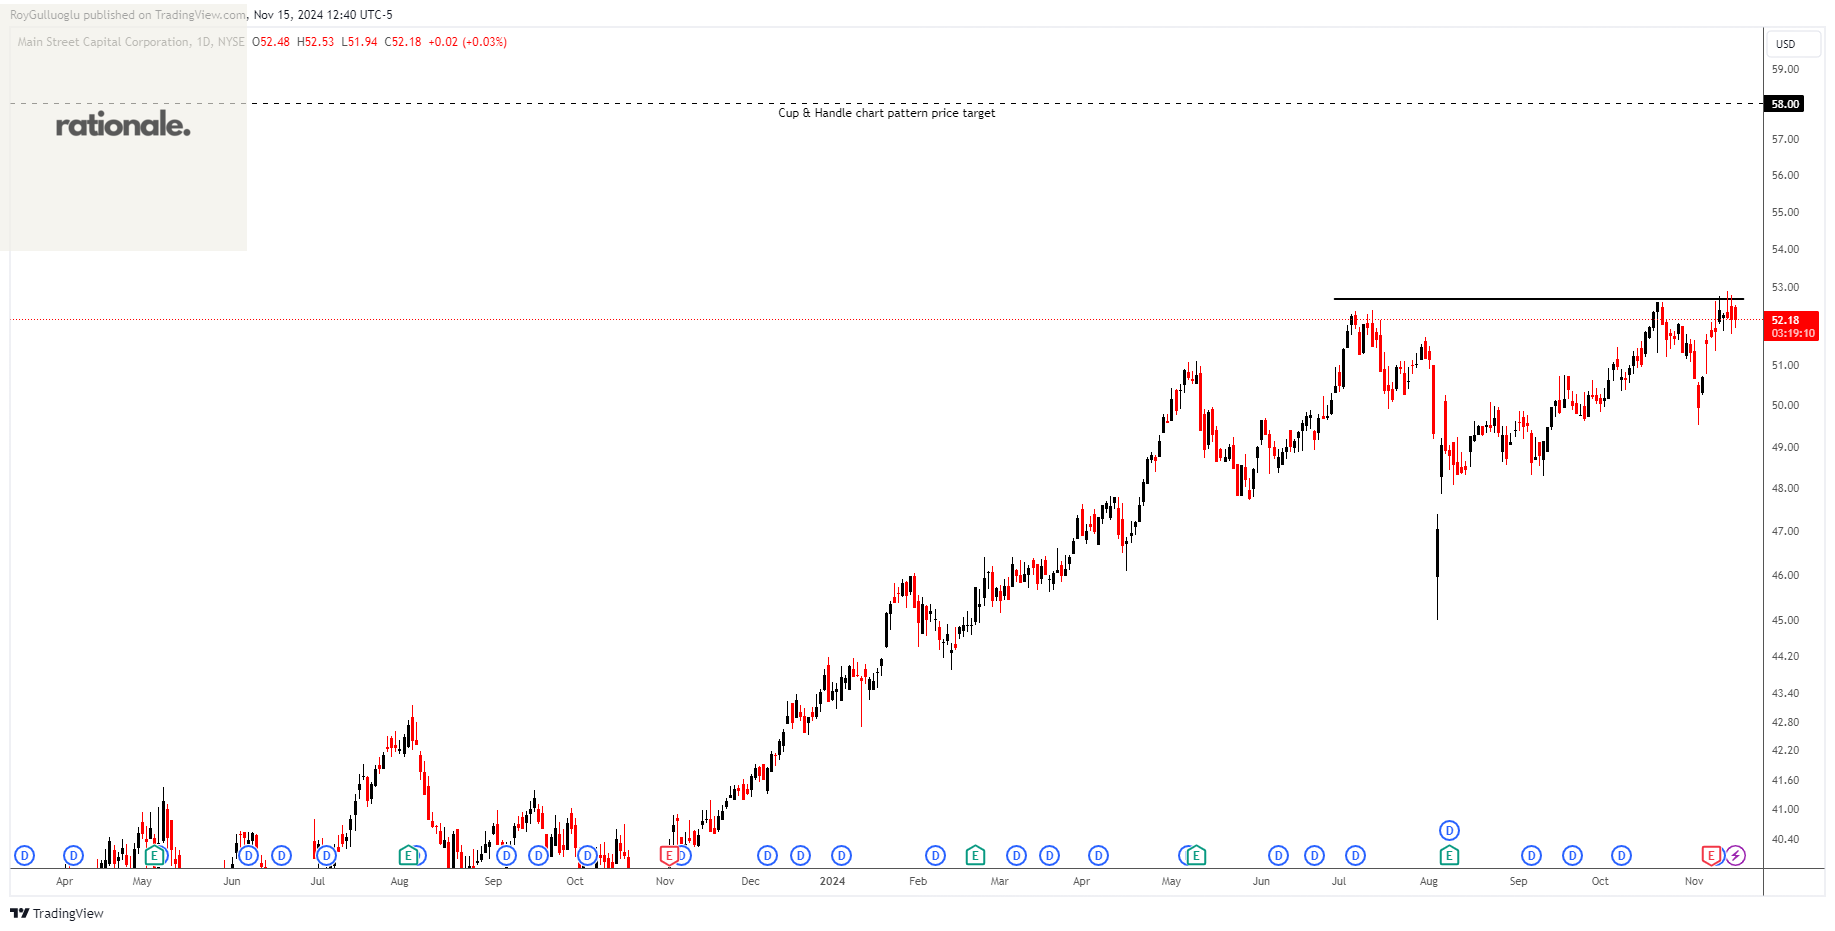
Main Street Capital Corporation is a business development company specializes in equity capital to lower middle market companies.
The above daily chart formed an approximately 3-month-long cup & handle chart pattern chart pattern as a bullish continuation after an uptrend.
The horizontal boundary at 52.68 levels acts as a resistance within this pattern.
A daily close above 54.26 levels would validate the breakout from the 3-month-long cup & handle chart pattern.
Based on this chart pattern, the potential price target is 58 levels.
MAIN, classified under the "financial services" sector, falls under the “Mid Cap - Income” stock category.
Société Générale Société anonyme-(GLE/EURONEXT)-Long Idea
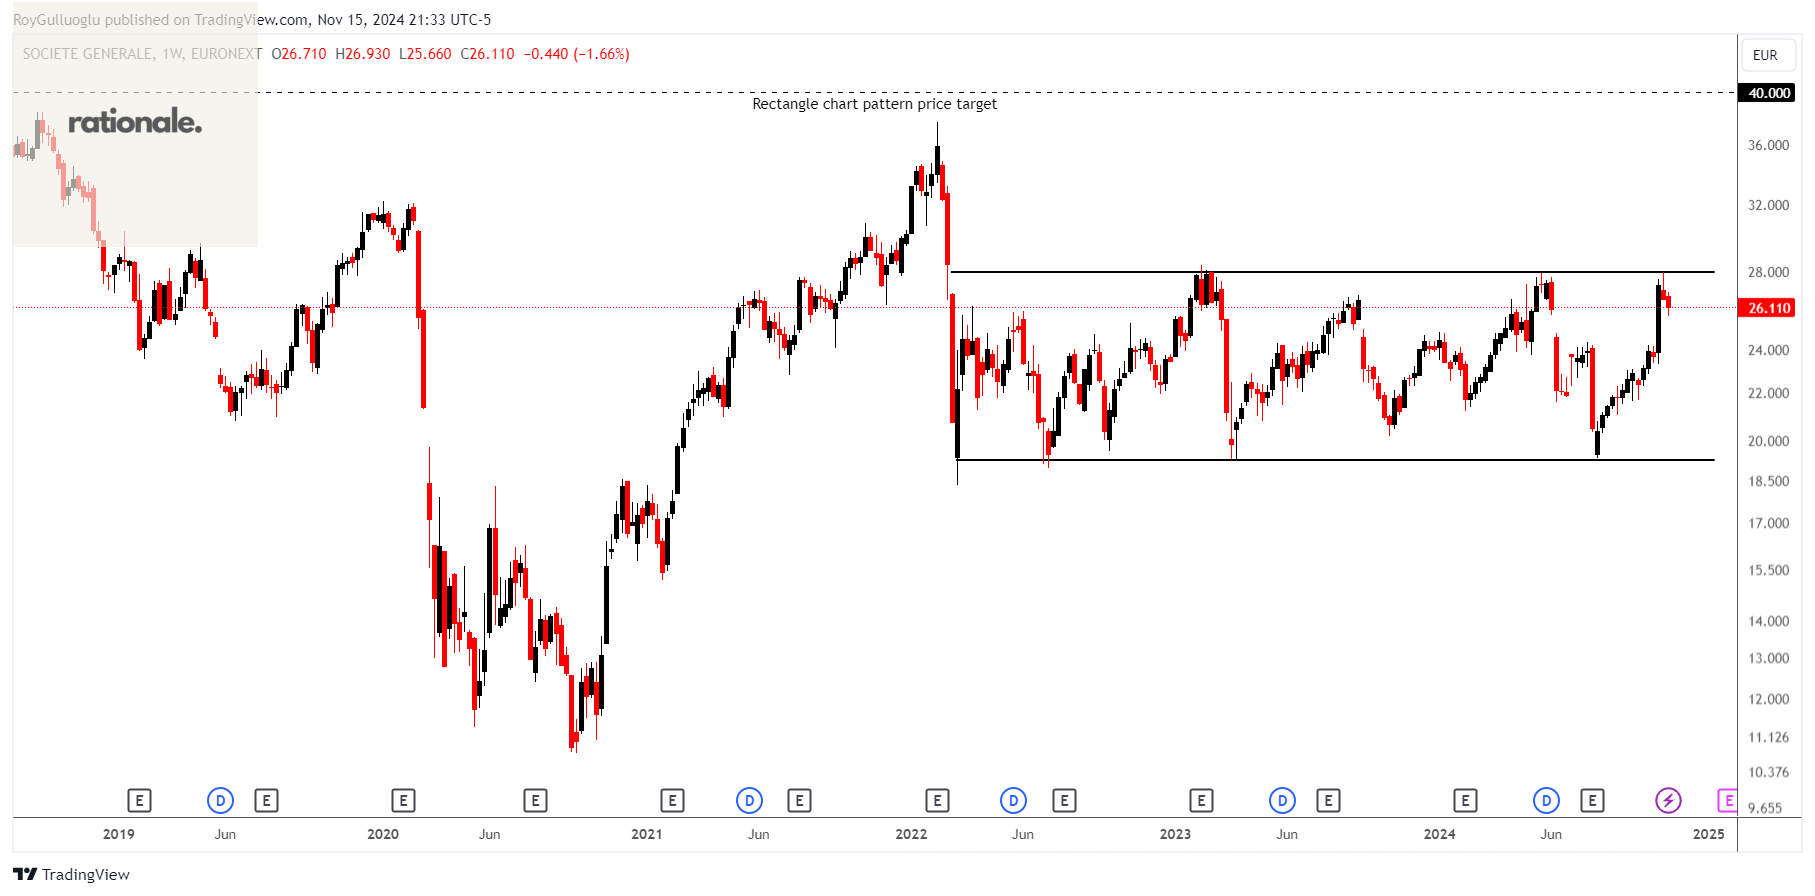
Société Générale Société anonyme provides banking and financial services to individuals, corporates, and institutional clients in Europe and internationally.
The above weekly chart formed an approximately 35-month-long ascending triangle chart pattern as a bullish reversal after a downtrend.
The horizontal boundary at 28 levels acts as a resistance within this pattern.
A daily close above 28.8 levels would validate the breakout from the 35-month-long ascending triangle chart pattern.
Based on this chart pattern, the potential price target is 40 levels.
GLE, classified under the "financial services" sector, falls under the “Large Cap - Income” stock category.
Türkiye Sigorta A.S.-(TURSG/BIST)-Long Idea
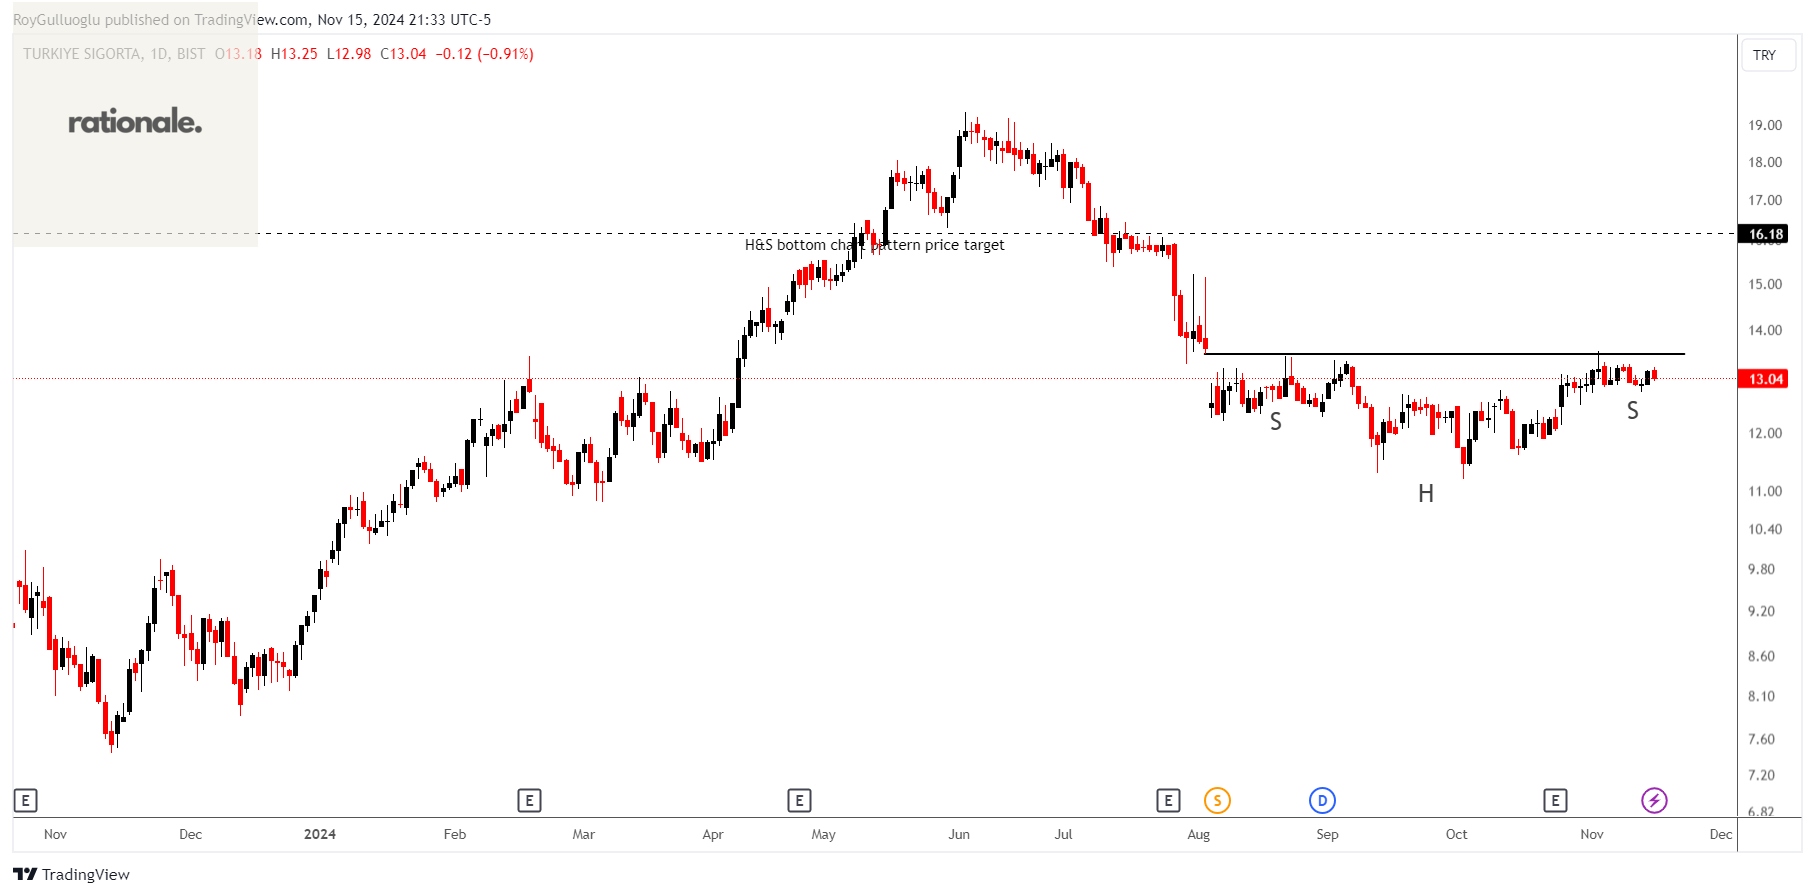
Türkiye Sigorta A.S. operates as a non-life insurance company in Turkey. The company offers auto and non-auto accident, fire, transportation, engineering, health, agriculture, liabilities, financial losses, loan, and legal protection insurance products.
The above daily chart formed an approximately 2-month-long H&S bottom chart pattern as a bullish reversal after a downtrend.
The horizontal boundary at 13.50 levels acted as a resistance within this pattern.
A daily close above 13.90 levels validated the breakout from the 3-month-long H&S bottom chart pattern.
Based on this chart pattern, the potential price target is 16.18 levels.
TURSG, classified under the "financial services" sector, falls under the “Small Cap - Income” stock category.
Netcompany Group A/S-(NETC/OMXCOP)-Long Idea
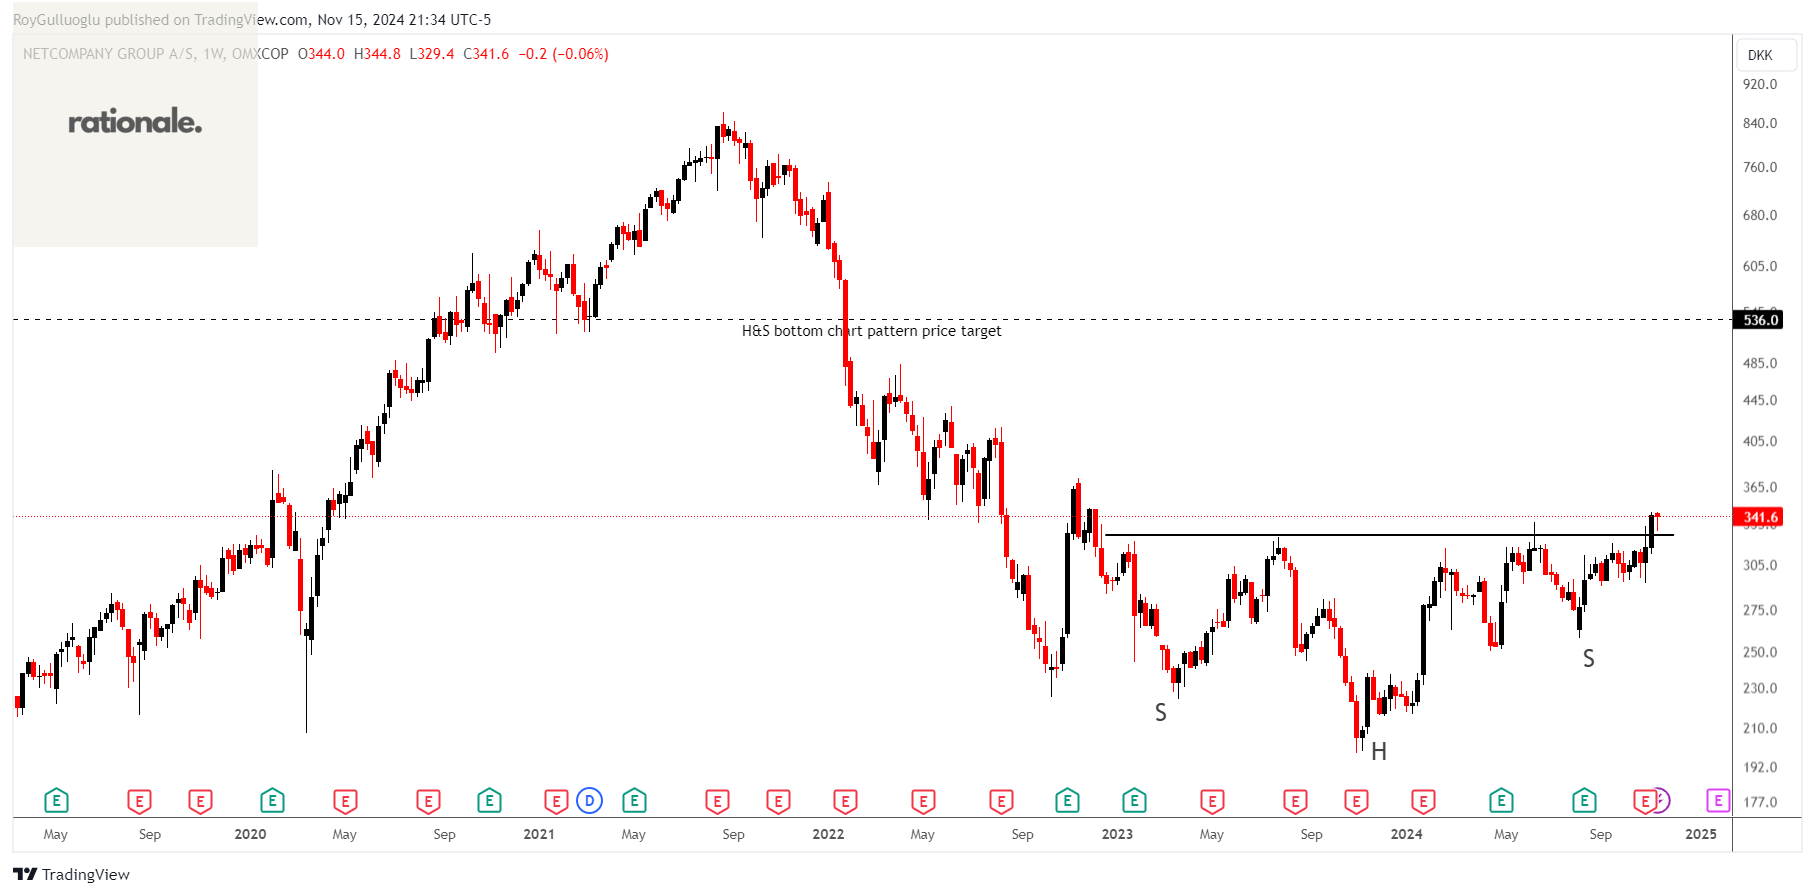
Netcompany Group A/S, an IT services company, delivers business critical IT solutions to public and private sector customers in Denmark, Norway, the United Kingdom, the Netherlands, Belgium, Luxembourg, Greece, and internationally.
The above weekly chart formed an approximately 24-month-long H&S bottom chart pattern as a bullish reversal after a downtrend.
The horizontal boundary at 326.4 levels acted as a resistance within this pattern.
A daily close above 336.19 levels validated the breakout from the 24-month-long H&S bottom chart pattern.
Based on this chart pattern, the potential price target is 536 levels.
NETC, classified under the "technology" sector, falls under the “Large Cap - Growth” stock category.