

Trade Ideas Equities
PVH(NYSE), BH(NYSE), FTV(NYSE), YELP(NYSE), H(NYSE), BCPC(NASDAQ), ZENTEC(NSE), PETR3(BOVESPA), JBSS3(BOVESPA), DOCO(BIST)

PVH Corp.-(PVH/NYSE)-Long Idea
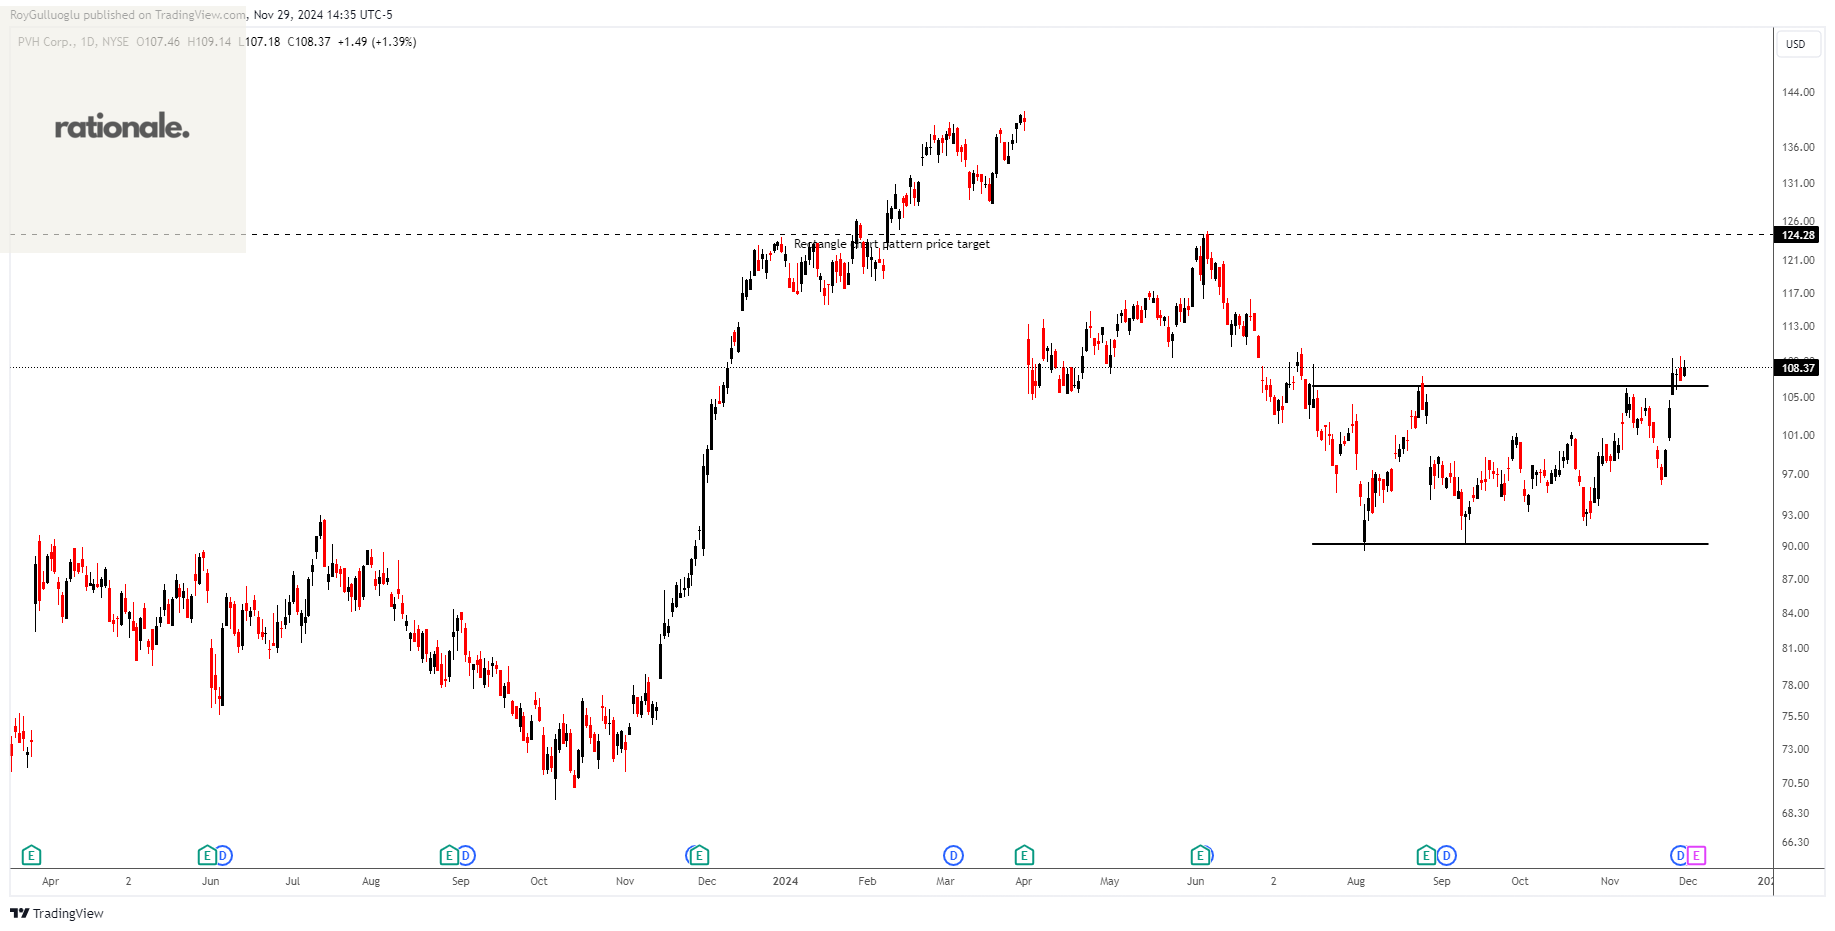
PVH Corp. operates as an apparel company in the United States and internationally. The company operates through Tommy Hilfiger North America, Tommy Hilfiger International, Calvin Klein North America, Calvin Klein International, and Heritage Brands Wholesale segments.
The above daily chart formed an approximately 3-month-long rectangle chart pattern as a bullish reversal after a downtrend.
The horizontal boundary at 106.2 levels acts as a resistance within this pattern.
A daily close above 109.4 levels would validate the breakout from the 3-month-long rectangle chart pattern.
Based on this chart pattern, the potential price target is 124.28 levels.
PVH, classified under the "consumer cyclical" sector, falls under the “Mid Cap - Growth” stock category.
Biglari Holdings Inc.-(BH/NYSE)-Long Idea
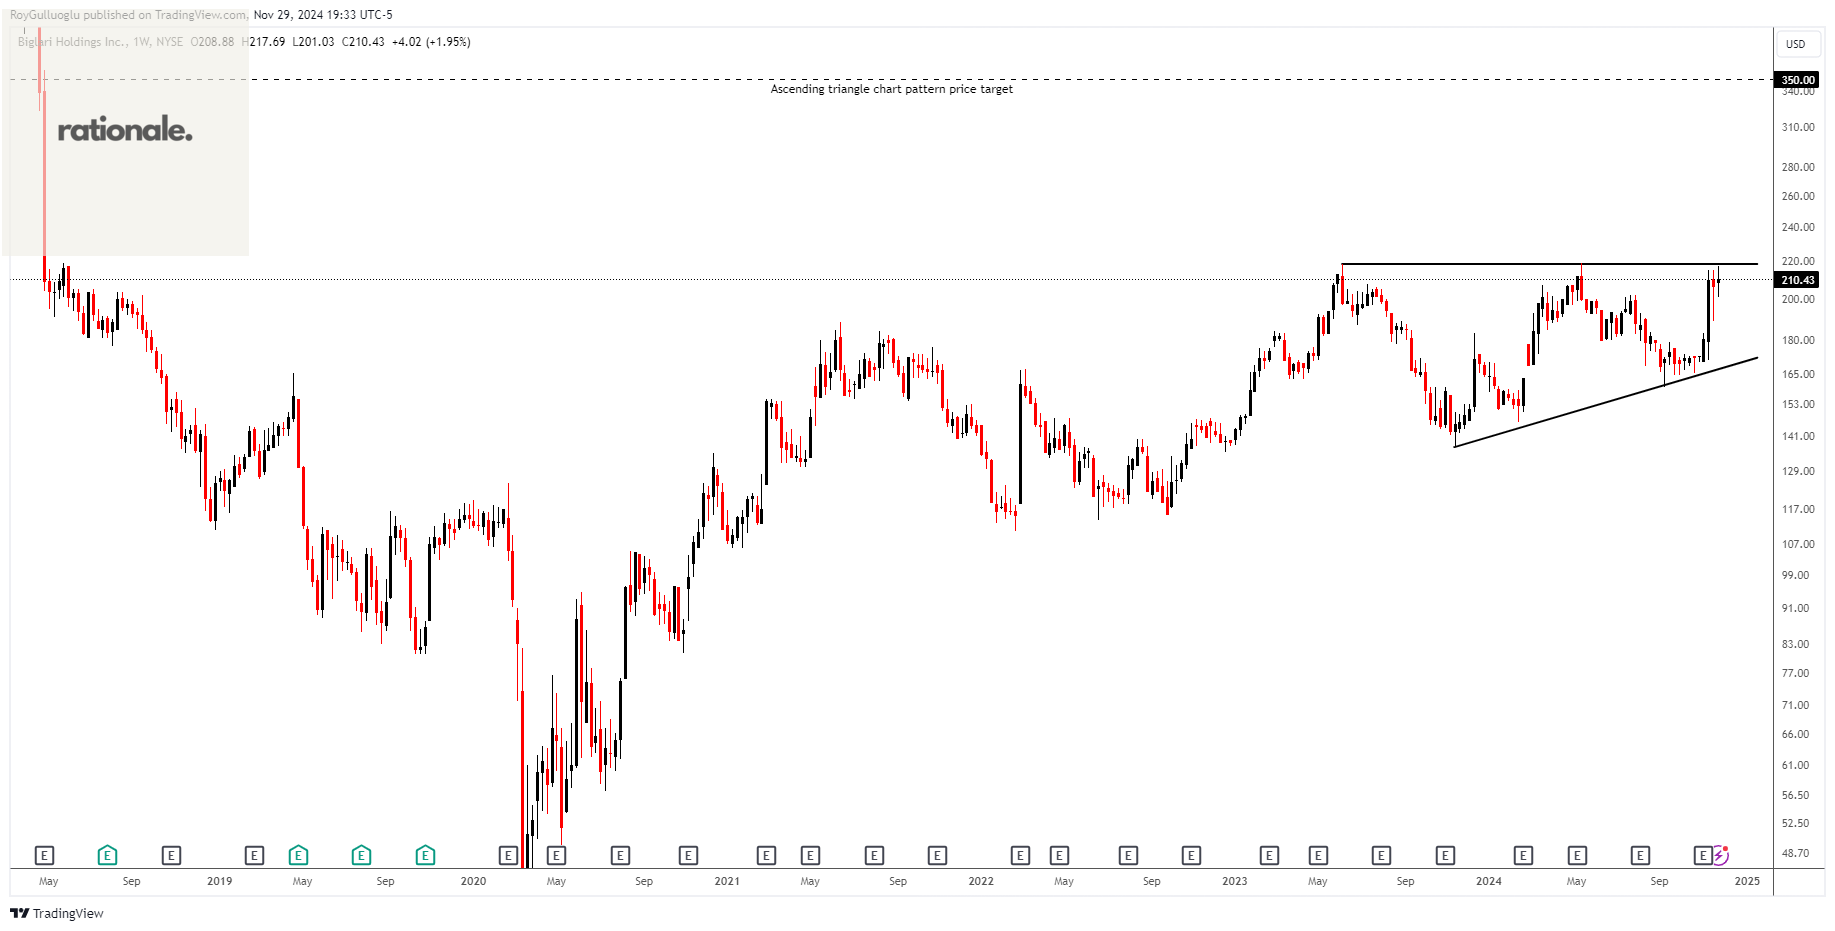
Biglari Holdings Inc., through its subsidiaries, primarily operates and franchises restaurants in the United States.
The above weekly chart formed an approximately 20-month-long ascending triangle chart pattern as a bullish continuation after an uptrend.
The horizontal boundary at 218.5 levels acts as a resistance within this pattern.
A daily close above 225 levels would validate the breakout from the 20-month-long ascending triangle chart pattern.
Based on this chart pattern, the potential price target is 350 levels.
BH, classified under the "consumer cyclical" sector, falls under the “Small Cap - Growth” stock category.
Fortive Corporation-(FTV/NYSE)-Long Idea
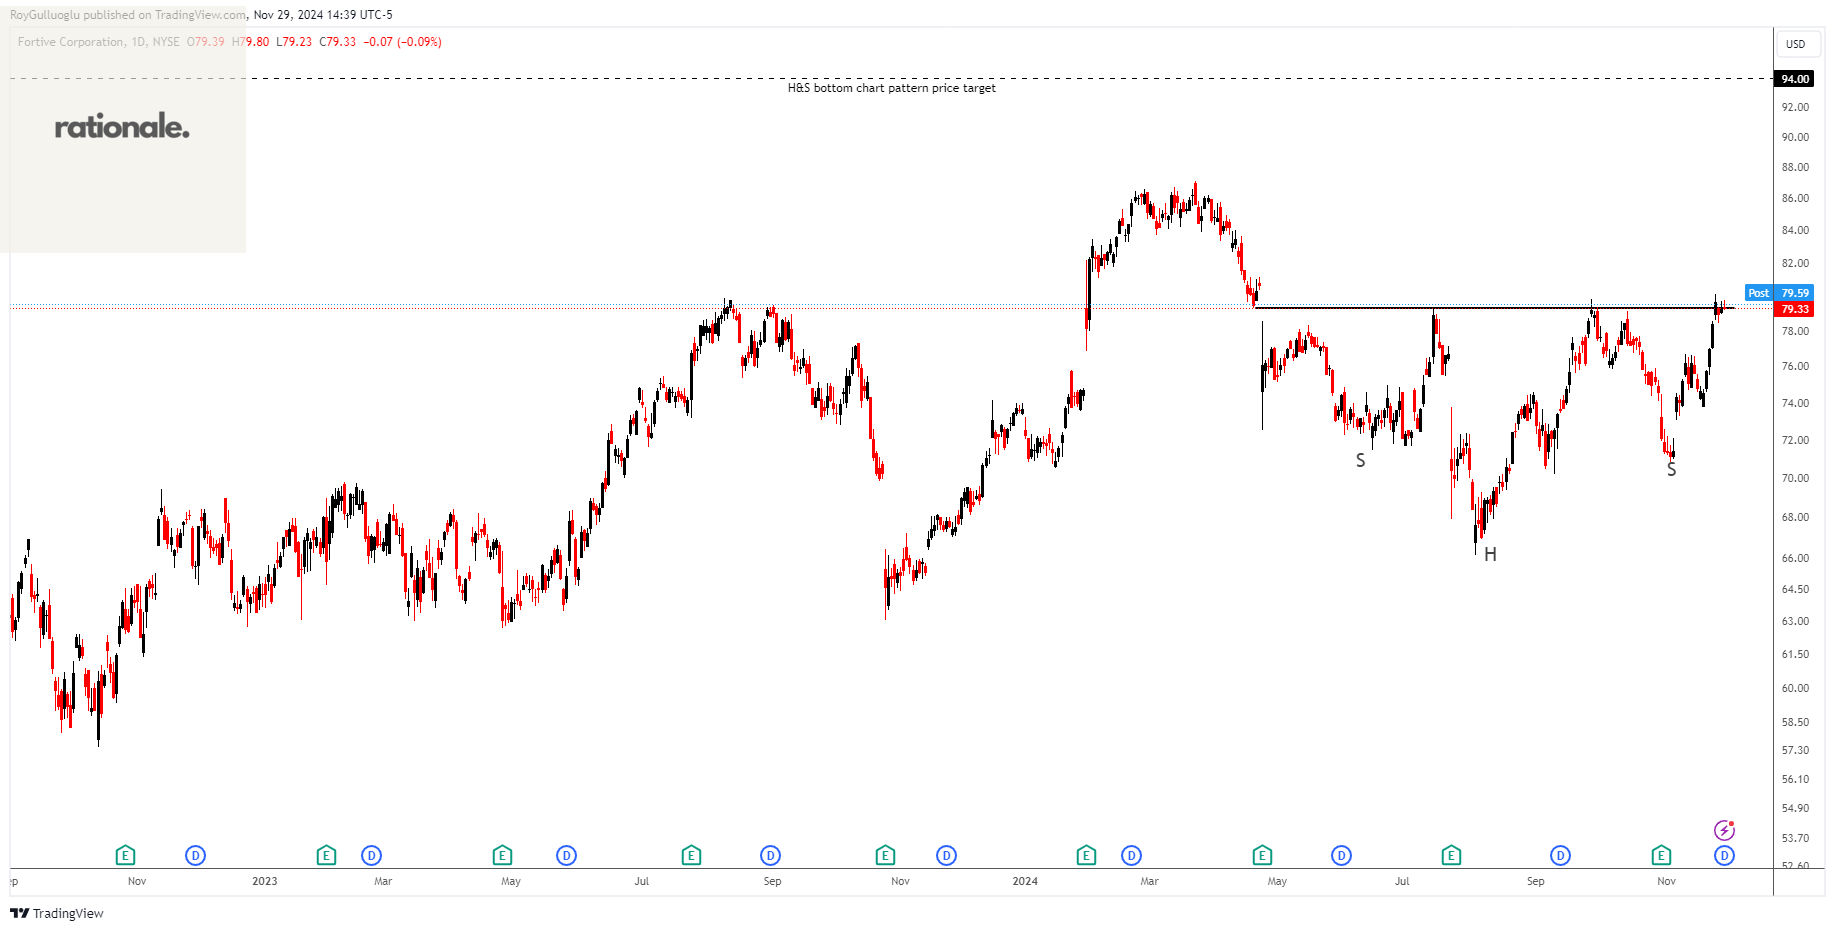
Fortive Corporation designs, develops, manufactures, and services professional and engineered products, software, and services in the United States, China, and internationally.
The above daily chart formed an approximately 5-month-long H&S bottom chart pattern as a bullish reversal after a downtrend.
The horizontal boundary at 79.36 levels acts as a resistance within this pattern.
A daily close above 81.74 levels would validate the breakout from the 5-month-long H&S bottom chart pattern.
Based on this chart pattern, the potential price target is 94 levels.
FTV, classified under the "technology" sector, falls under the “Large Cap - Growth” stock category.
Yelp Inc.-(YELP/NYSE)-Long Idea
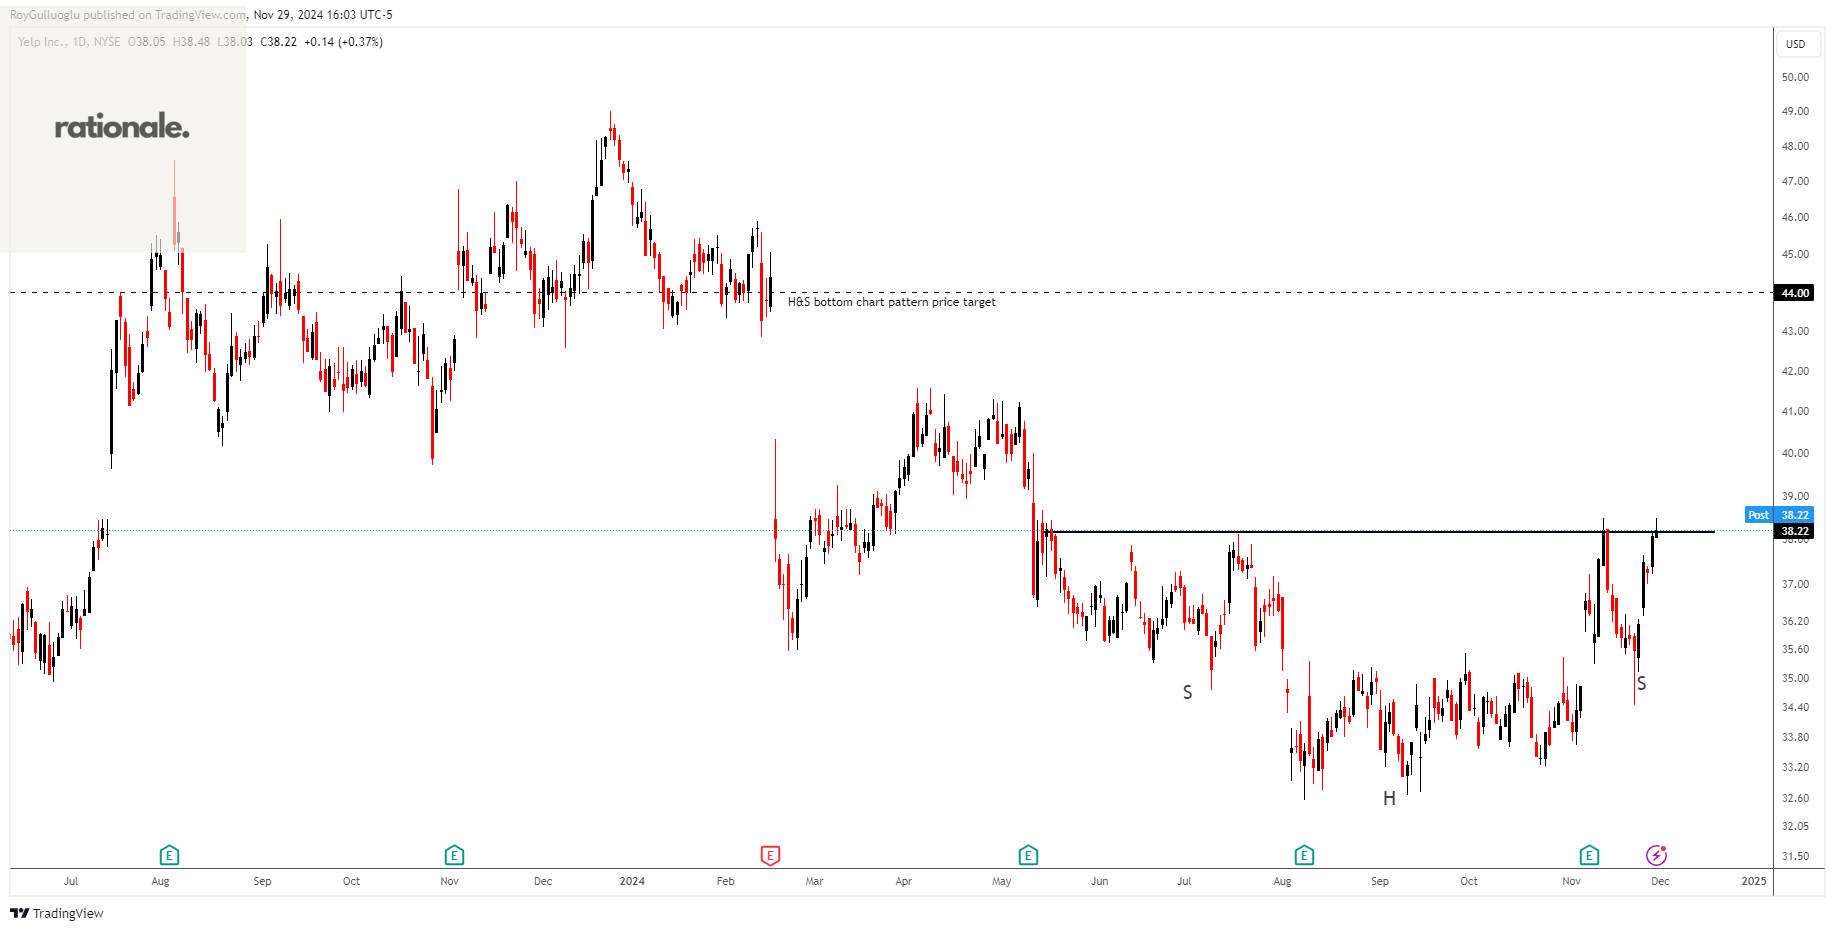
Yelp Inc. operates a platform that connects consumers with local businesses in the United States and internationally.
The above daily chart formed an approximately 5-month-long H&S bottom chart pattern as a bullish reversal after a downtrend.
The horizontal boundary at 38.17 levels acts as a resistance within this pattern.
A daily close above 39.31 levels would validate the breakout from the 5-month-long H&S bottom chart pattern.
Based on this chart pattern, the potential price target is 44 levels.
YELP, classified under the "communication services" sector, falls under the “Mid Cap - Growth” stock category.
Hyatt Hotels Corporation.-(H/NYSE)-Long Idea
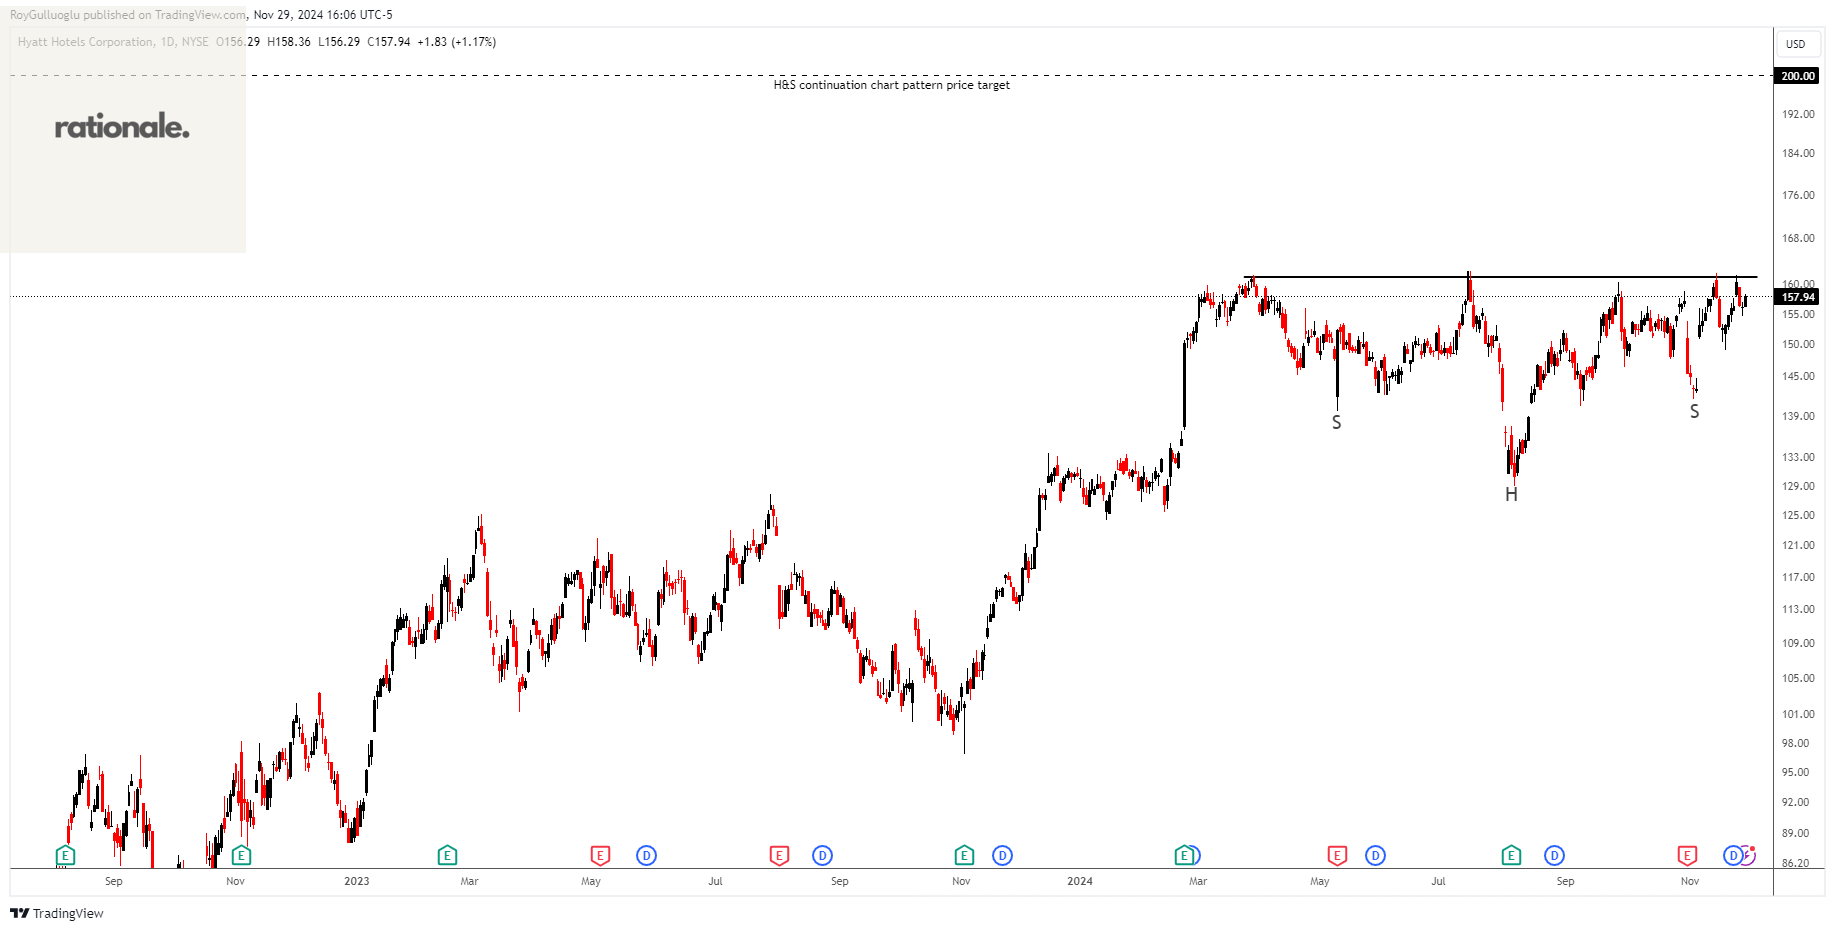
Hyatt Hotels Corporation operates as a hospitality company in the United States and internationally.
The above daily chart formed an approximately 6-month-long H&S continuation chart pattern as a bullish continuation after an uptrend.
The horizontal boundary at 161.3 levels acts as a resistance within this pattern.
A daily close above 166.14 levels would validate the breakout from the 6-month-long H&S continuation chart pattern.
Based on this chart pattern, the potential price target is 200 levels.
H, classified under the "consumer cyclicals" sector, falls under the “Large Cap - Growth” stock category.
Balchem Corporation -(BCPC/NASDAQ)-Long Idea
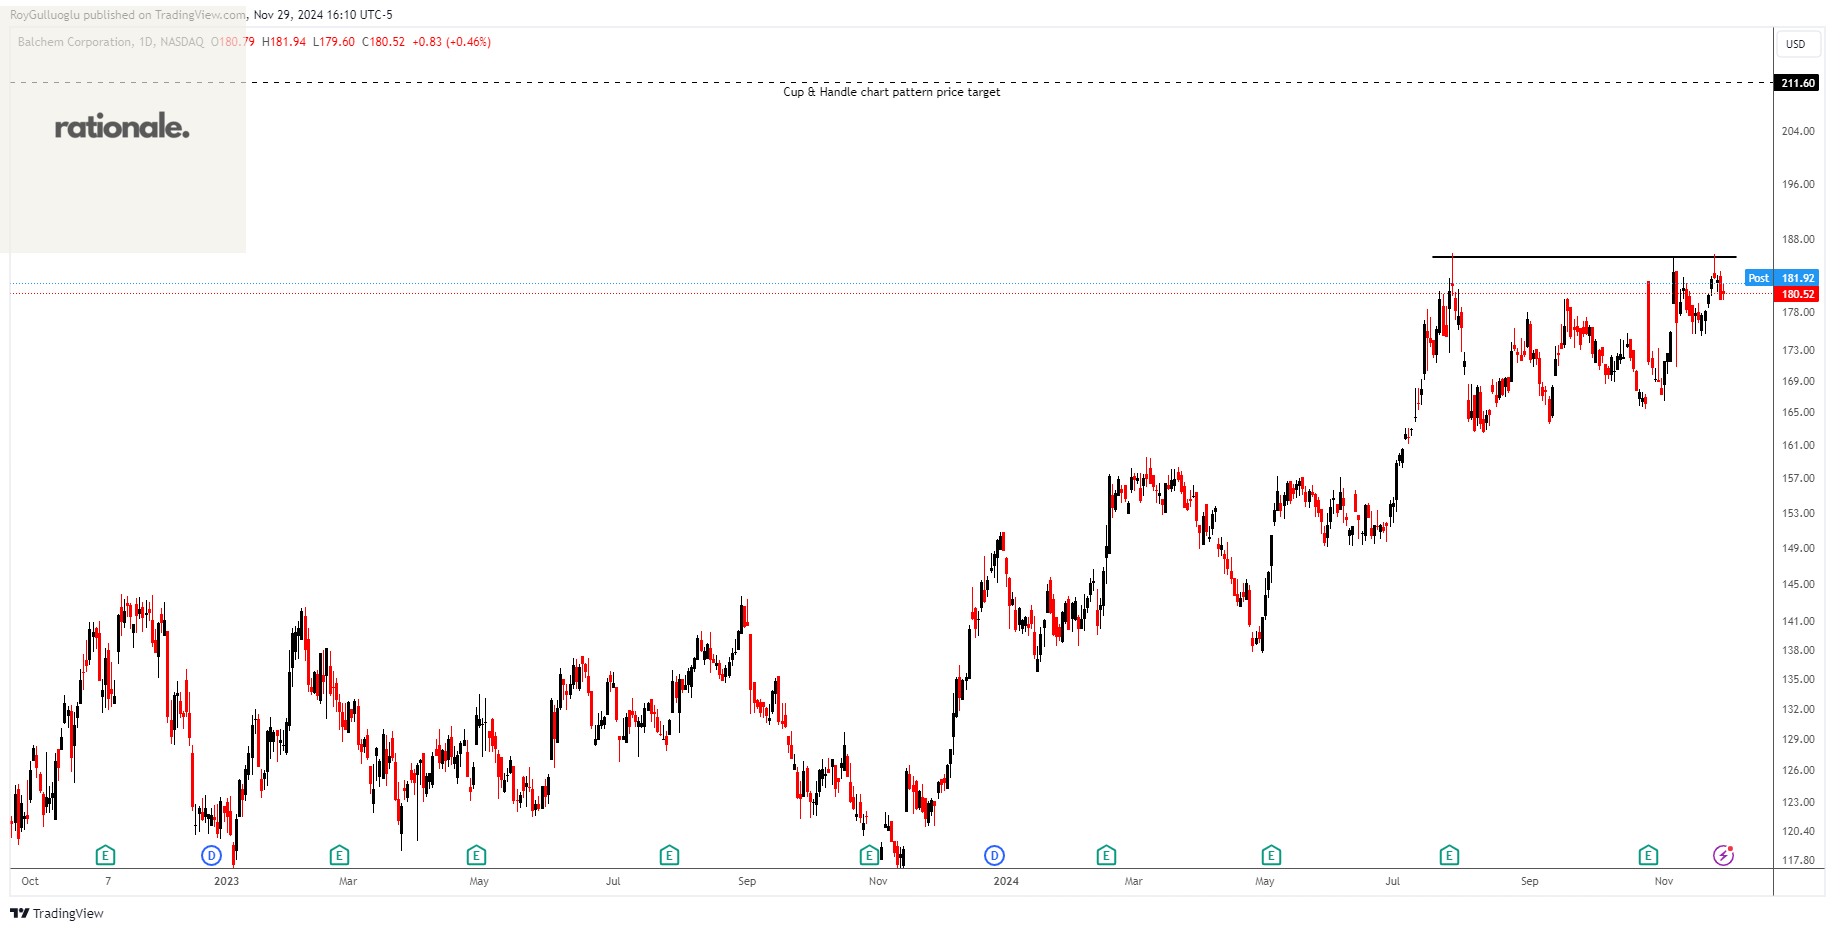
Balchem Corporation develops, manufactures, and markets specialty performance ingredients and products for the nutritional, food, pharmaceutical, animal health, medical device sterilization, plant nutrition, and industrial markets worldwide.
The above daily chart formed an approximately 3-month-long cup & handle chart pattern as a bullish continuation after an uptrend.
The horizontal boundary at 185.49 levels acts as a resistance within this pattern.
A daily close above 191 levels would validate the breakout from the 3-month-long cup & handle chart pattern.
Based on this chart pattern, the potential price target is 211.6 levels.
BCPC, classified under the "basic materials" sector, falls under the “Mid Cap - Value” stock category.
Zen Technologies Limited-(ZENTEC/NSE)-Long Idea
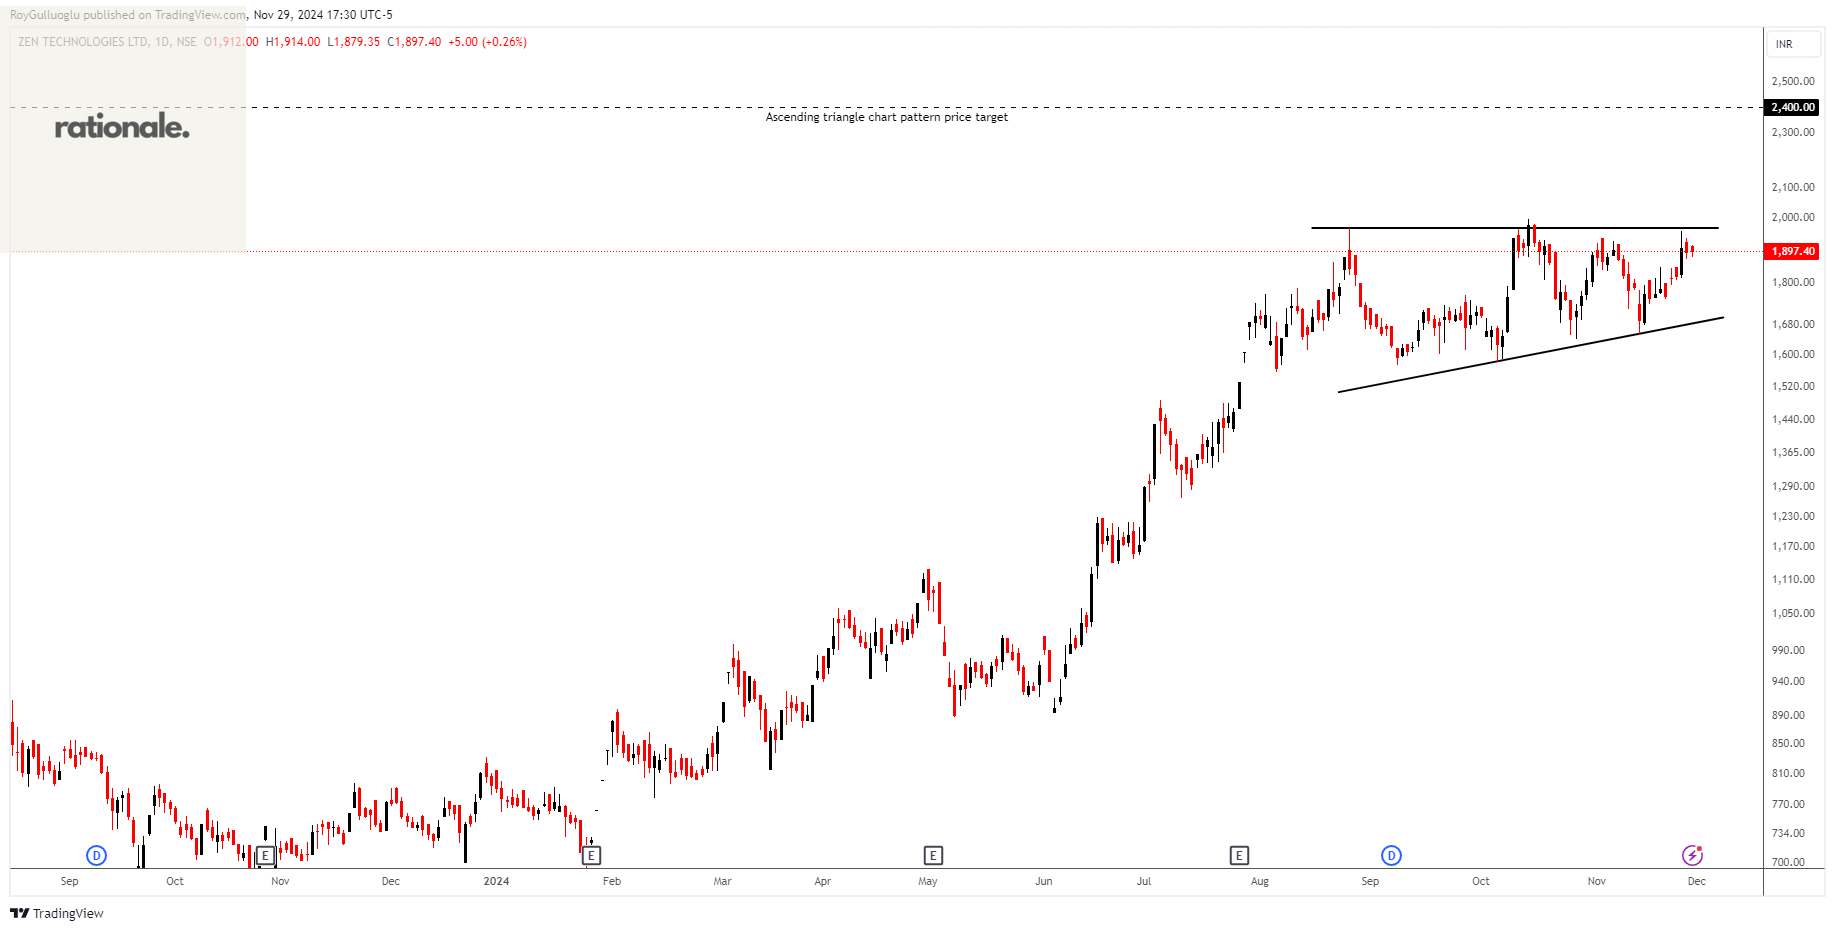
Zen Technologies Limited, together with its subsidiary, designs, develops, manufactures, and sells training simulators in India and internationally.
The above daily chart formed an approximately 2-month-long ascending triangle chart pattern as a bullish continuation after an uptrend.
The horizontal boundary at 1970 levels acts as a resistance within this pattern.
A daily close above 2029 levels would validate the breakout from the 2-month-long ascending triangle chart pattern.
Based on this chart pattern, the potential price target is 2400 levels.
ZENTEC, classified under the "industrials" sector, falls under the “Mid Cap - Value” stock category.
Petrobras-(PETR3/BOVESPA)-Long Idea
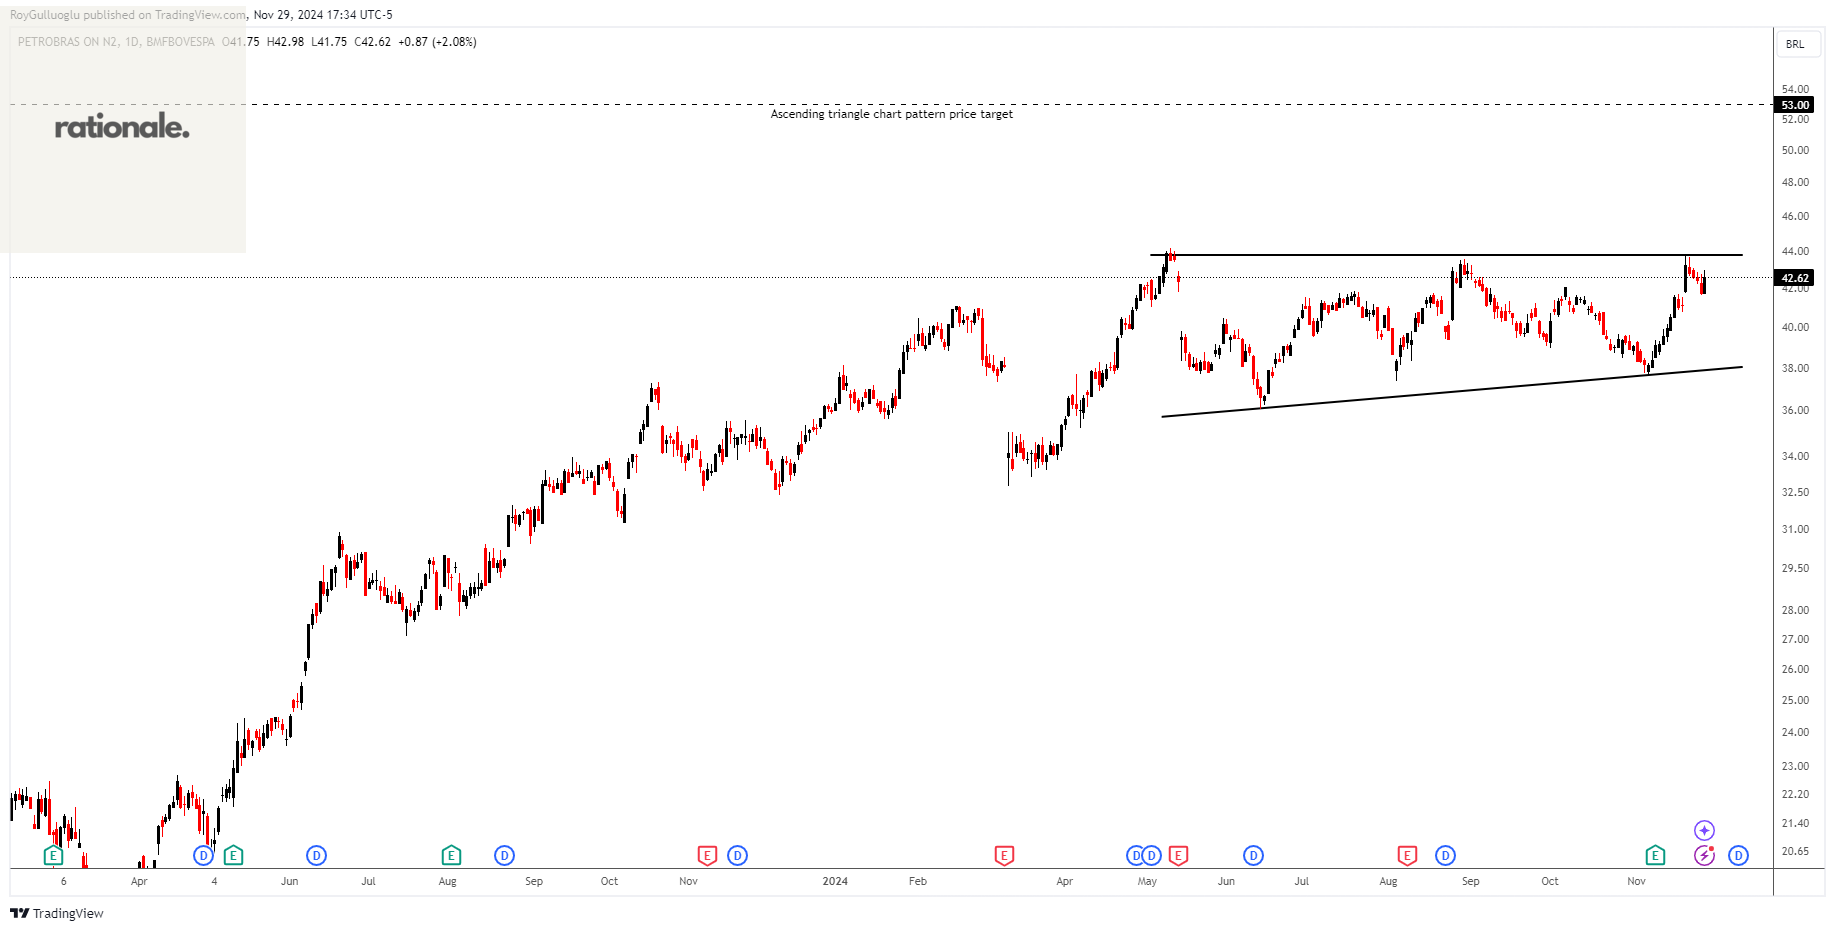
Petróleo Brasileiro S.A. - Petrobras explores, produces, and sells oil and gas in Brazil and internationally.
The above daily chart formed an approximately 5-month-long ascending triangle chart pattern as a bullish continuation after an uptrend.
The horizontal boundary at 43.8 levels acts as a resistance within this pattern.
A daily close above 45.11 levels would validate the breakout from the 5-month-long ascending triangle chart pattern.
Based on this chart pattern, the potential price target is 53 levels.
PETR3, classified under the "energy" sector, falls under the “Large Cap - Income” stock category.
JBS S.A.-(JBSS3/BOVESPA)-Long Idea
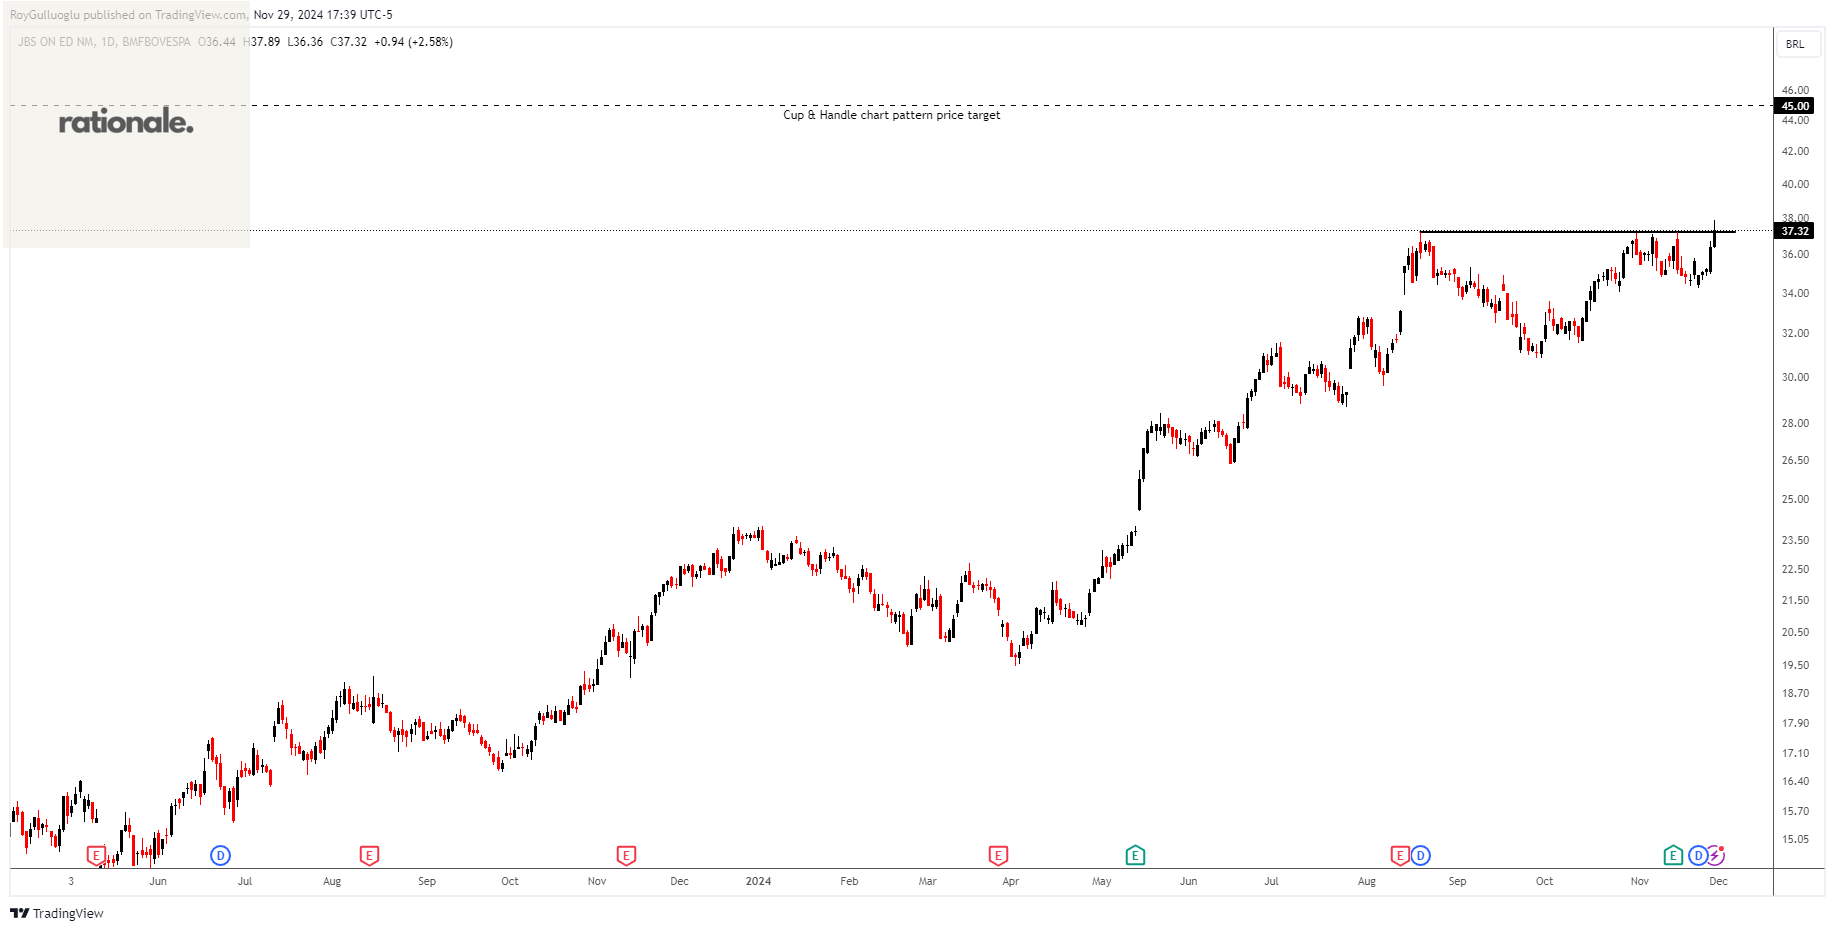
JBS S.A., together with its subsidiaries, engages in the processing of animal protein worldwide. The company trades in beef, pork, chicken, poultry, fish, and lamb products; cooked frozen meat; plant based products; and other food products.
The above daily chart formed an approximately 2-month-long cup & handle chart pattern as a bullish continuation after an uptrend.
The horizontal boundary at 37.23 levels acts as a resistance within this pattern.
A daily close above 38.35 levels would validate the breakout from the 2-month-long cup & handle chart pattern.
Based on this chart pattern, the potential price target is 45 levels.
DO & CO Aktiengesellschaft-(DOCO/BIST)-Long Idea
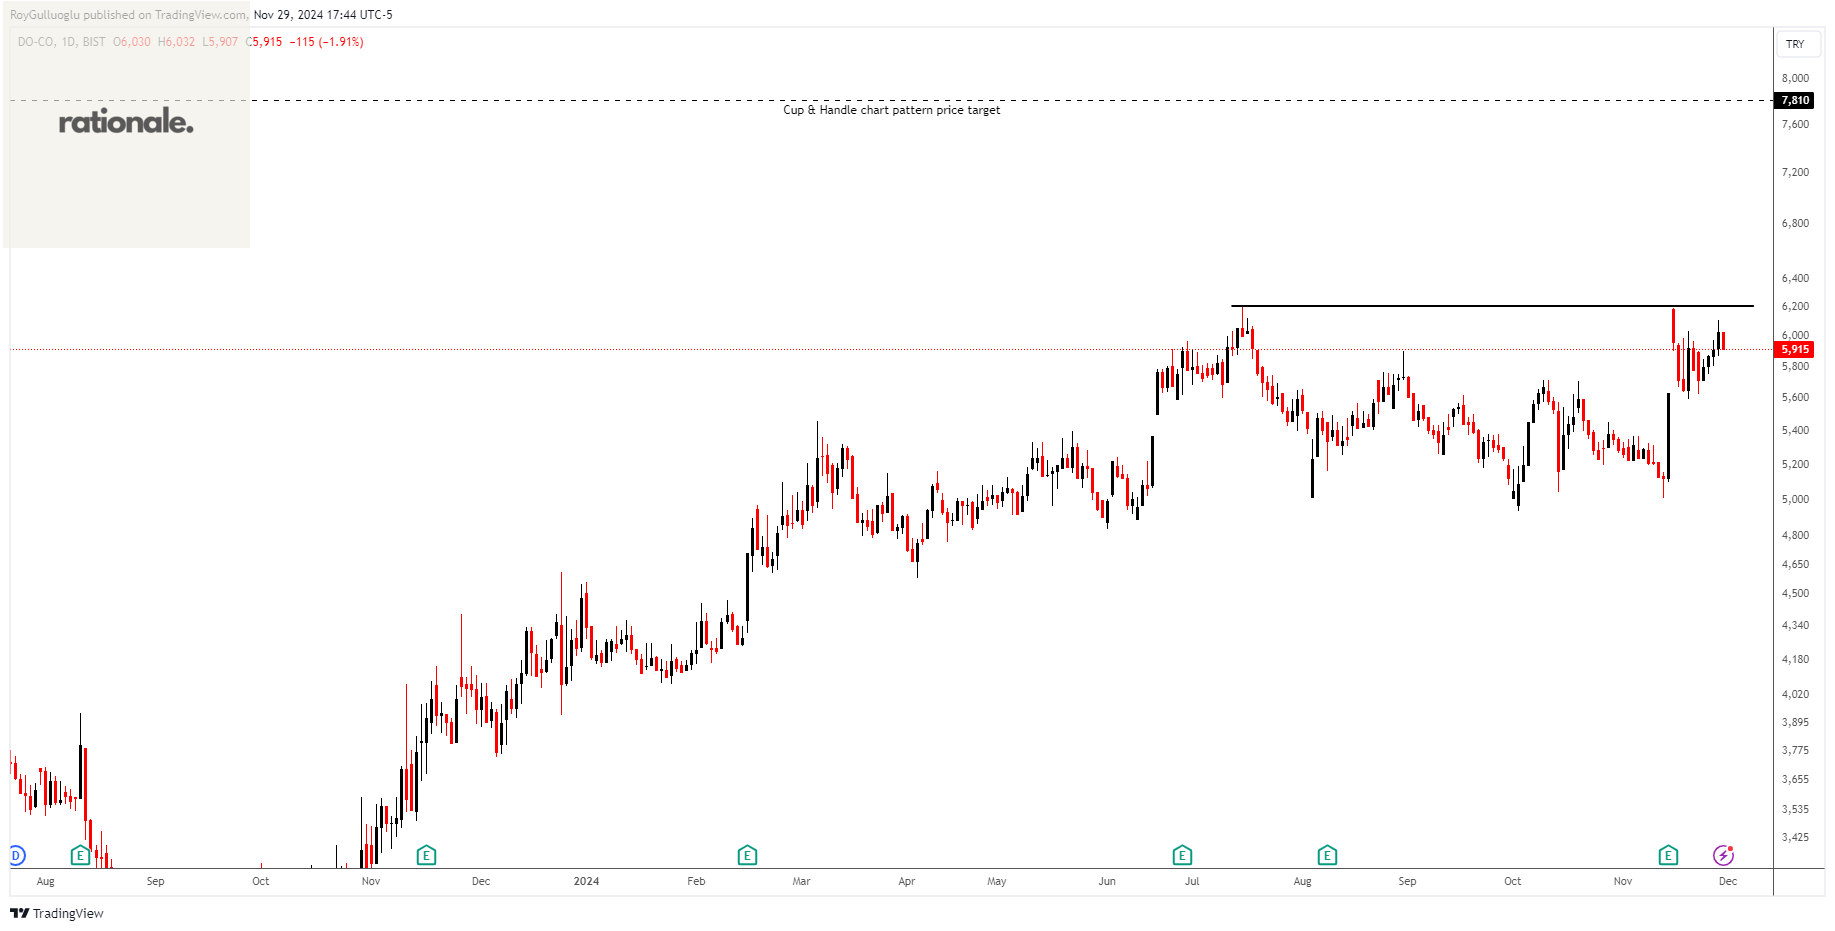
DO & CO Aktiengesellschaft provides catering services in Austria, Turkey, Great Britain, the United States, Spain, Germany, and internationally.
The above daily chart formed an approximately 3-month-long cup & handle chart pattern as a bullish continuation after an uptrend.
The horizontal boundary at 6210 levels acts as a resistance within this pattern.
A daily close above 6396 levels would validate the breakout from the 3-month-long cup & handle chart pattern.
Based on this chart pattern, the potential price target is 7810 levels.
DOCO, classified under the "industrials" sector, falls under the “Small Cap - Value” stock category.