

Trade Ideas Fx-Futures-Etf-Crypto
MANAUSDT, BATUSDT, LTCUSDT, EURGBP, ARKG(ARCA)

MANAUSDT-Long Idea
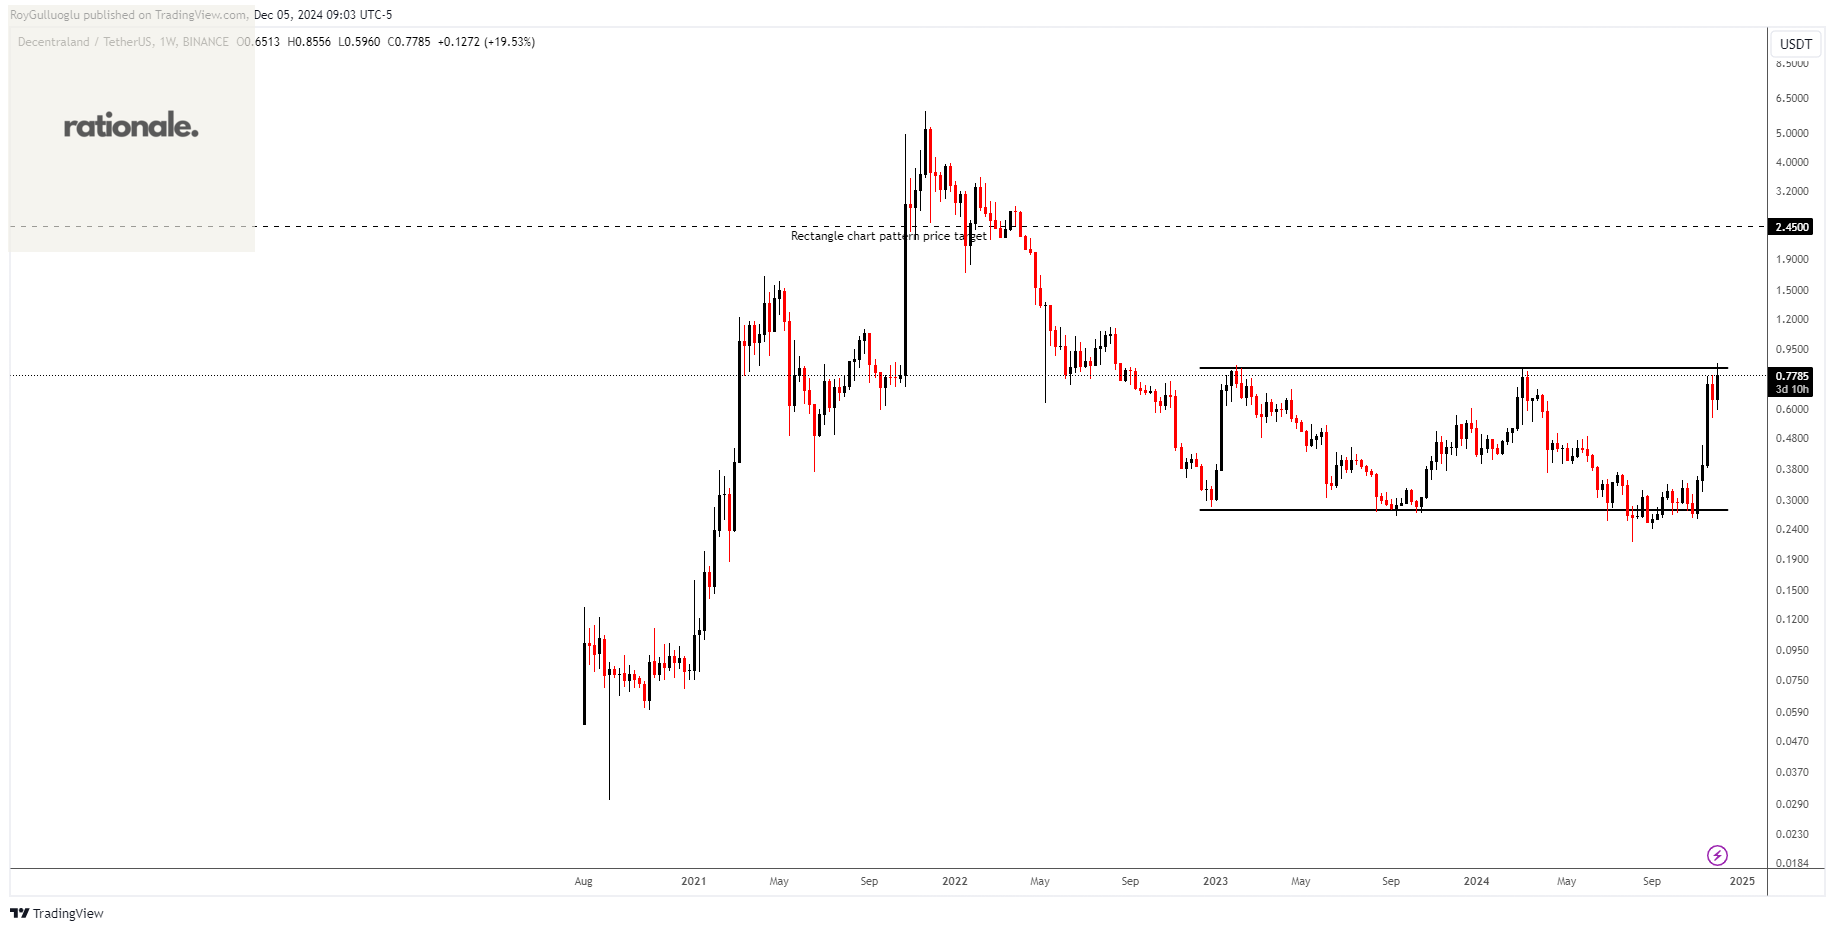
The above daily chart formed an approximately 25-month-long rectangle chart pattern as a bullish reversal after a downtrend.
The horizontal boundary at 0.82 levels acts as a resistance within this pattern.
A daily close above 0.845 levels would validate the breakout from the 25-month-long rectangle chart pattern.
Based on this chart pattern, the potential price target is approximately 2.45 levels.
BATUSDT-Long Idea
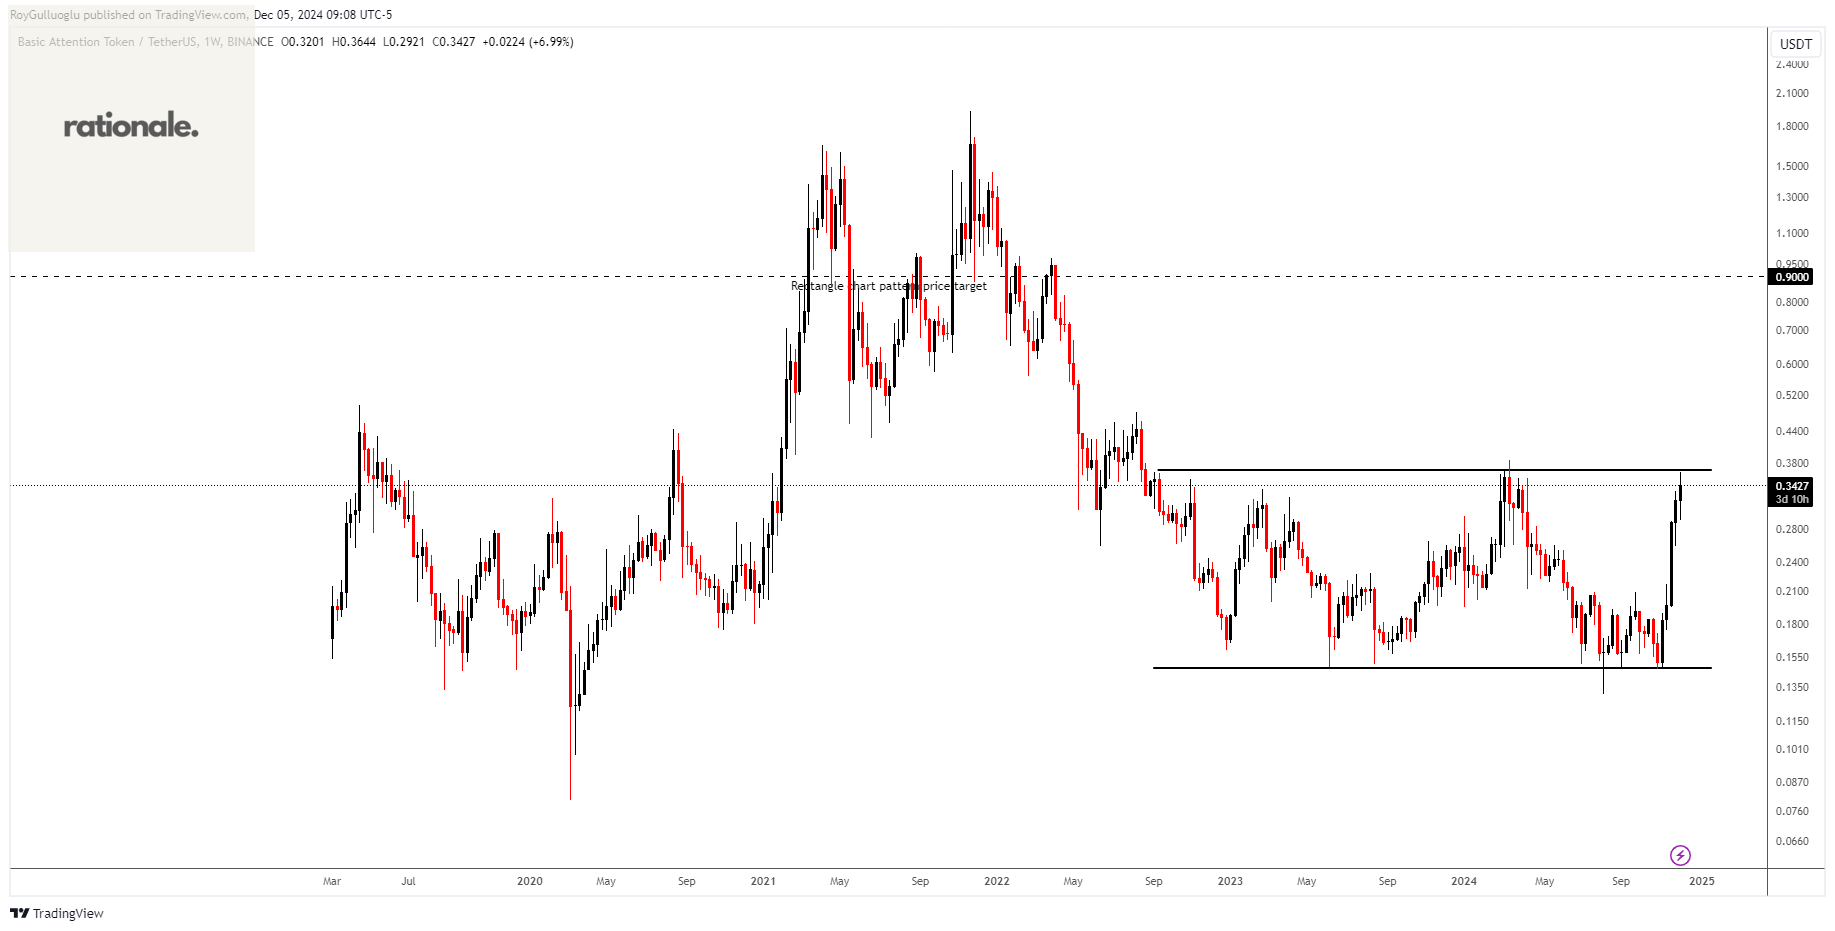
The above daily chart formed an approximately 29-month-long rectangle chart pattern as a bullish reversal after a downtrend.
The horizontal boundary at 0.367 levels acts as a resistance within this pattern.
A daily close above 0.378 levels would validate the breakout from the 29-month-long rectangle chart pattern.
Based on this chart pattern, the potential price target is approximately 0.9 levels.
LTCUSDT-Long Idea
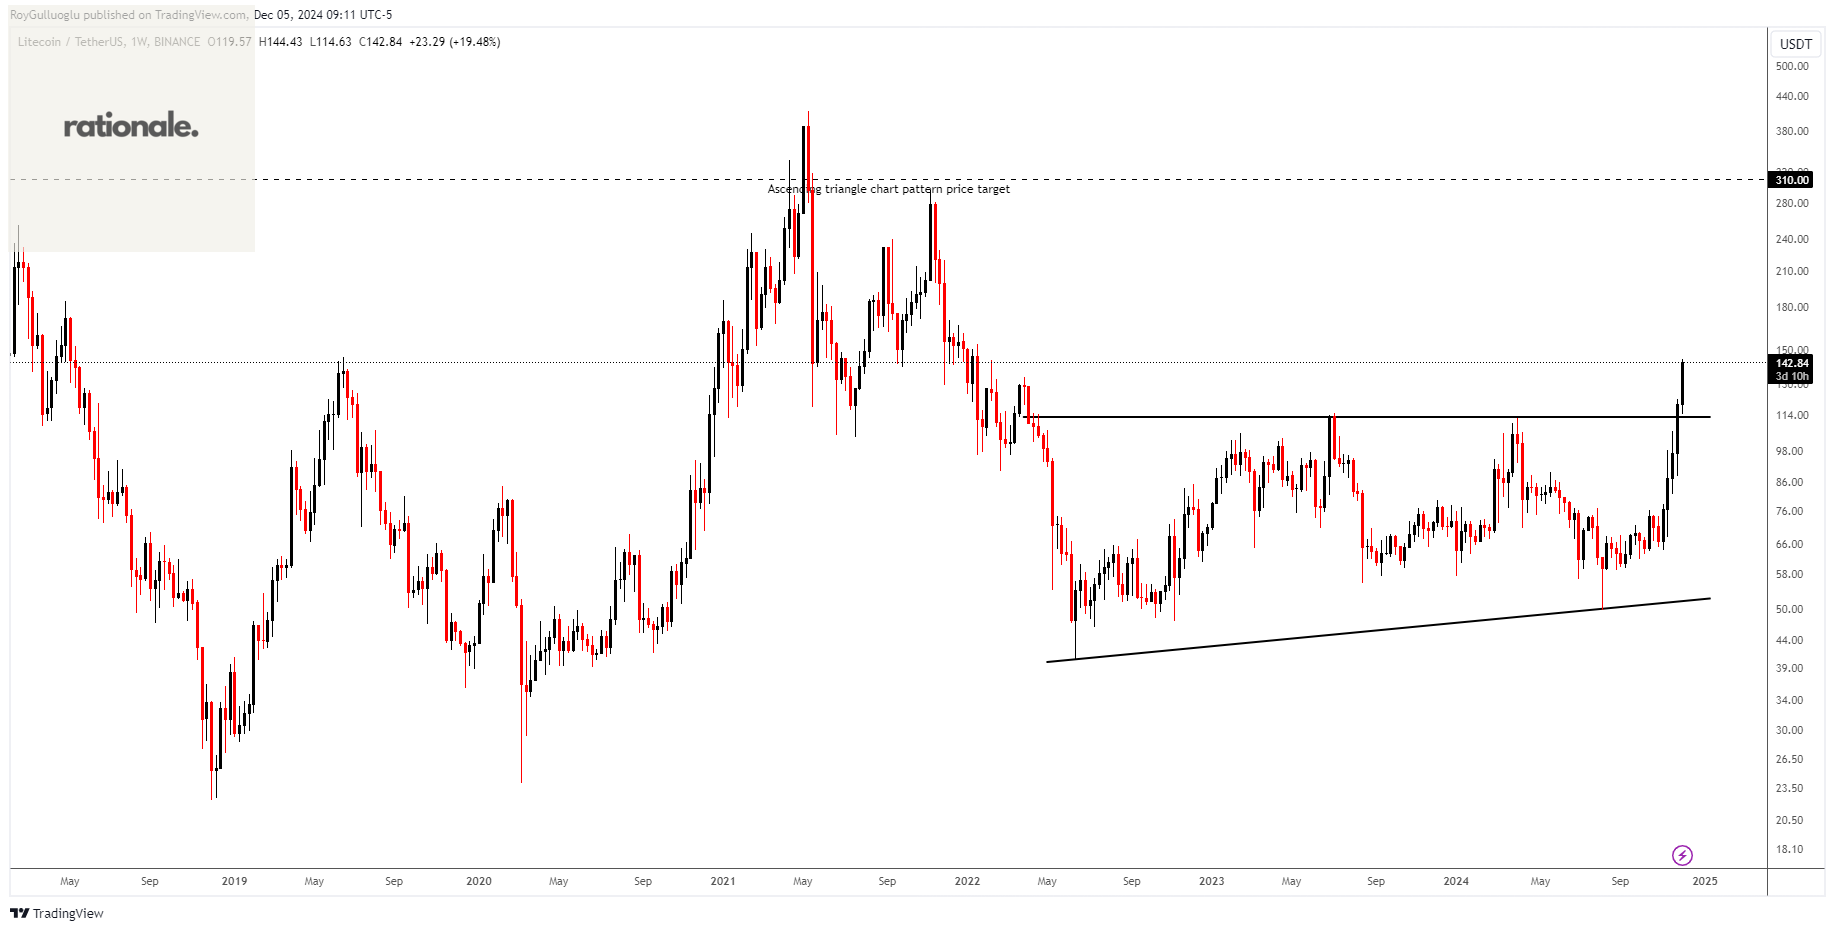
The above daily chart formed an approximately 30-month-long ascending triangle chart pattern as a bullish reversal after a downtrend.
The horizontal boundary at 113 levels acted as a resistance within this pattern.
A daily close above 116.4 levels validated the breakout from the 30-month-long ascending triangle chart pattern.
Based on this chart pattern, the potential price target is approximately 310 levels.
EURGBP-Short Idea
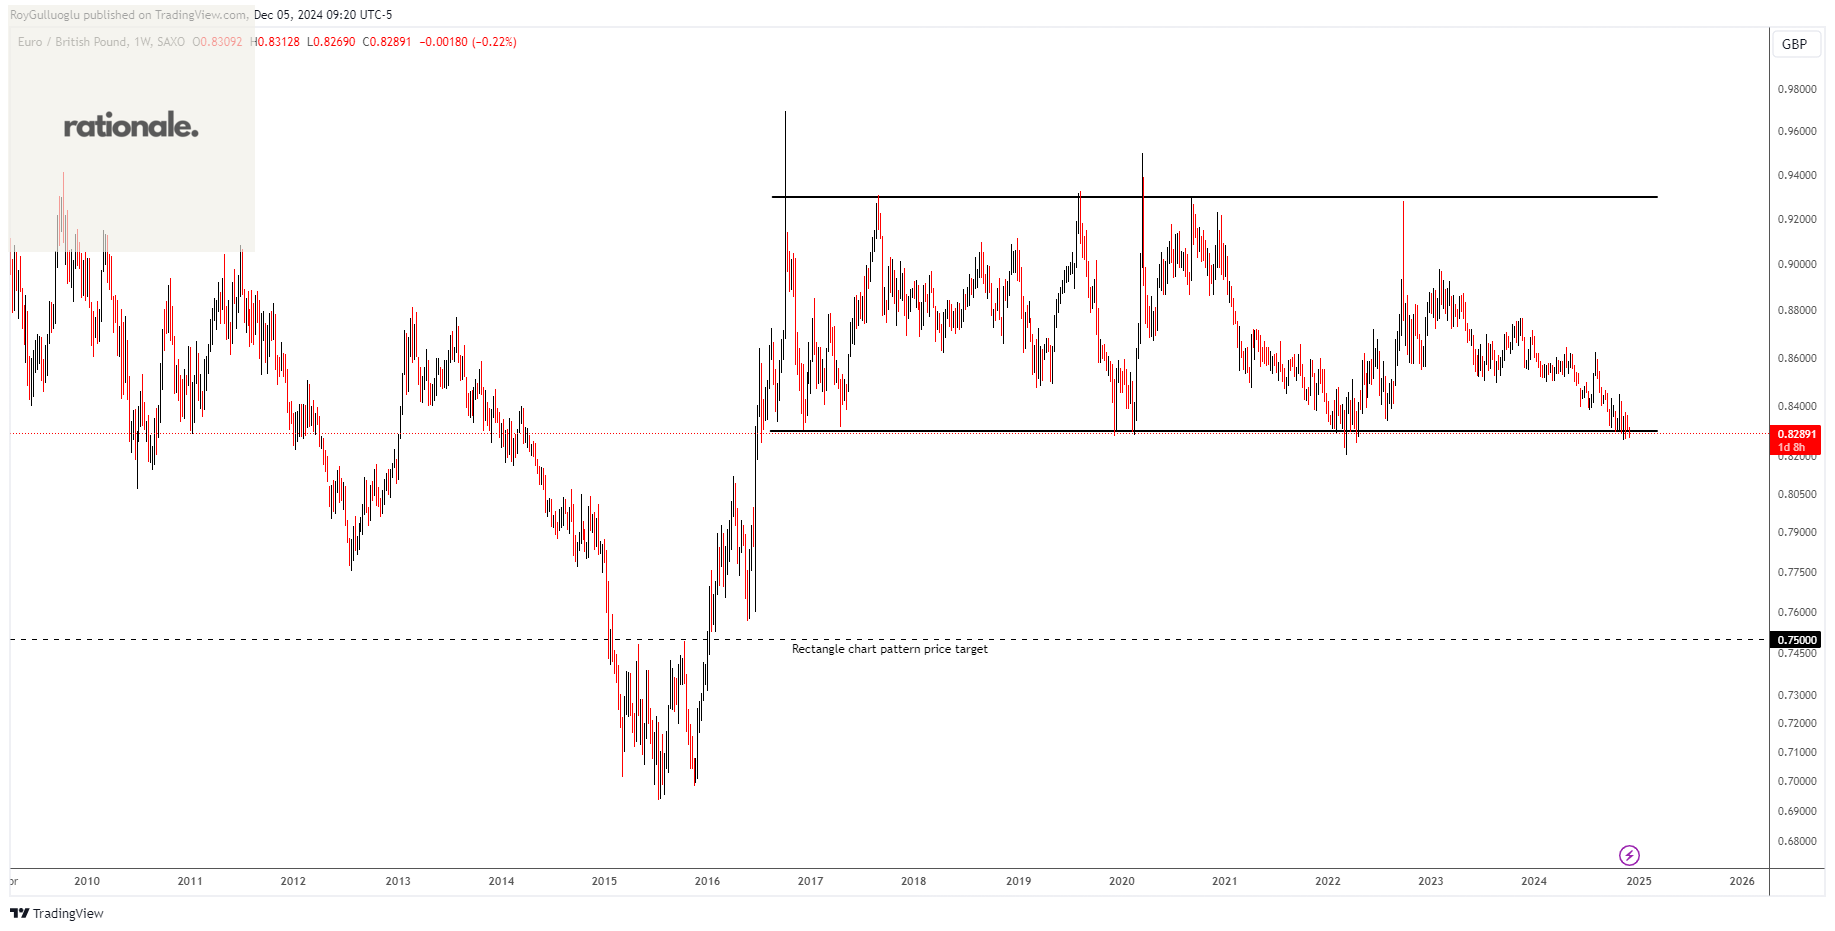
The above weekly chart formed an approximately 7-year-long rectangle chart pattern as a bullish continuation after an uptrend.
The horizontal boundary at 0.83 levels acts as a support within this pattern.
A daily close below 0.82 levels (%1 or %1.5 low of the support for FX, Futures) would validate the breakout from the 7-year-long rectangle chart pattern.
Based on this chart pattern, the potential price target is approximately 0.75 levels.
The UK’s post-Brexit outlook looks stronger compared to struggling Eurozone economies like France and Germany. The new UK Labour government’s 2025 budget plan avoids sharp income tax hikes and focuses on cutting unproductive spending, such as winter fuel subsidies for pensioners. By boosting investment in housing and manufacturing, raising public sector wages, and managing deficits strategically, the UK is set for solid growth, keeping Bank of England rates higher for longer.
In contrast, France faces budget problems and high taxes that hurt growth, while Germany is stuck in economic stagnation. Germany’s industrial base is struggling with high energy costs and weakening competitiveness in the auto sector, and the lack of investment in key areas makes recovery harder. Both countries need big changes to get back on track.
With the ECB possibly considering a surprise 50 bps rate cut to support the Eurozone, the growing gap between the UK and Eurozone economies supports a bearish outlook for EUR/GBP.
ARK Genomic Revolution ETF-(ARKG/ARCA)-Long Idea
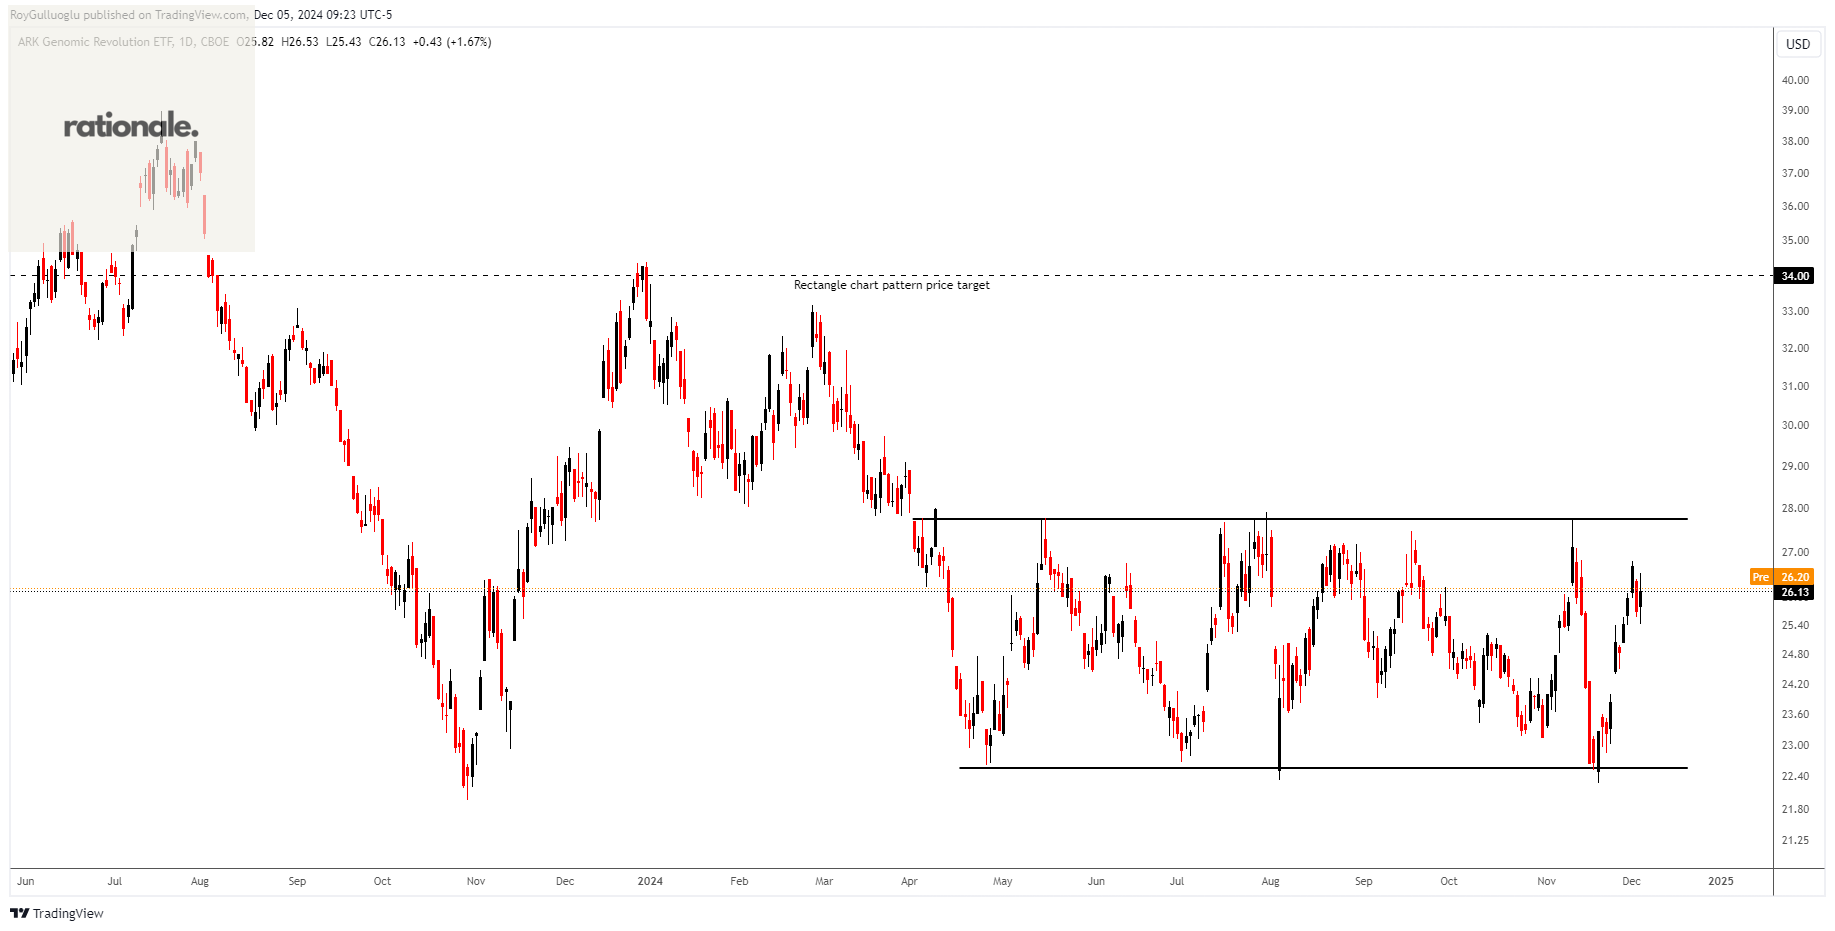
The fund is an actively managed ETF focused on the genomics revolution. It invests at least 80% of its assets in domestic and international equity securities from various sectors, including healthcare, technology, materials, energy, and consumer discretionary.
The above weekly chart formed an approximately 5-month-long rectangle chart pattern as a bullish reversal after a downtrend.
Within this pattern, the horizontal boundary at 27.75 levels acts as a resistance.
A daily close above 28.6 levels would validate the breakout from the 5-month-long rectangle chart pattern.
Based on this chart pattern, the potential price target is approximately 34 levels.