


Healthcare Services Group, Inc.-(HCSG/NASDAQ)-Long Idea
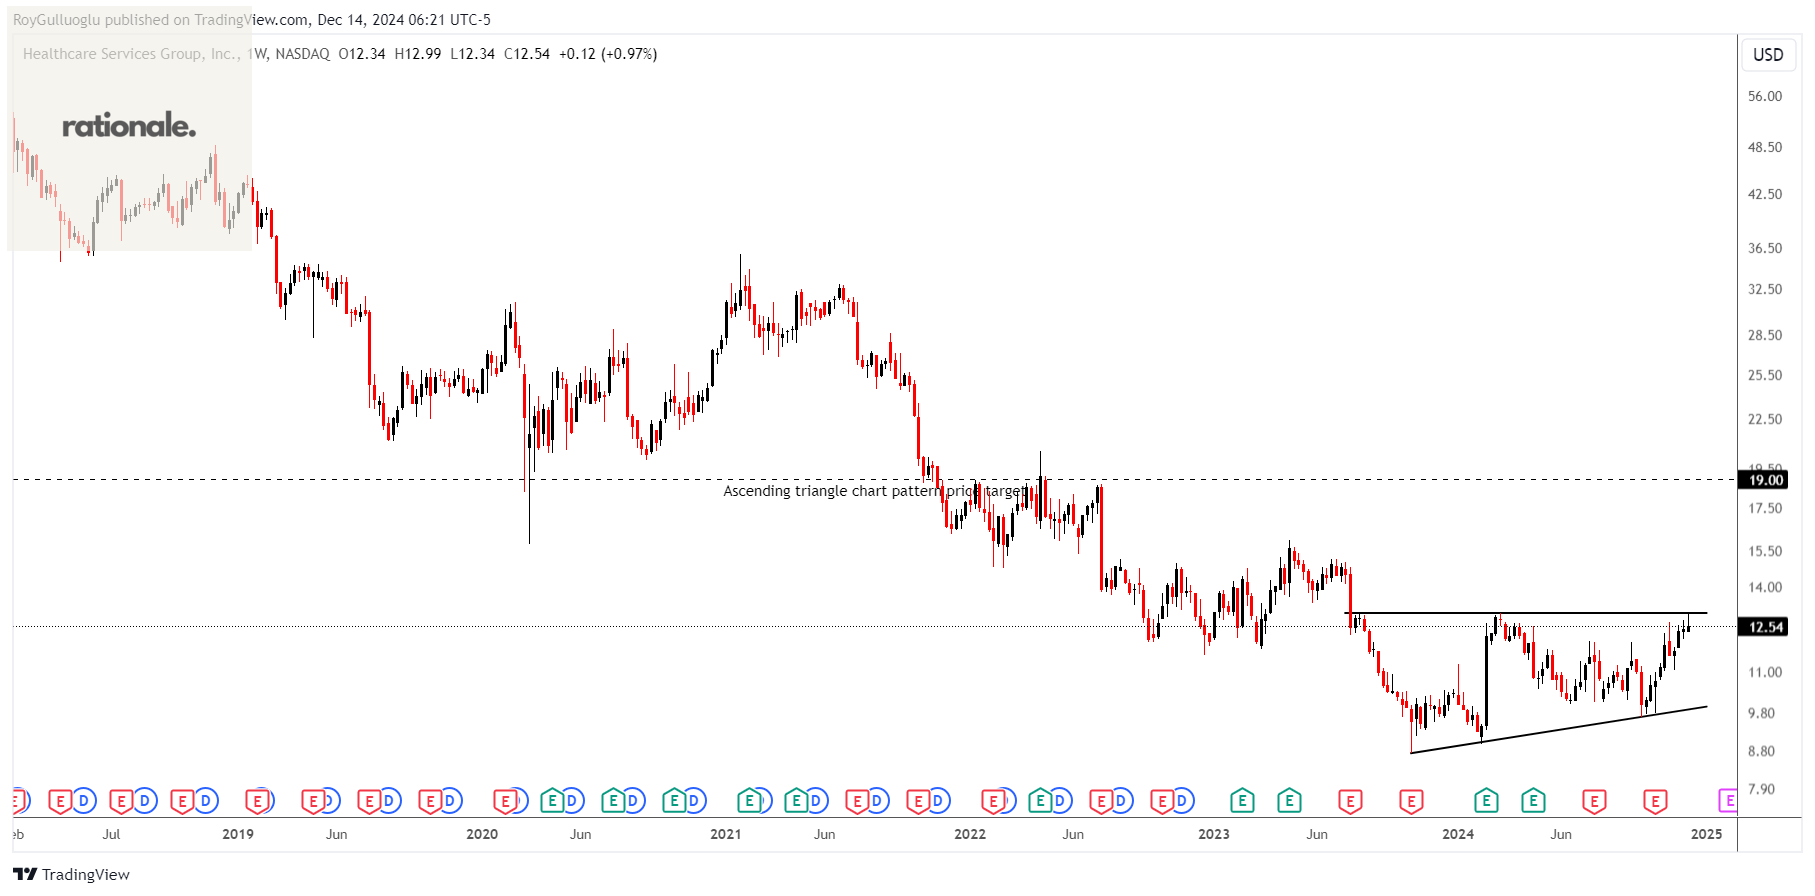
Healthcare Services Group, Inc. provides management, administrative, and operating services to the housekeeping, laundry, linen, facility maintenance, and dietary service departments of nursing homes, retirement complexes, rehabilitation centers, and hospitals in the United States.
The above weekly chart formed an approximately 15-month-long ascending triangle chart pattern as a bullish reversal after a downtrend.
The horizontal boundary at 13 levels acts as a resistance within this pattern.
A daily close above 13.39 levels would validate the breakout from the 15-month-long ascending triangle chart pattern.
Based on this chart pattern, the potential price target is 19 levels.
HCSG, classified under the "healthcare" sector, falls under the “Small Cap - Value” stock category.
BioLife Solutions, Inc.-(BLFS/NASDAQ)-Long Idea
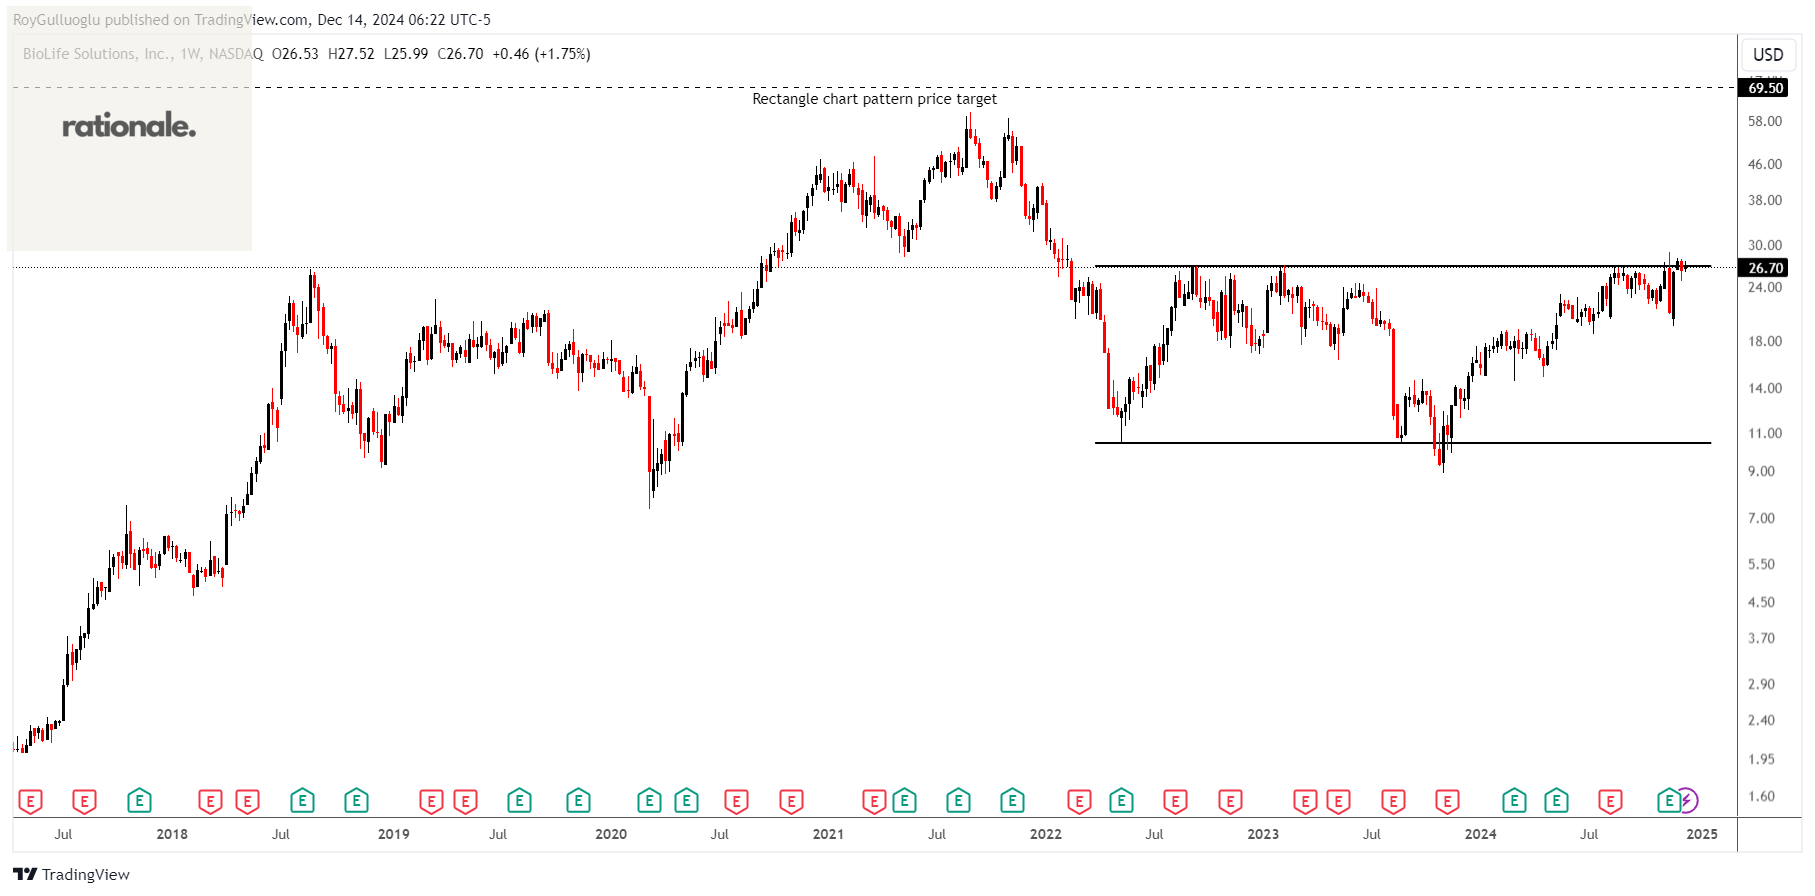
BioLife Solutions, Inc. develops, manufactures, and markets bioproduction tools and services for the cell and gene therapy (CGT) industry in the United States, Europe, the Middle East, Africa, and internationally.
The above weekly chart formed an approximately 32-month-long rectangle chart pattern as a bullish reversal after a downtrend.
The horizontal boundary at 26.84 levels acts as a resistance within this pattern.
A daily close above 27.65 levels would validate the breakout from the 32-month-long rectangle chart pattern.
Based on this chart pattern, the potential price target is 69.5 levels.
BLFS, classified under the "healthcare" sector, falls under the “Small Cap - Value” stock category.
Murphy USA Inc.-(MUSA/NYSE)-Long Idea
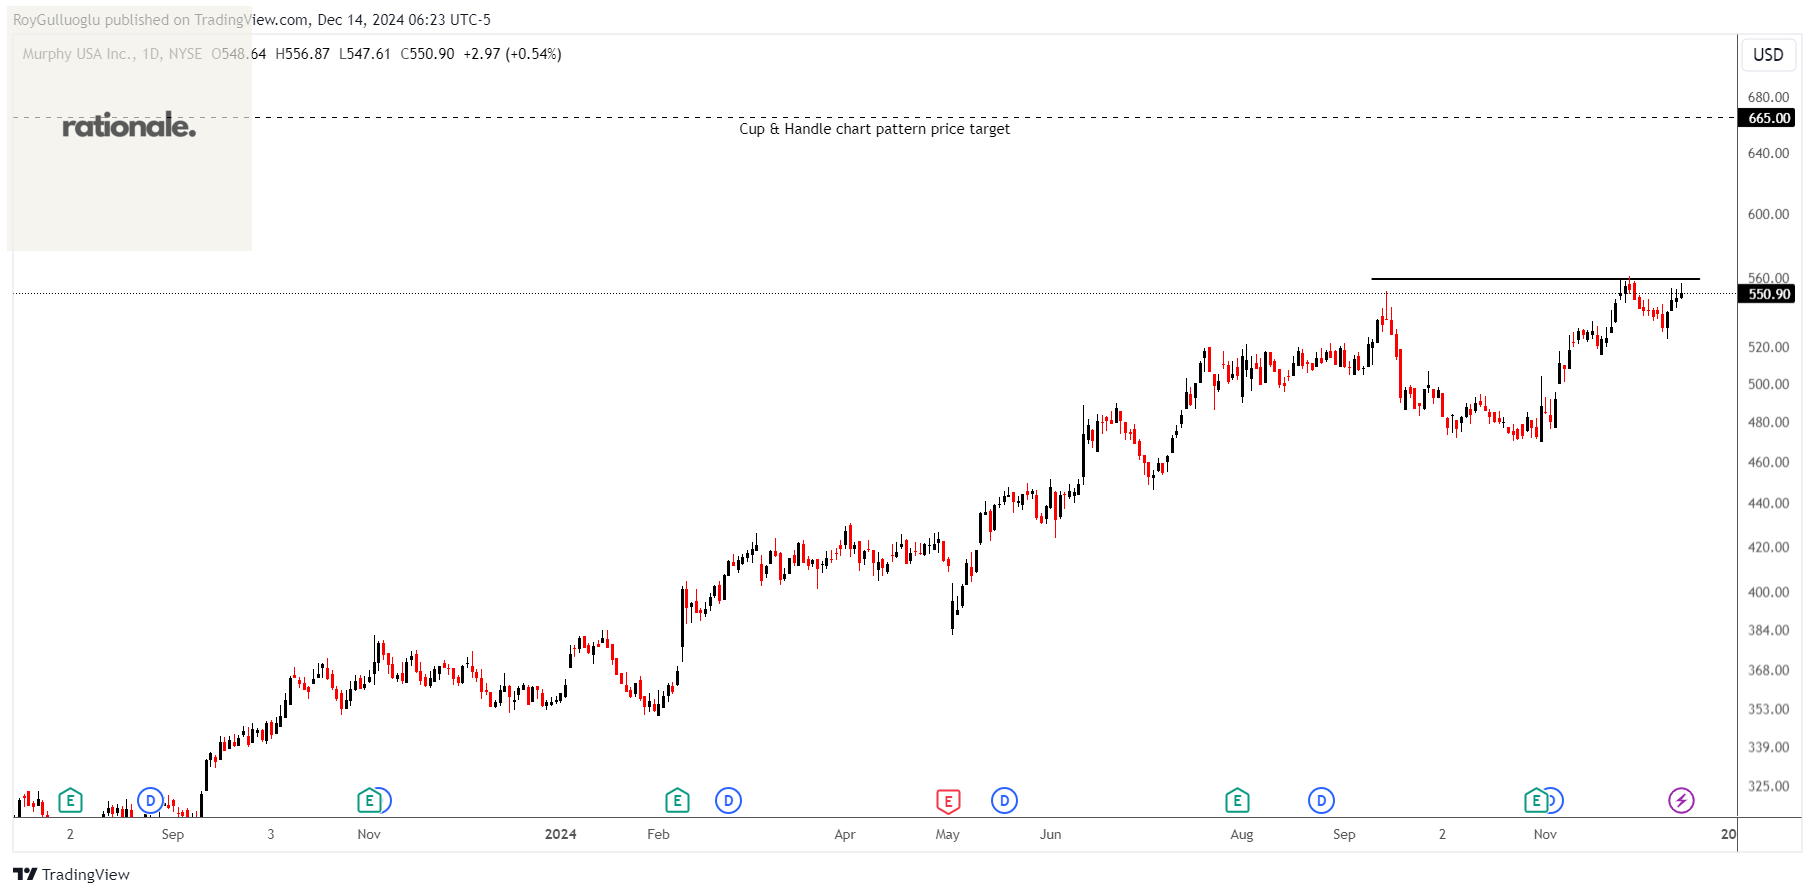
Murphy USA Inc. engages in marketing of retail motor fuel products and convenience merchandise.
The above daily chart formed an approximately 2-month-long cup & handle chart pattern as a bullish continuation after an uptrend.
The horizontal boundary at 559 levels acts as a resistance within this pattern.
A daily close above 576 levels would validate the breakout from the 2-month-long cup & handle chart pattern.
Based on this chart pattern, the potential price target is 665 levels.
MUSA, classified under the "consumer cyclical" sector, falls under the “Large Cap - Growth” stock category.
Thomson Reuters Corporation-(TRI/NYSE)-Long Idea

Thomson Reuters Corporation engages in the provision of business information services in the Americas, Europe, the Middle East, Africa, and the Asia Pacific.
The above daily chart formed an approximately 4-month-long symmetrical triangle chart pattern as a bullish continuation after an uptrend.
A daily close above 178.7 levels would validate the breakout from the 4-month-long symmetrical triangle chart pattern.
Based on this chart pattern, the potential price target is 205 levels.
TRI, classified under the "industrials" sector, falls under the “Large Cap - Value” stock category.
Danske Bank A/S-(DANSKE/OMXCOP)-Long Idea
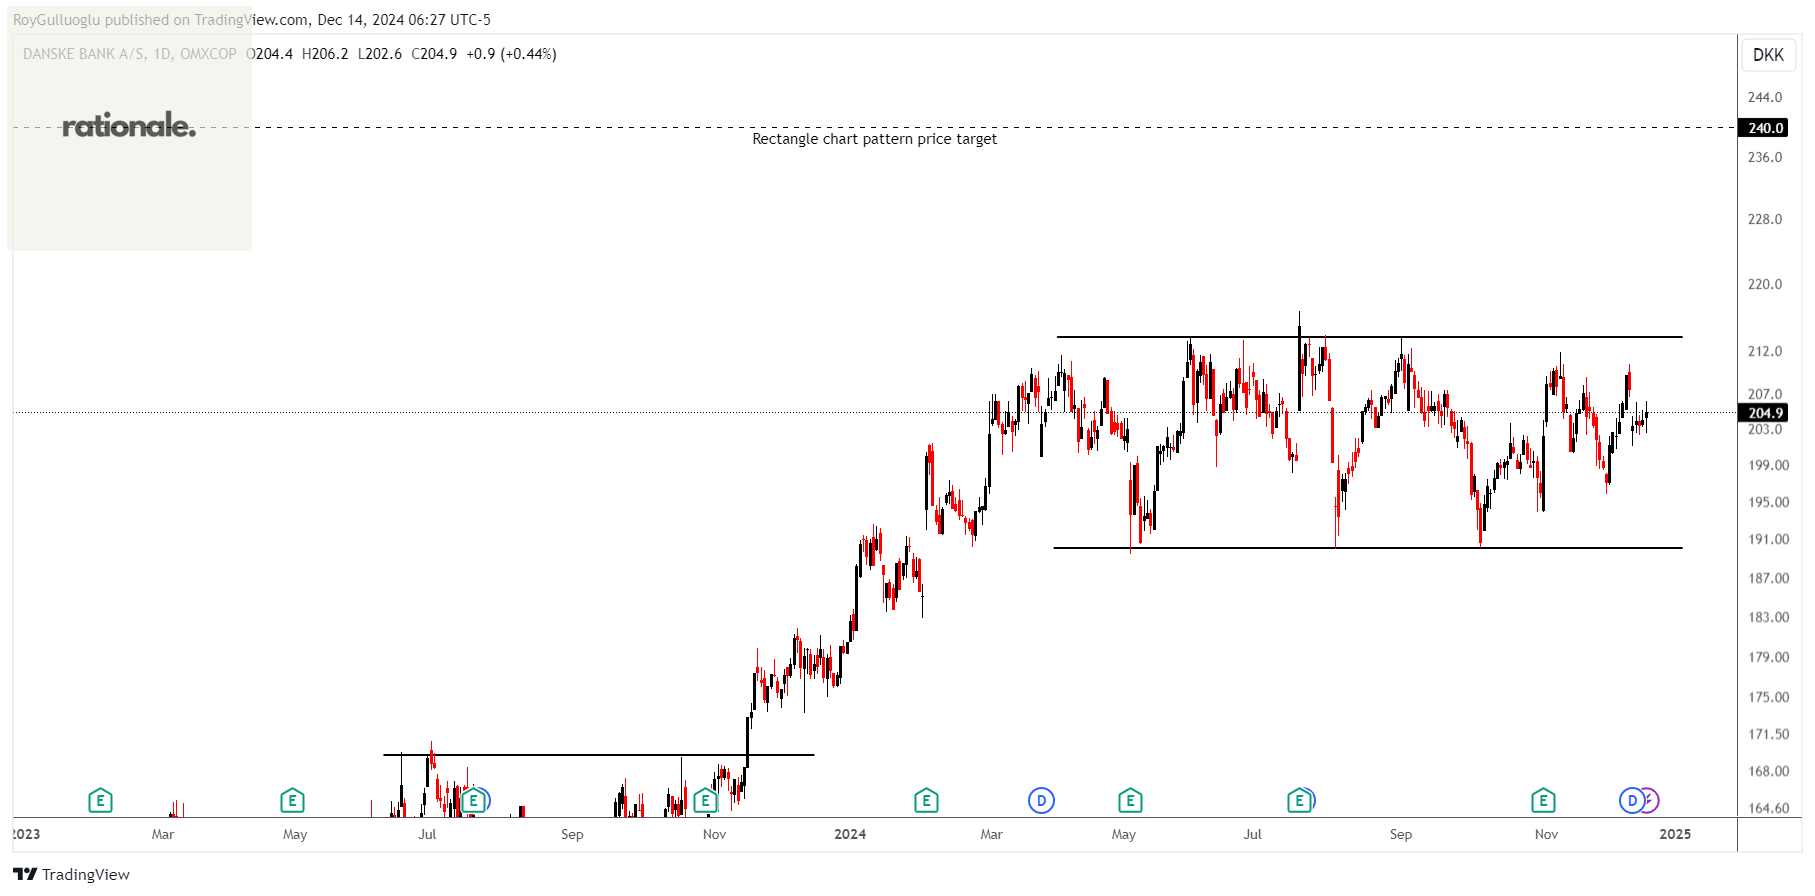
Danske Bank A/S provides various banking products and services to corporate, institutional, and international clients.
The above daily chart formed an approximately 6-month-long rectangle chart pattern as a bullish reversal after a downtrend.
The horizontal boundary at 214 levels acts as a resistance within this pattern.
A daily close above 220 levels would validate the breakout from the 6-month-long rectangle chart pattern.
Based on this chart pattern, the potential price target is 240 levels.
DANSKE, classified under the "financial services" sector, falls under the “Large Cap - Income” stock category.