

Trade Ideas Fx-Futures-Etf-Crypto
AUDUSD, GBPCHF, NKD1!(CME), AETF(ATHEX)

AUDUSD-Long Idea
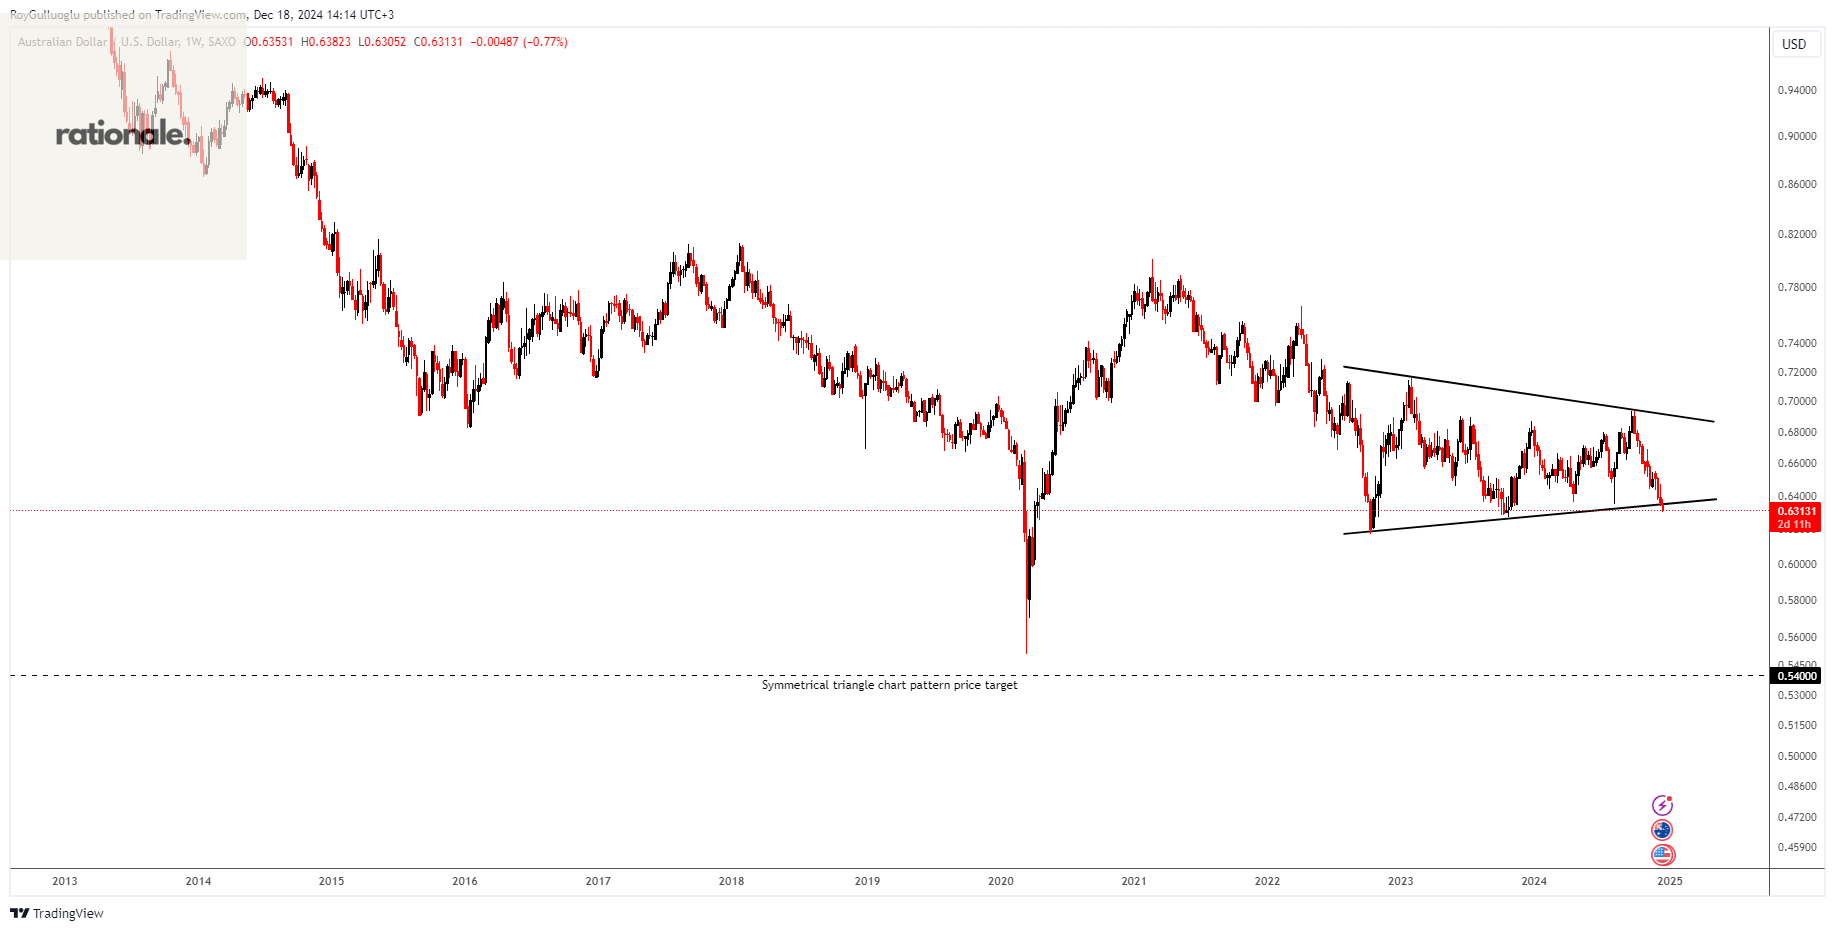
The above weekly chart formed an approximately 29-month-long symmetrical triangle chart pattern as a bearish continuation after a downtrend.
A daily close below 0.628 levels would validate the breakdown from the 29-month-long symmetrical triangle chart pattern.
Based on this chart pattern, the potential price target is approximately 0.54 levels.
The Australian dollar (AUD) faces headwinds from fragile growth and persistent inflation, while the U.S. dollar (USD) remains supported by stronger economic fundamentals. AUD/USD may weaken as Australia grapples with growth challenges and cautious global risk sentiment, with China's economic performance playing a pivotal role. November data from China revealed continued challenges: declining housing prices, underwhelming retail sales despite early sales promotions, and slightly below-forecast fixed investments. These factor suggest potential downside for AUD/USD, particularly if China's struggles deepen under external pressures such as U.S. trade policies.
GBPCHF-Long Idea
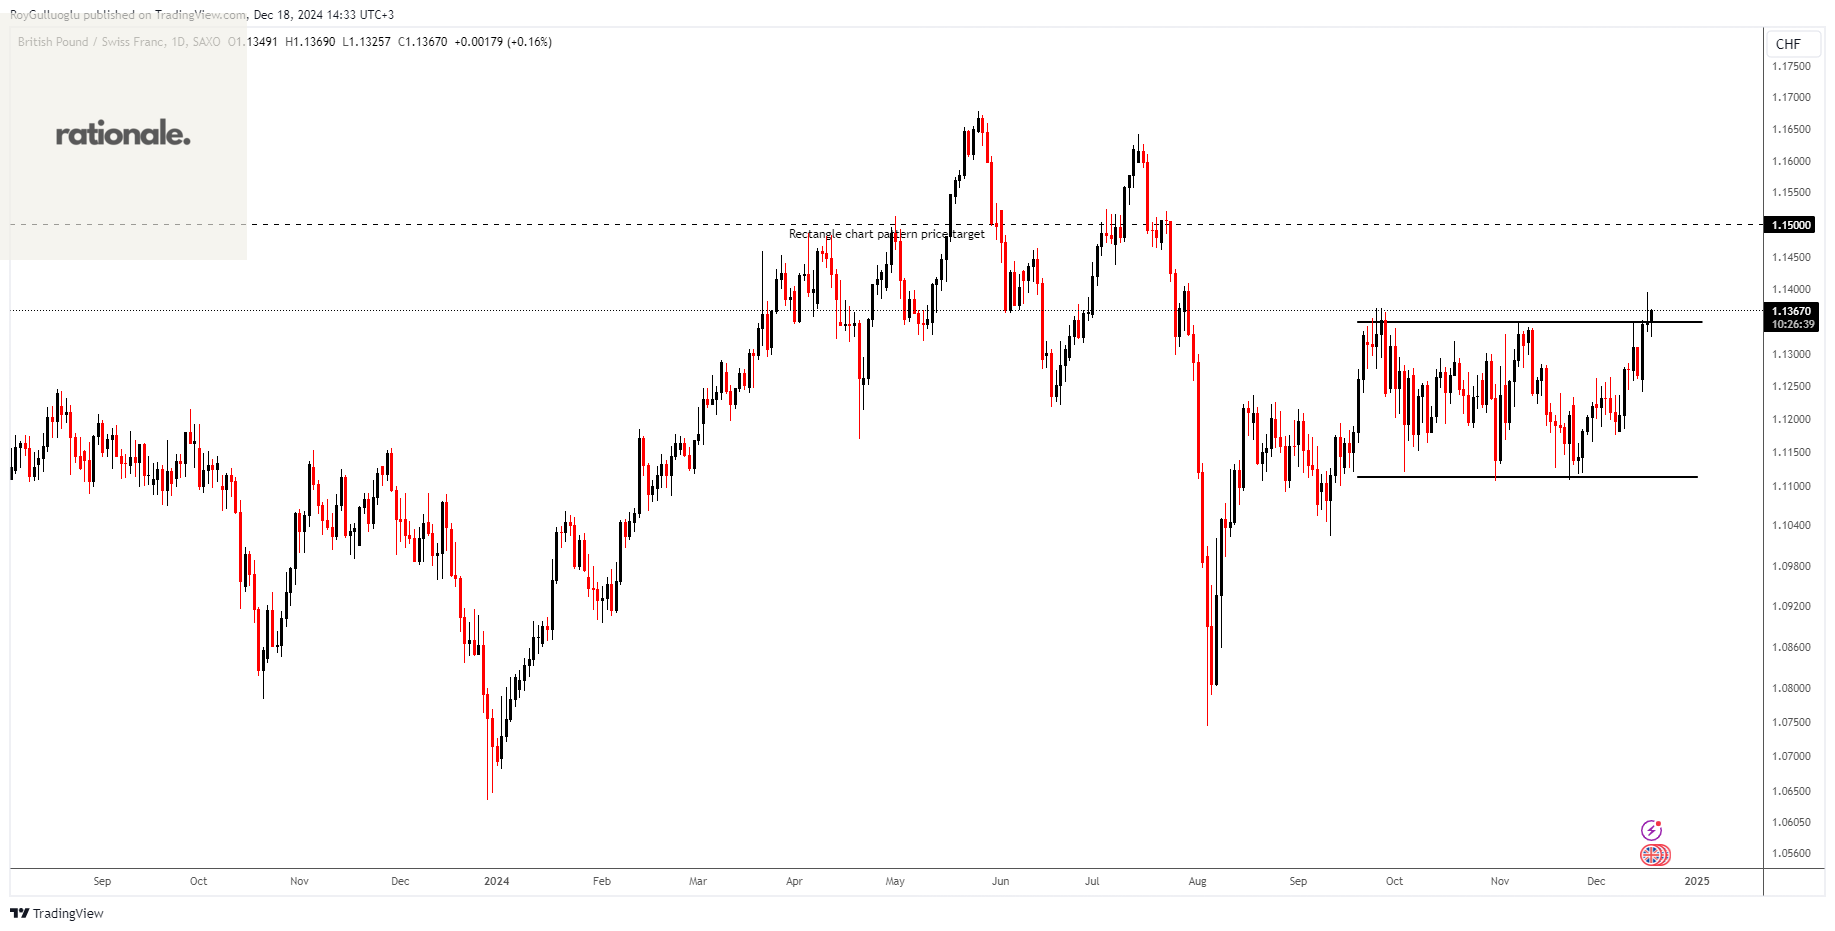
The above daily chart formed an approximately 2-month-long rectangle chart pattern as a bullish continuation after an uptrend.
The horizontal boundary at 1.1348 levels acts as a resistance within this pattern.
A daily close above 1.14 levels would validate the breakout from the 2-month-long rectangle chart pattern.
Based on this chart pattern, the potential price target is approximately 1.15 levels.
The UK faces elevated inflation alongside sluggish growth, raising stagflation risks, while Switzerland benefits from low inflation and stable growth.
The Bank of England (BoE) is likely to maintain higher rates to combat persistent inflationary pressures, while the Swiss National Bank (SNB) remains dovish, with potential rate cuts on the horizon due to low inflation and stable growth. This contrast underscores the relative strength of the pound over the franc, as the BoE's tighter policy stance supports GBP appreciation. With the SNB signaling a more accommodative path, the rate divergence might favor GBP/CHF upside potential.
NKD1!(Nikkei Index Futures)-Long Idea
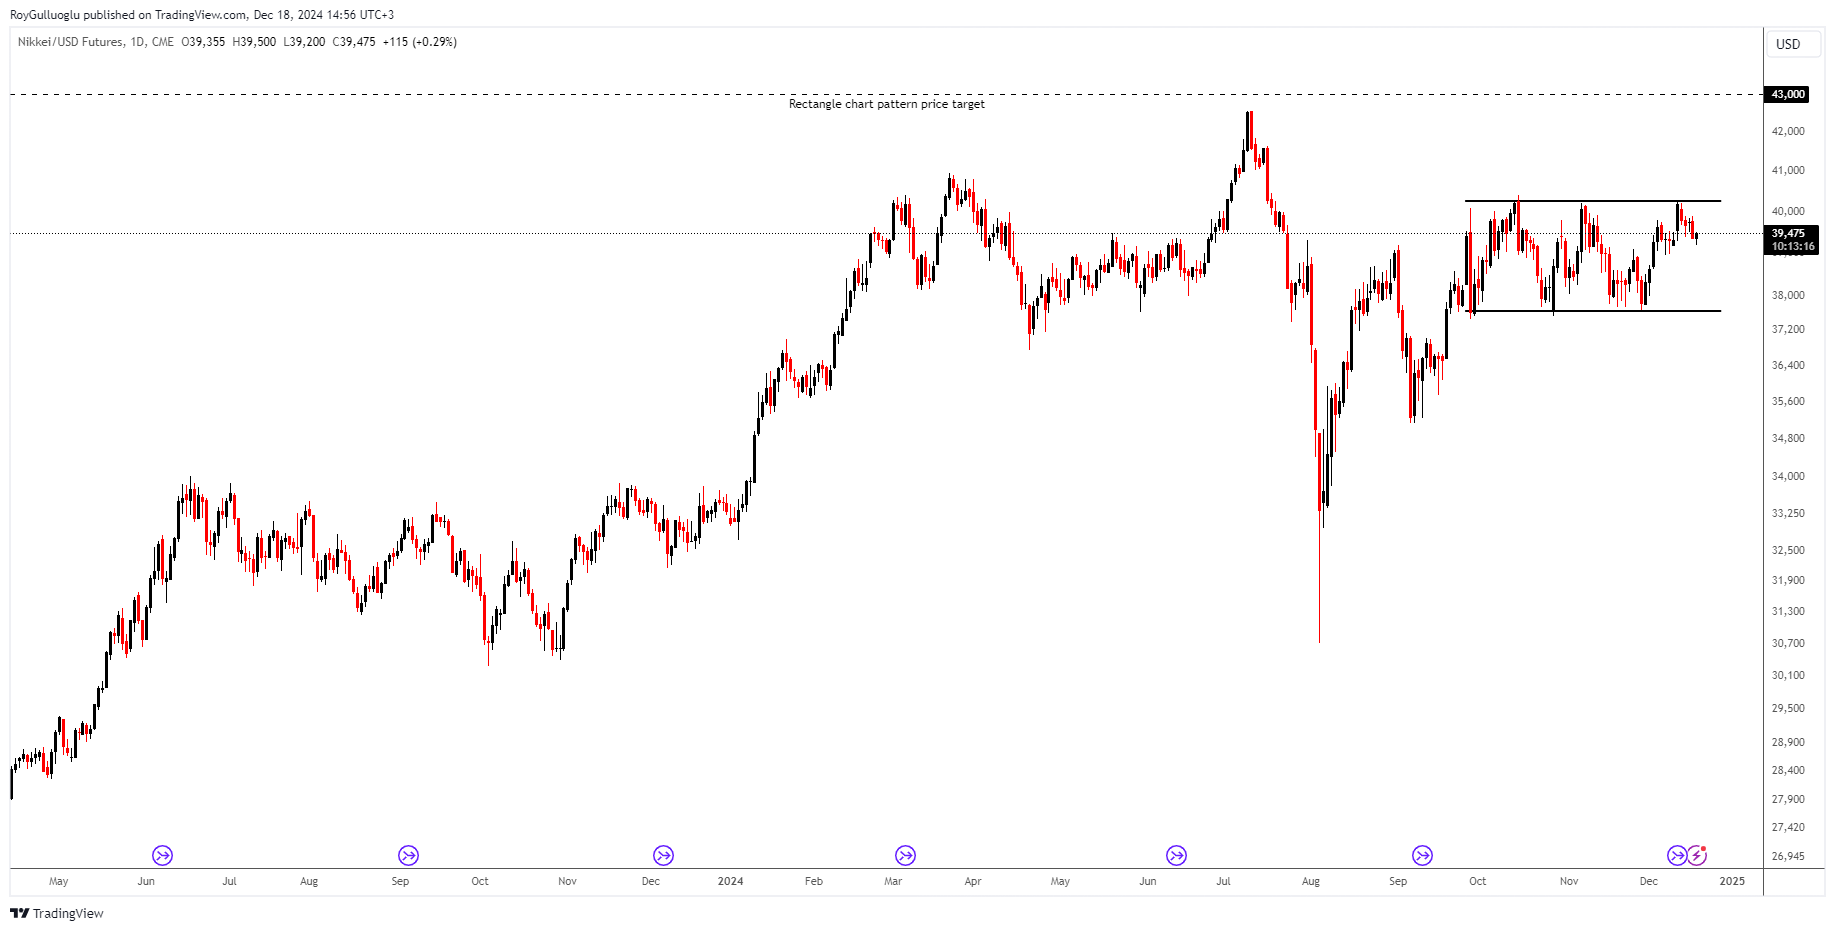
The above daily chart formed an approximately 2-month-long rectangle chart pattern as a bullish continuation after an uptrend.
The horizontal boundary at 40275 levels acts as a resistance within this pattern.
A daily close above 40675 levels would validate the breakout from the 2-month-long rectangle chart pattern.
Based on this chart pattern, the potential price target is approximately 43000 levels.
Japan's subdued growth and stable inflation have anchored the Bank of Japan's dovish stance, with little likelihood of significant tightening. This accommodative monetary policy continues to support favorable borrowing conditions and corporate profitability, creating a positive environment for the Nikkei index. As long as the BoJ maintains its current approach, the Nikkei is well-positioned to perform strongly, benefiting from supportive liquidity and stable economic conditions.
ALPHA ETF FTSE Athex Large Cap Equity UCITS-(AETF/ATHEX)-Long Idea
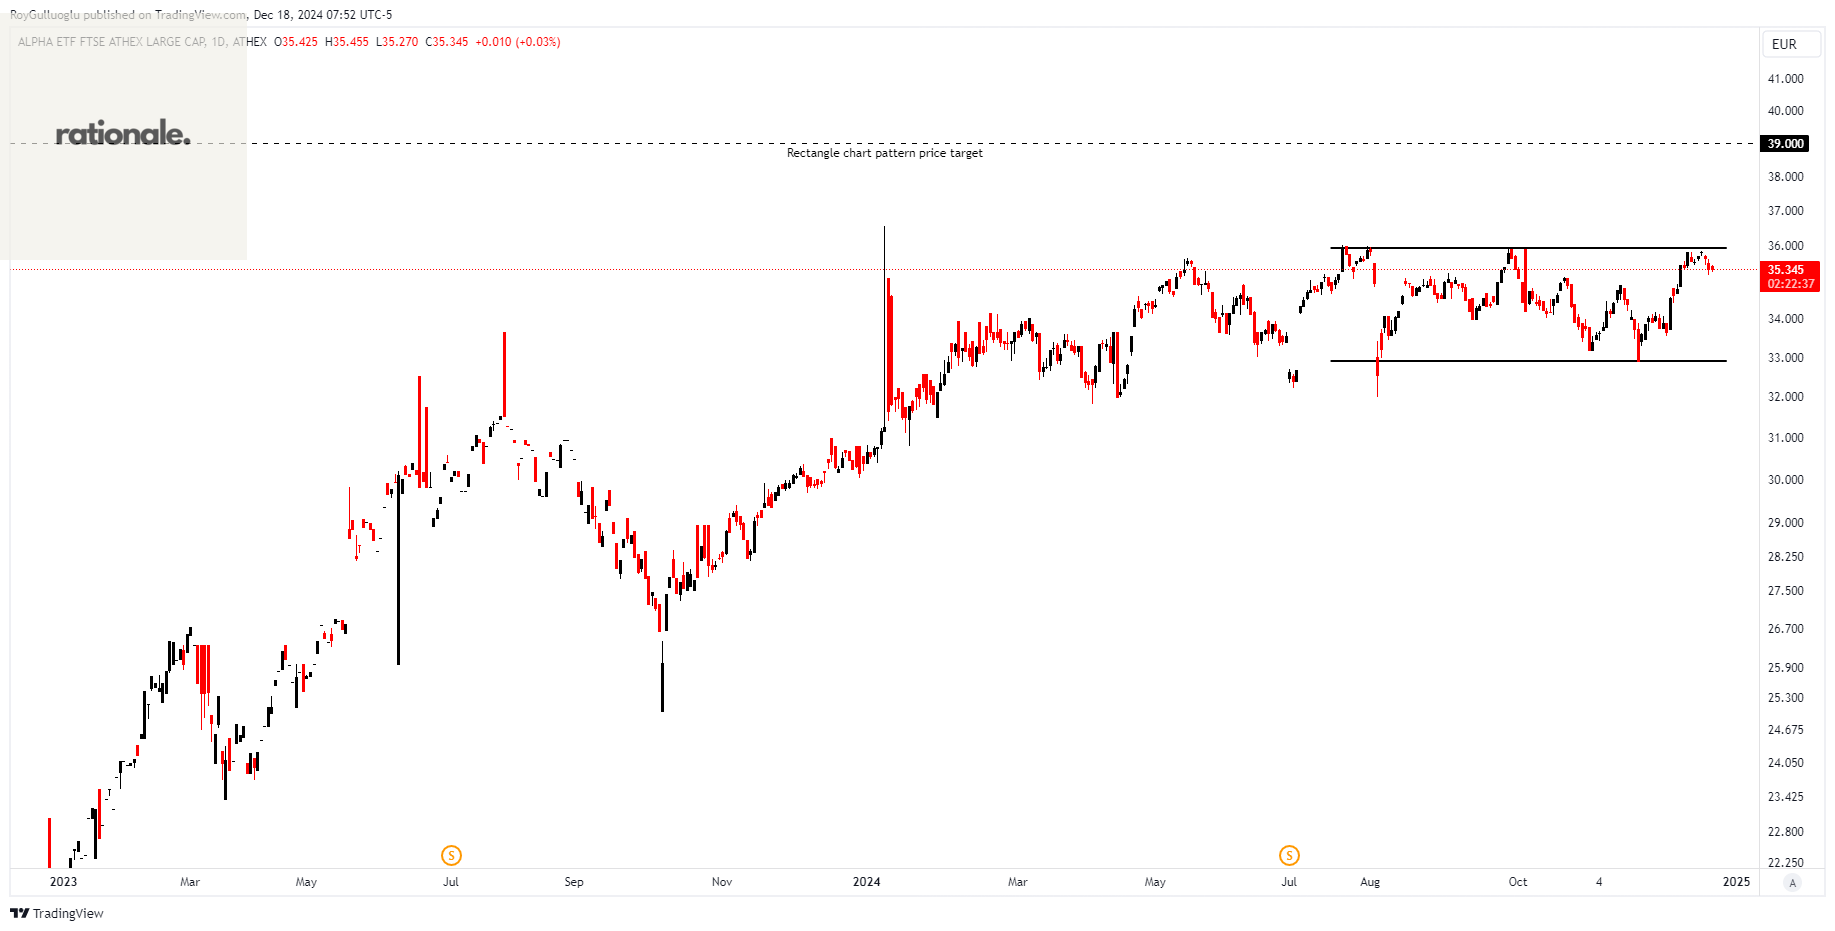
The investment seeks to track the price and performance yield, before fees and expenses, of the FTSE Athex 20 index
The above daily chart formed an approximately 3-month-long rectangle chart pattern as a bullish continuation after an uptrend.
Within this pattern, the horizontal boundary at 35.93 levels acts as a resistance.
A daily close above 36.9 levels would validate the breakout from the 3-month-long rectangle chart pattern.
Based on this chart pattern, the potential price target is 39 levels.