

Trade Ideas Equities
FDS(NASDAQ), DMP(XETR), BN(EURONEXT), 7751(TSE), 6361(TSE), DODLA(NSE), RAYSG(BIST), ISMEN(BIST)

FactSet Research Systems Inc.-(FDS/NYSE)-Long Idea

FactSet Research Systems Inc., together with its subsidiaries, operates as a financial digital platform and enterprise solutions provider for the investment community worldwide.
The above weekly chart formed an approximately 39-month-long ascending triangle chart pattern as a bullish continuation after an uptrend.
The horizontal boundary at 488.28 levels acts as a resistance within this pattern.
A daily close above 503 levels would validate the breakout from the 39-month-long ascending triangle chart pattern.
Based on this chart pattern, the potential price target is 680 levels.
FDS, classified under the "financial services" sector, falls under the “Large Cap - Income” stock category.
Dermapharm Holding SE.-(DMP/NASDAQ)-Long Idea
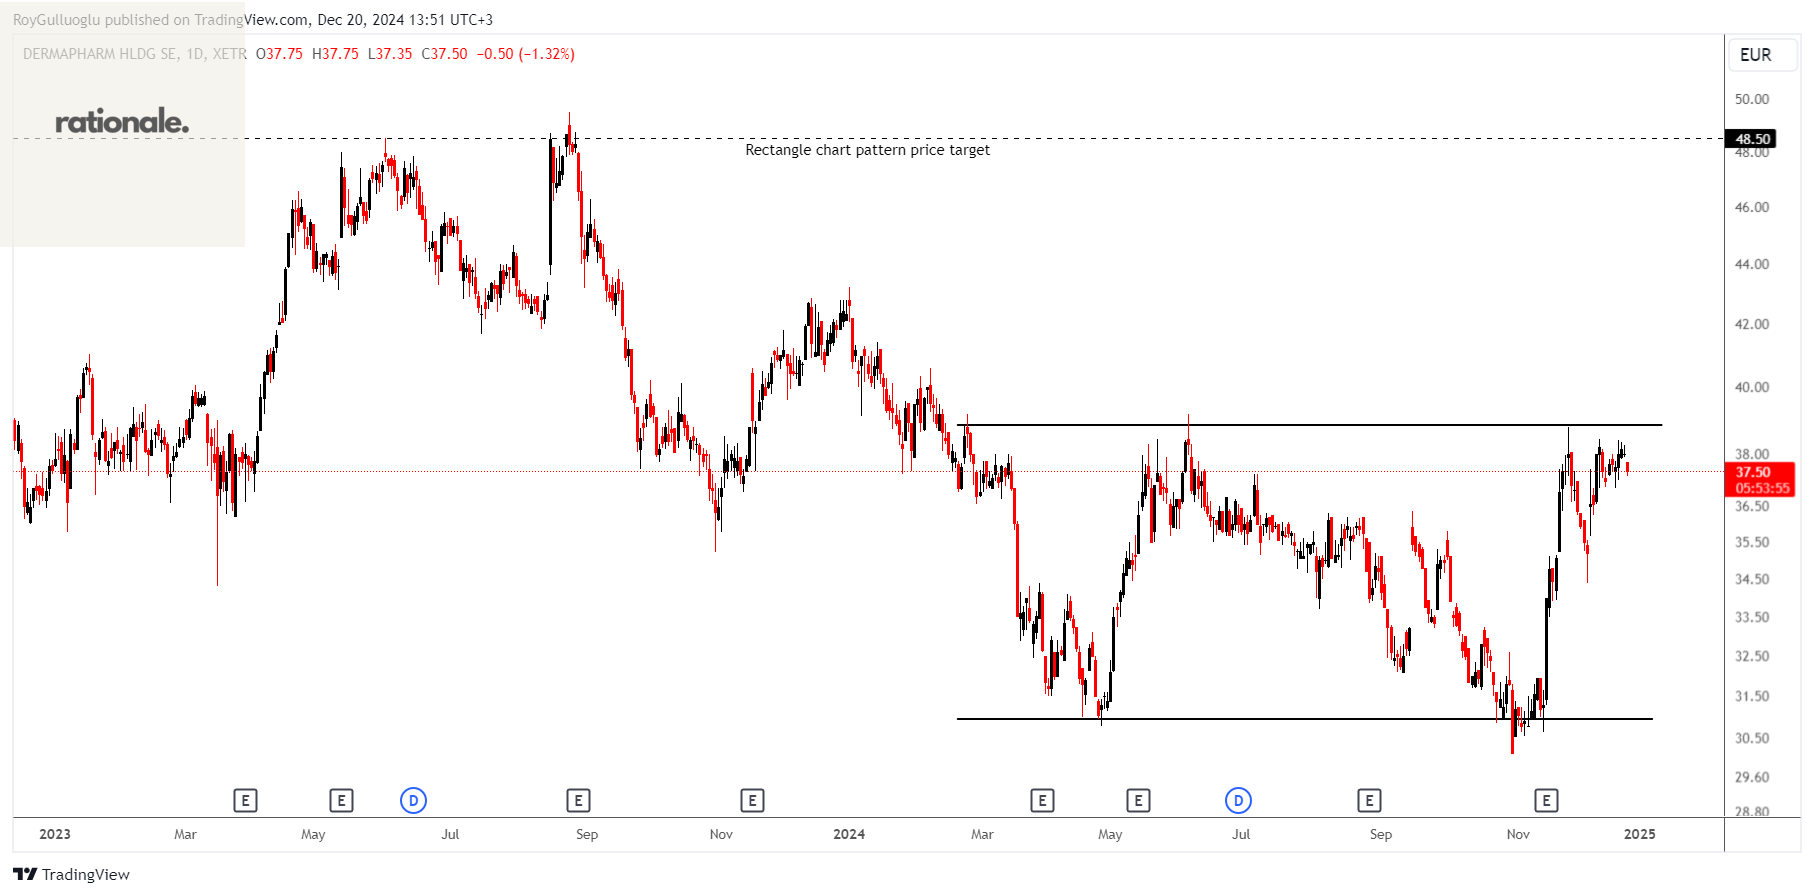
The above weekly chart formed an approximately 50-month-long rectangle chart pattern as a bullish reversal after a downtrend.
The horizontal boundary at 38.85 levels acts as a resistance within this pattern.
A daily close above 40 levels would validate the breakout from the 50-month-long rectangle chart pattern.
Based on this chart pattern, the potential price target is 48.5 levels.
DMP, classified under the "healthcare" sector, falls under the “Mid Cap - Value” stock category.
Danone S.A. -(BN/EURONEXT)-Short Idea
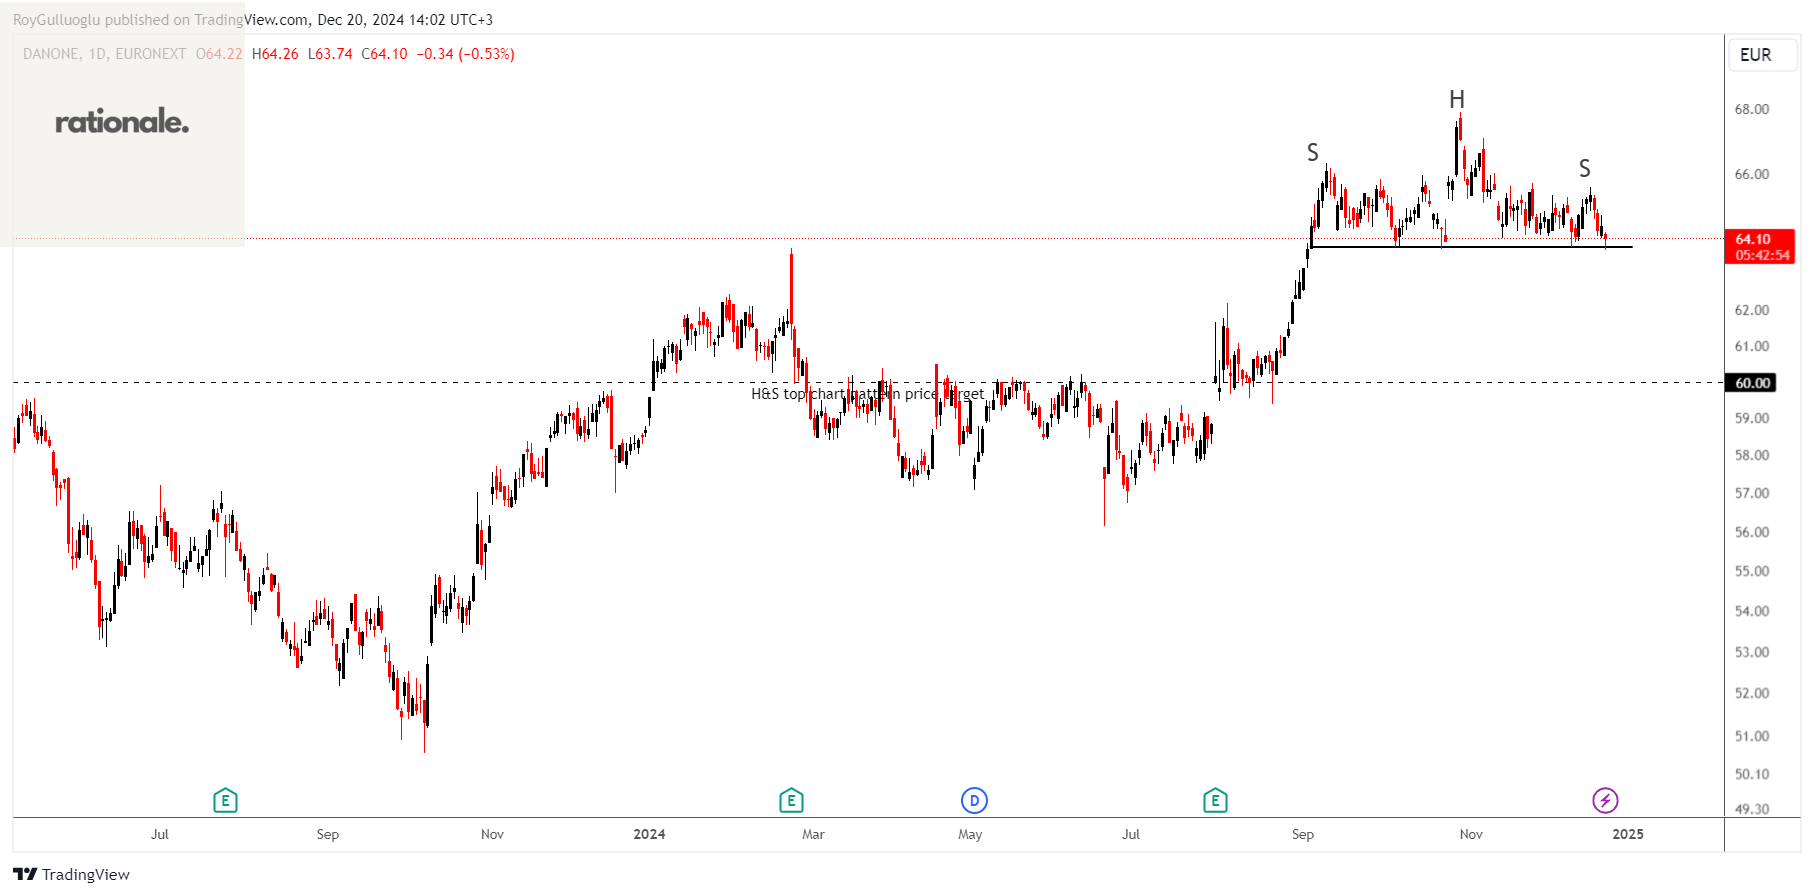
Danone S.A. operates in the food and beverage industry in Europe, Ukraine, North America, China, North Asia, the Oceania, Latin America, rest of Asia, Africa, Turkey, the Middle East, and the Commonwealth of Independent States.
The above daily chart formed an approximately 3-month-long H&S top chart pattern as a bearish reversal after an uptrend.
The horizontal boundary at 63.8 levels acts as a support within this pattern.
A daily close below 61.88 levels would validate the breakdown from the 3-month-long H&S top chart pattern.
Based on this chart pattern, the potential price target is 60 levels.
BN, classified under the "consumer defensive" sector, falls under the “Large Cap - Value” stock category.
Canon Inc.-(7751/TSE)-Long Idea
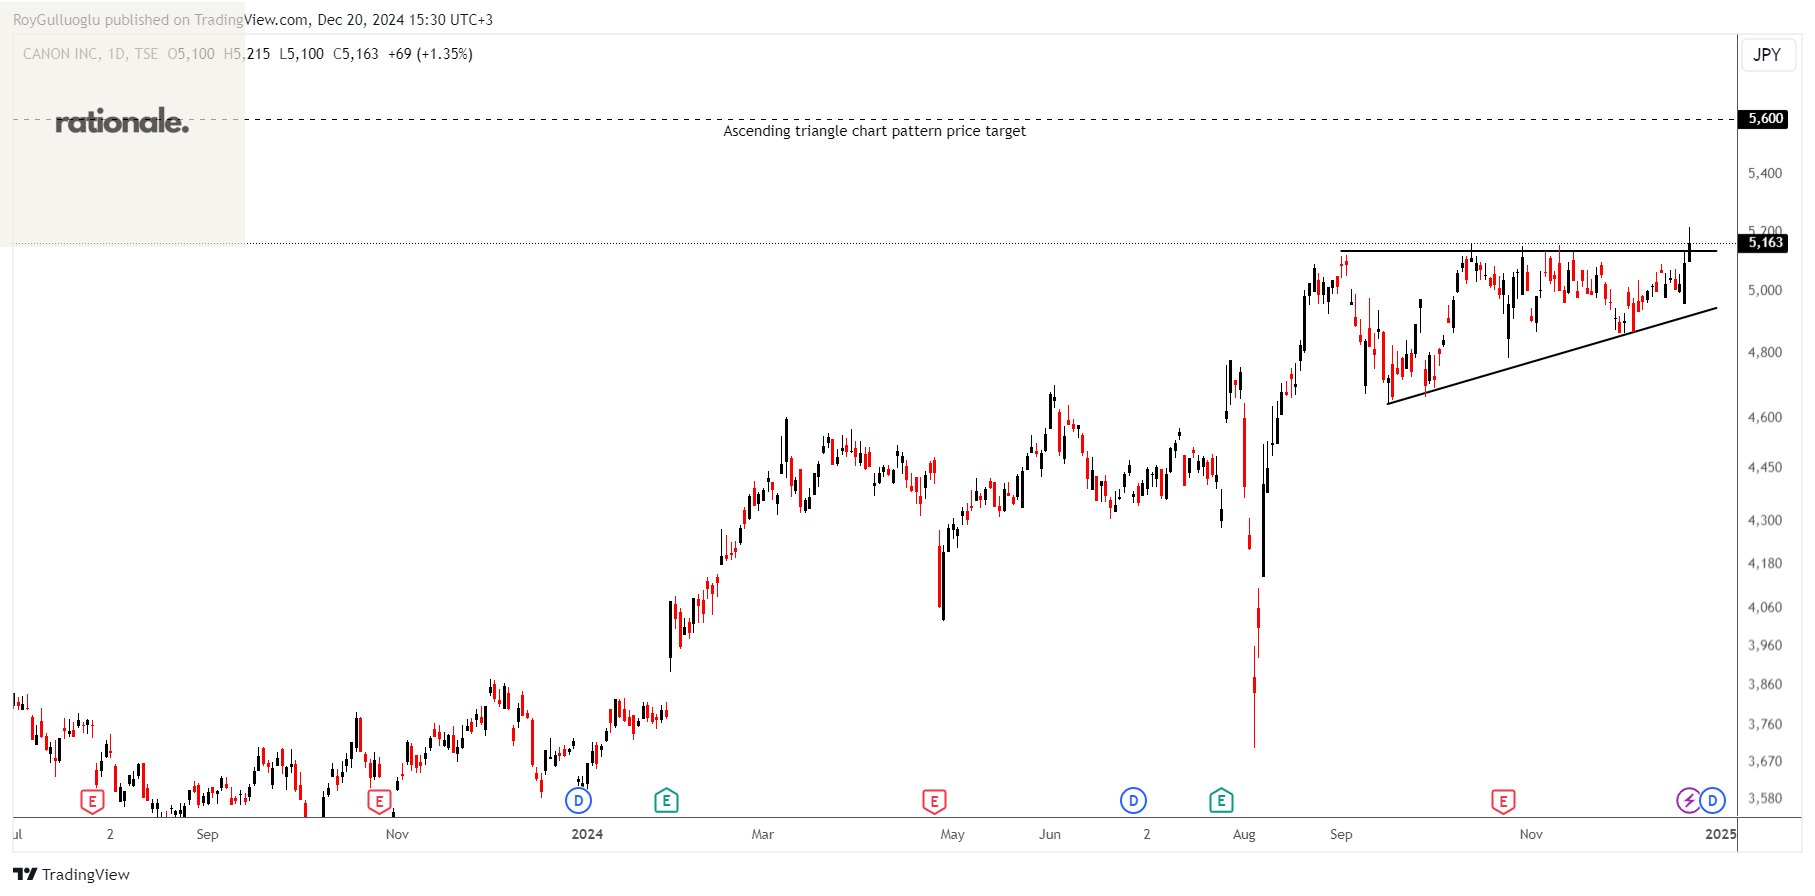
Canon Inc., together with its subsidiaries, manufactures and sells office multifunction devices (MFDs), laser and inkjet printers, cameras, medical equipment, and lithography equipment worldwide.
The above daily chart formed an approximately 3-month-long ascending triangle chart pattern as a bullish continuation after an uptrend.
The horizontal boundary at 5134 levels acts as a resistance within this pattern.
A daily close above 5288 levels would validate the breakout from the 3-month-long ascending triangle chart pattern.
Based on this chart pattern, the potential price target is 5600 levels.
7751, classified under the "technology" sector, falls under the “Large Cap - Growth” stock category.
Ebara Corporation-(6361/TSE)-Long Idea
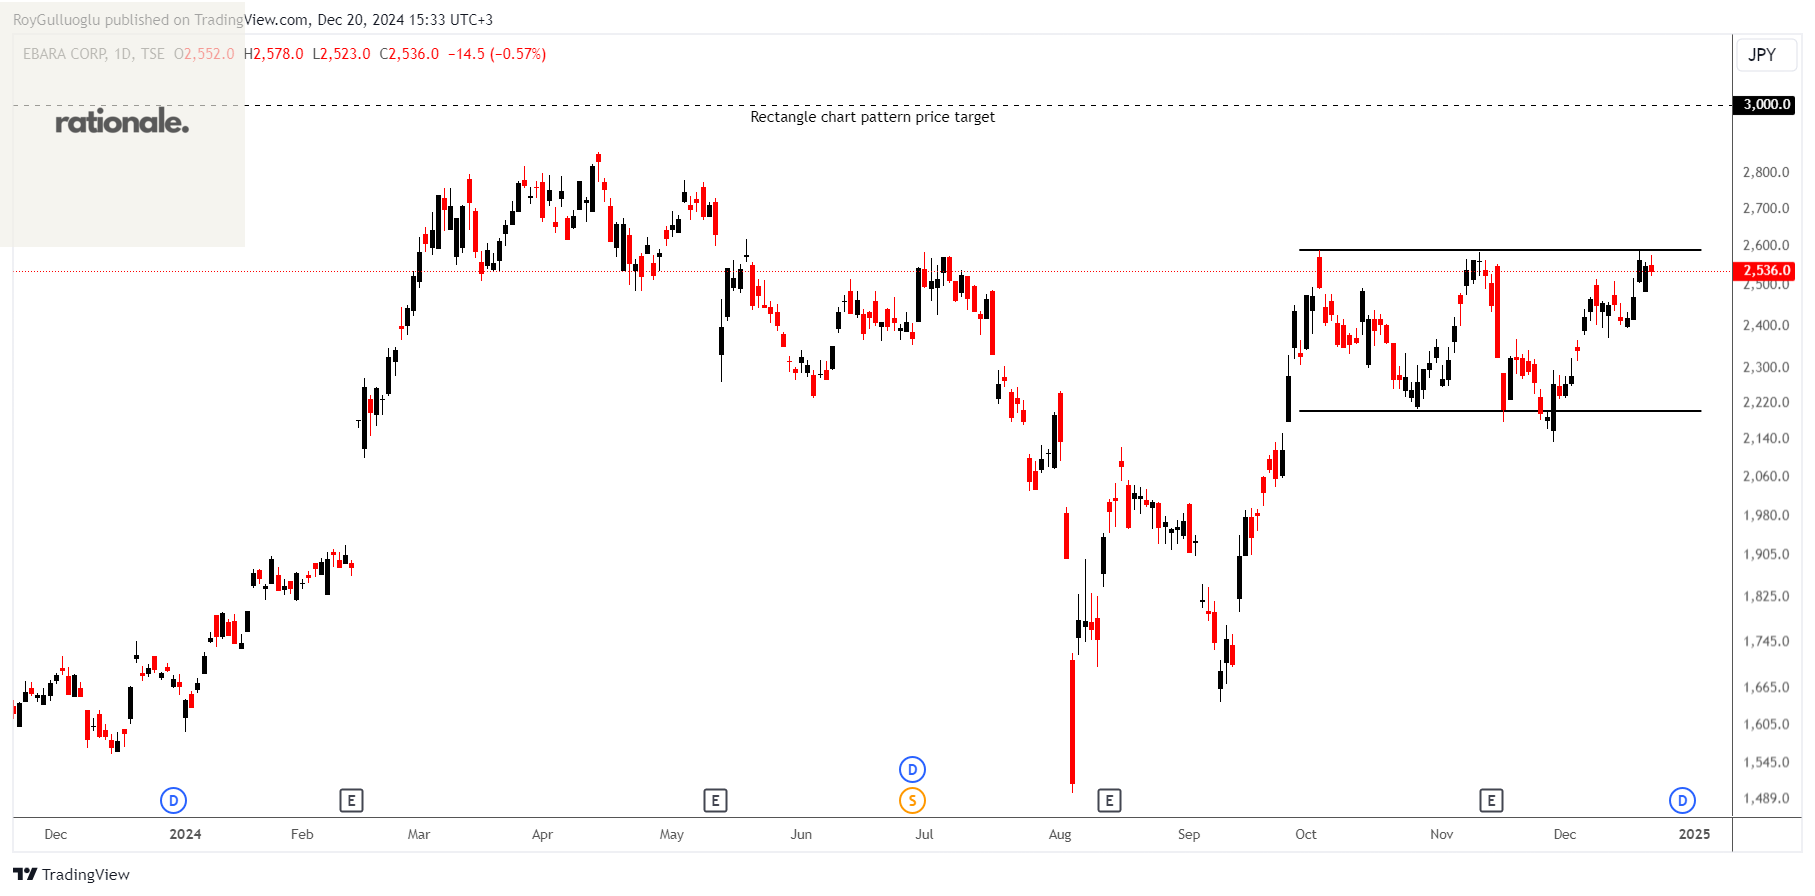
Ebara Corporation manufactures and sells industrial machinery. It operates through Fluid Machinery & Systems, Environmental Plants, and Precision Machinery segments.
The above daily chart formed an approximately 3-month-long rectangle chart pattern as a bullish continuation after an uptrend.
The horizontal boundary at 2591 levels acts as a resistance within this pattern.
A daily close above 2668 levels would validate the breakout from the 3-month-long rectangle chart pattern.
Based on this chart pattern, the potential price target is 3000 levels.
6361, classified under the "industrials" sector, falls under the “Mid Cap - Value” stock category.
Dodla Dairy Limited-(DODLA/NSE)-Long Idea
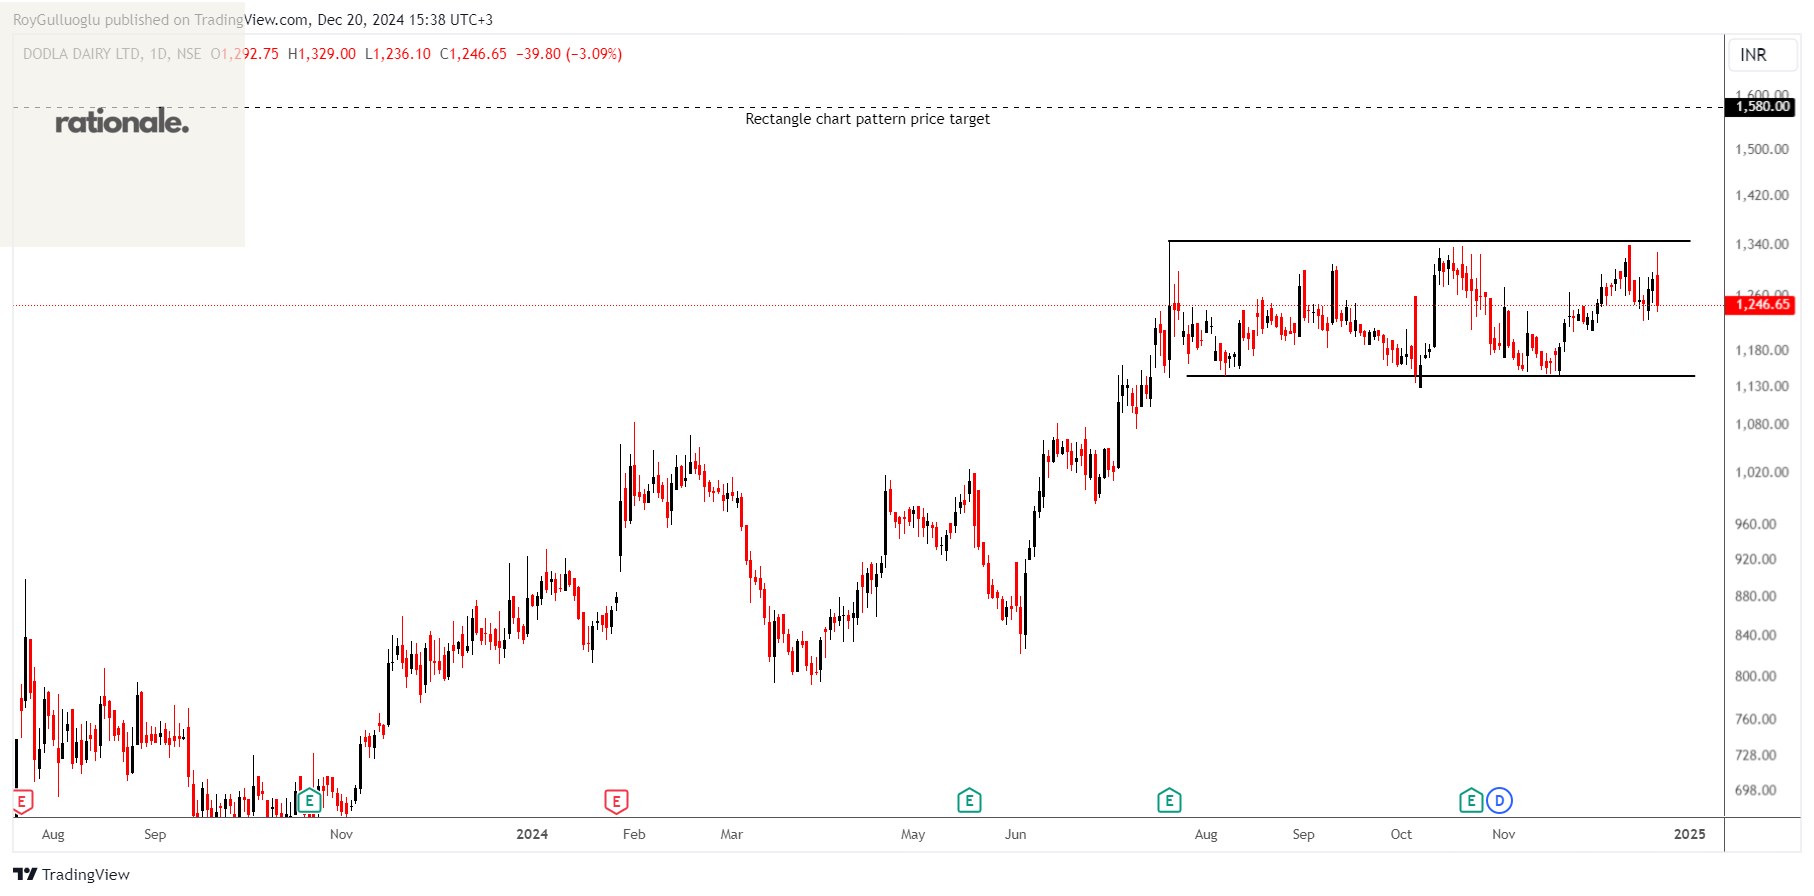
Dodla Dairy Limited, together with its subsidiaries, engages in the production and sale of milk and milk products in India and internationally.
The above daily chart formed an approximately 3-month-long rectangle chart pattern as a bullish continuation after an uptrend.
The horizontal boundary at 1346.1 levels acts as a resistance within this pattern.
A daily close above 1386 levels would validate the breakout from the 3-month-long rectangle chart pattern.
Based on this chart pattern, the potential price target is 1580 levels.
DODLA, classified under the "consumer defensive" sector, falls under the “Small Cap - Value” stock category.
Ray Sigorta Anonim Sirketi -(RAYSG/BIST)-Long Idea
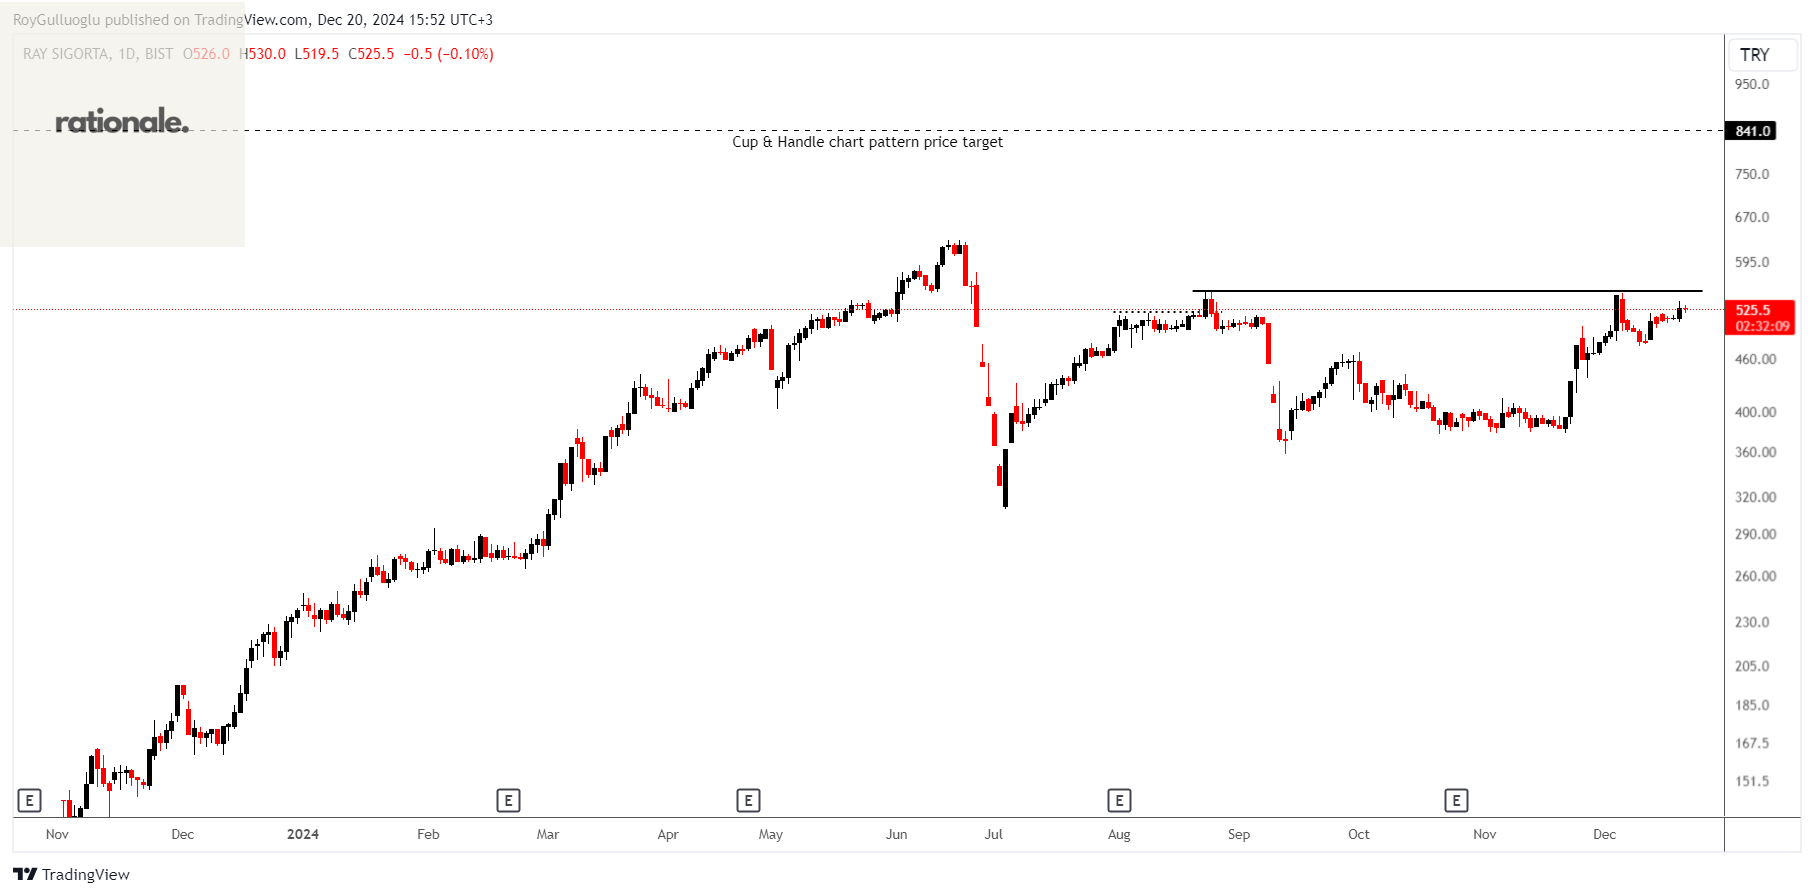
Ray Sigorta Anonim Sirketi engages in the non-life insurance business in Turkey.
The above daily chart formed an approximately 3-month-long Cup & Handle chart pattern as a bullish continuation after an uptrend.
The horizontal boundary at 550.5 levels acts as a resistance within this pattern.
A daily close above 567 levels would validate the breakout from the 3-month-long Cup & Handle chart pattern.
Based on this chart pattern, the potential price target is 841 levels.
RAYSG, classified under the "financial services" sector, falls under the “Mid Cap - Income” stock category.
Is Yatirim Menkul Degerler Anonim Sirketi -(ISMEN/BIST)-Long Idea
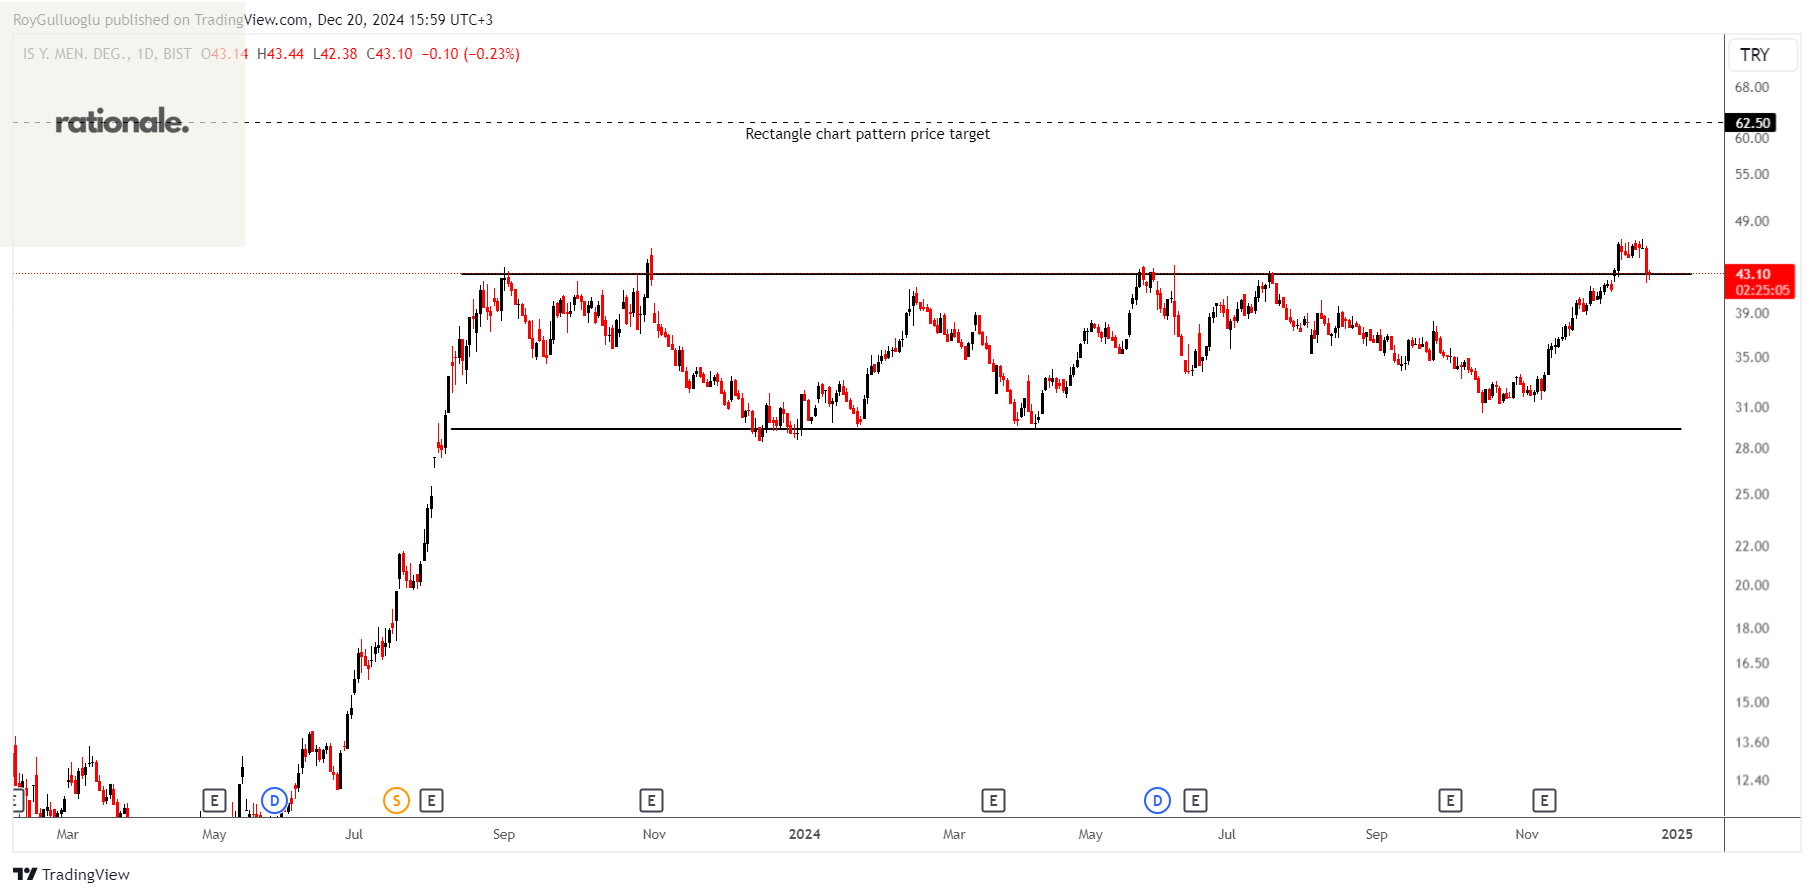
Is Yatirim Menkul Degerler Anonim Sirketi provides capital market services to individual and corporate investors in Turkey and internationally.
The above daily chart formed an approximately 11-month-long rectangle chart pattern as a bullish continuation after an uptrend.
The horizontal boundary at 43 levels acted as a resistance within this pattern.
A daily close above 44.3 levels validated the breakout from the 11-month-long rectangle chart pattern and the price is pulling back to the support level.
Based on this chart pattern, the potential price target is 62.5 levels.
ISMEN, classified under the "financial services" sector, falls under the “Small Cap - Income” stock category.