

Trade Ideas Equities
CAMT(NASDAQ), CEG(NASDAQ), SYNA(NASDAQ), TSM(NYSE), 4633(TSE), 4751(TSE), 1878(TSE), SIEMENS(NSE)

Camtek Ltd.-(CAMT/NASDAQ)-Long Idea
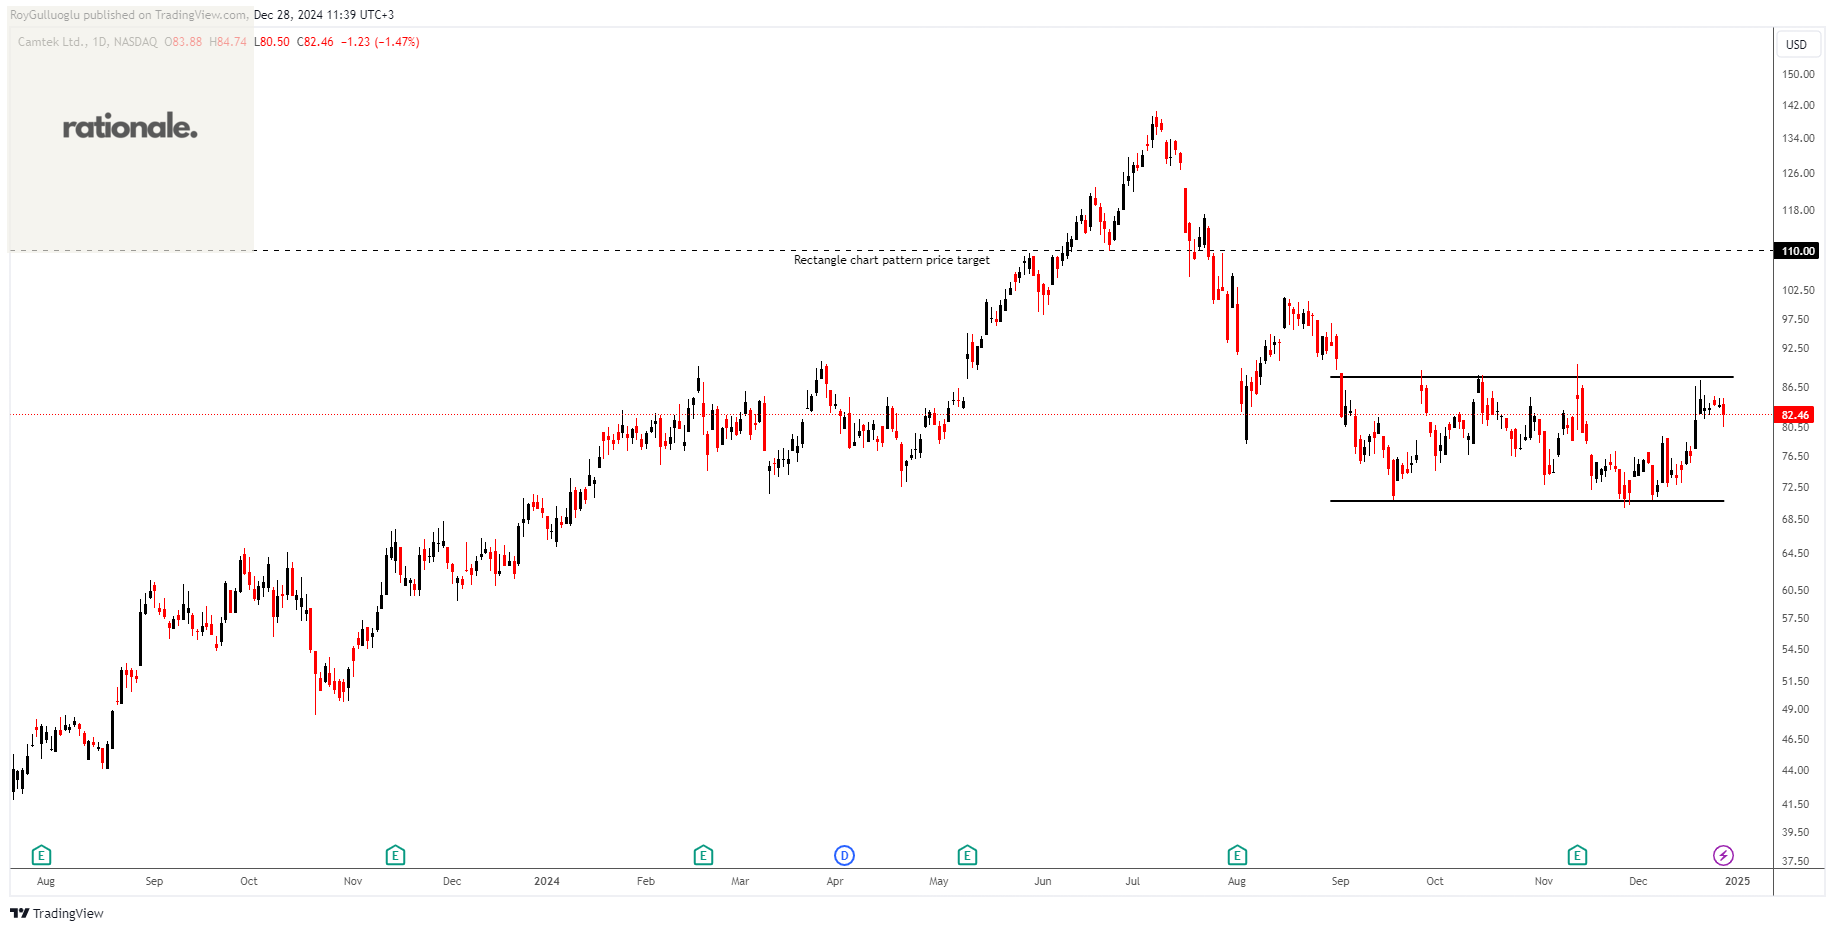
Camtek Ltd., together with its subsidiaries, develops, manufactures, and sells inspection and metrology equipment for semiconductor industry.
The above daily chart formed an approximately 3-month-long rectangle chart pattern as a bullish reversal after a downtrend.
The horizontal boundary at 88 levels acts as a resistance within this pattern.
A daily close above 90.64 levels would validate the breakout from the 3-month-long rectangle chart pattern.
Based on this chart pattern, the potential price target is 110 levels.
A potential breakout would also be a price action above 200 day moving average(red line).
CAMT, classified under the "technology" sector, falls under the “Mid Cap - Growth” stock category.
Constellation Energy Corporation-(CEG/NASDAQ)-Short Idea
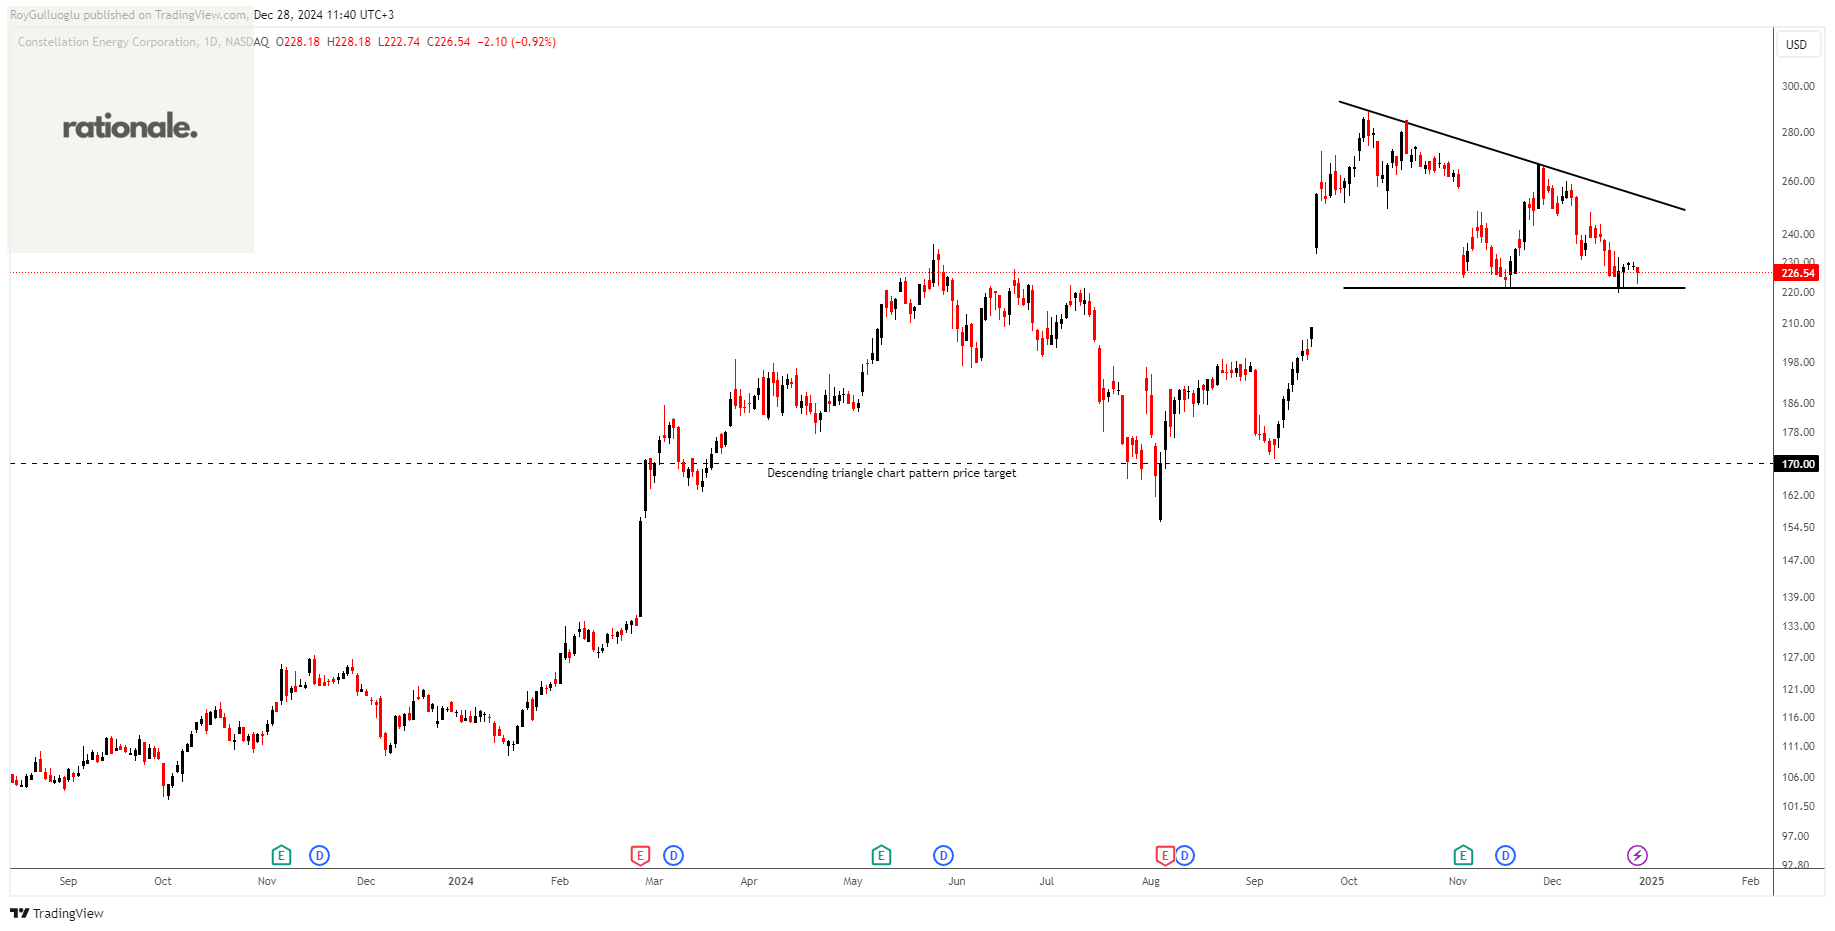
Constellation Energy Corporation generates and sells electricity in the United States. It operates through five segments: Mid-Atlantic, Midwest, New York, ERCOT, and Other Power Regions.
The above daily chart formed an approximately 2-month-long descending triangle chart pattern as a bearish reversal after an uptrend.
The horizontal boundary at 221.17 levels acts as a support within this pattern.
A daily close below 214.5 levels would validate the breakout from the 2-month-long descending triangle chart pattern.
Based on this chart pattern, the potential price target is 170 levels.
CEG, classified under the "utilities" sector, falls under the “Large Cap - Income” stock category.
Synaptics Incorporated -(SYNA/NASDAQ)-Long Idea
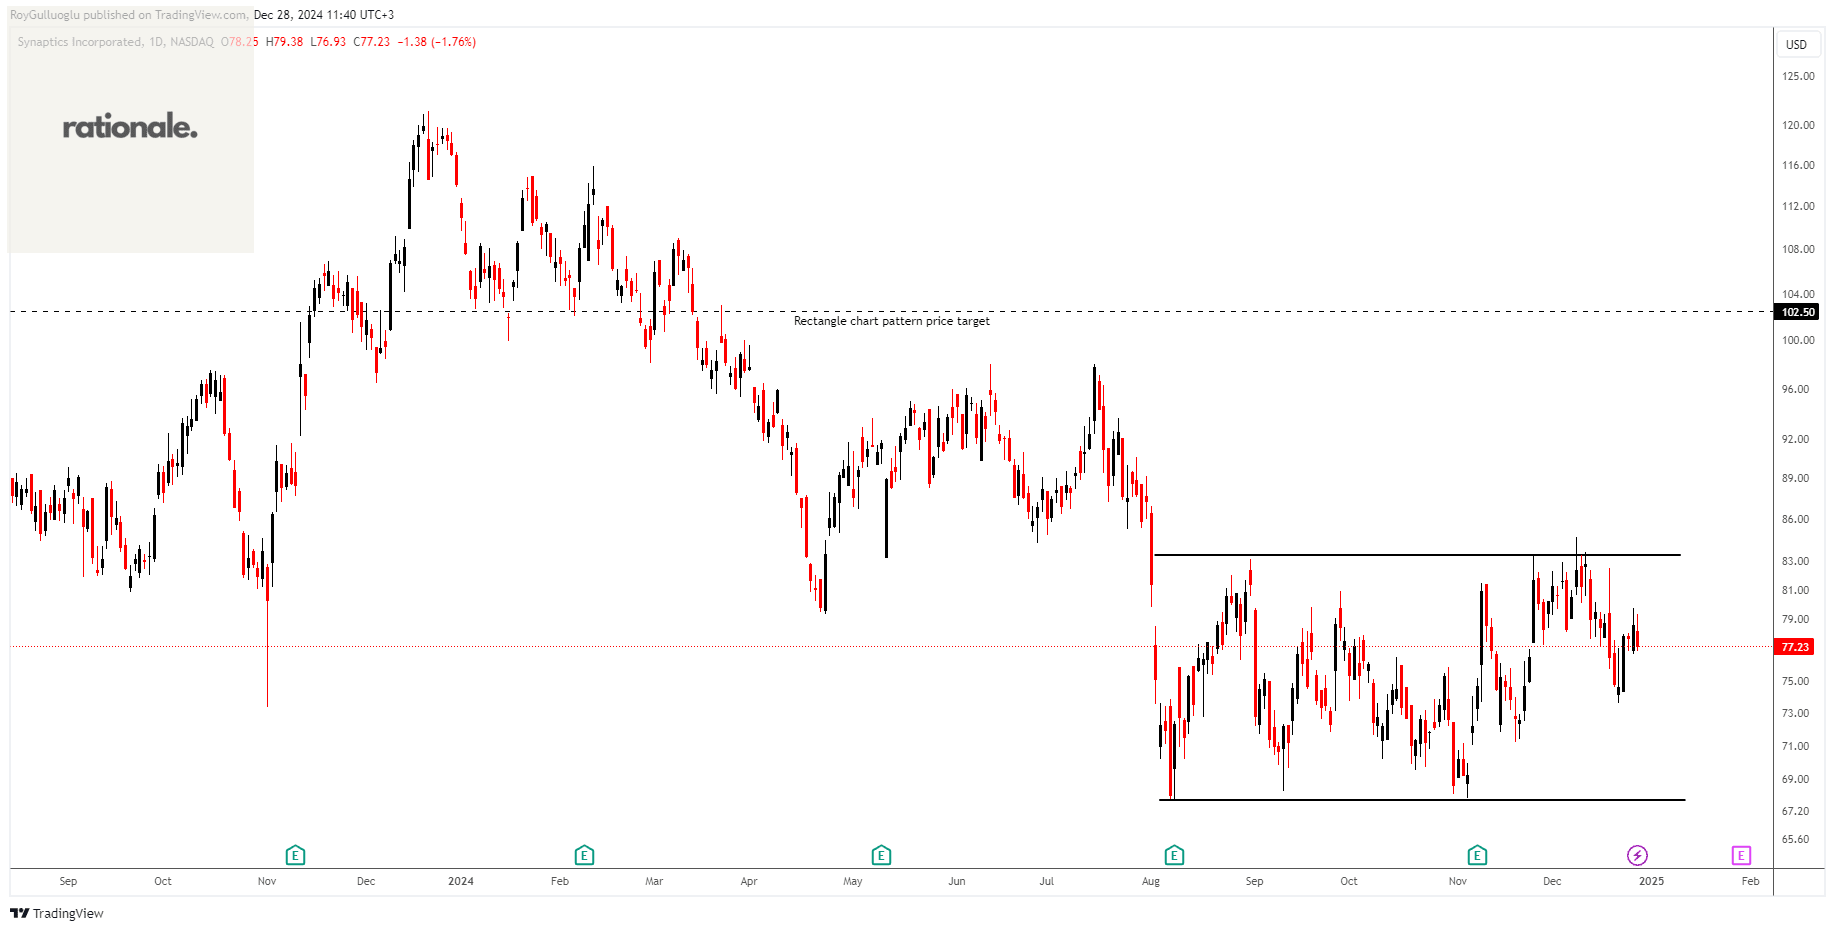
Synaptics Incorporated develops, markets, and sells semiconductor products worldwide.
The above daily chart formed an approximately 3-month-long rectangle chart pattern as a bullish reversal after a downtrend.
The horizontal boundary at 83.45 levels acts as a resistance within this pattern.
A daily close above 85.95 levels would validate the breakout from the 3-month-long rectangle chart pattern.
Based on this chart pattern, the potential price target is 102.5 levels.
A potential breakout would also be a price action above 200 day moving average(red line).
SYNA, classified under the "technology" sector, falls under the “Mid Cap - Growth” stock category.
Taiwan Semiconductor Manufacturing Company Limited-(TSM/NYSE)-Long Idea
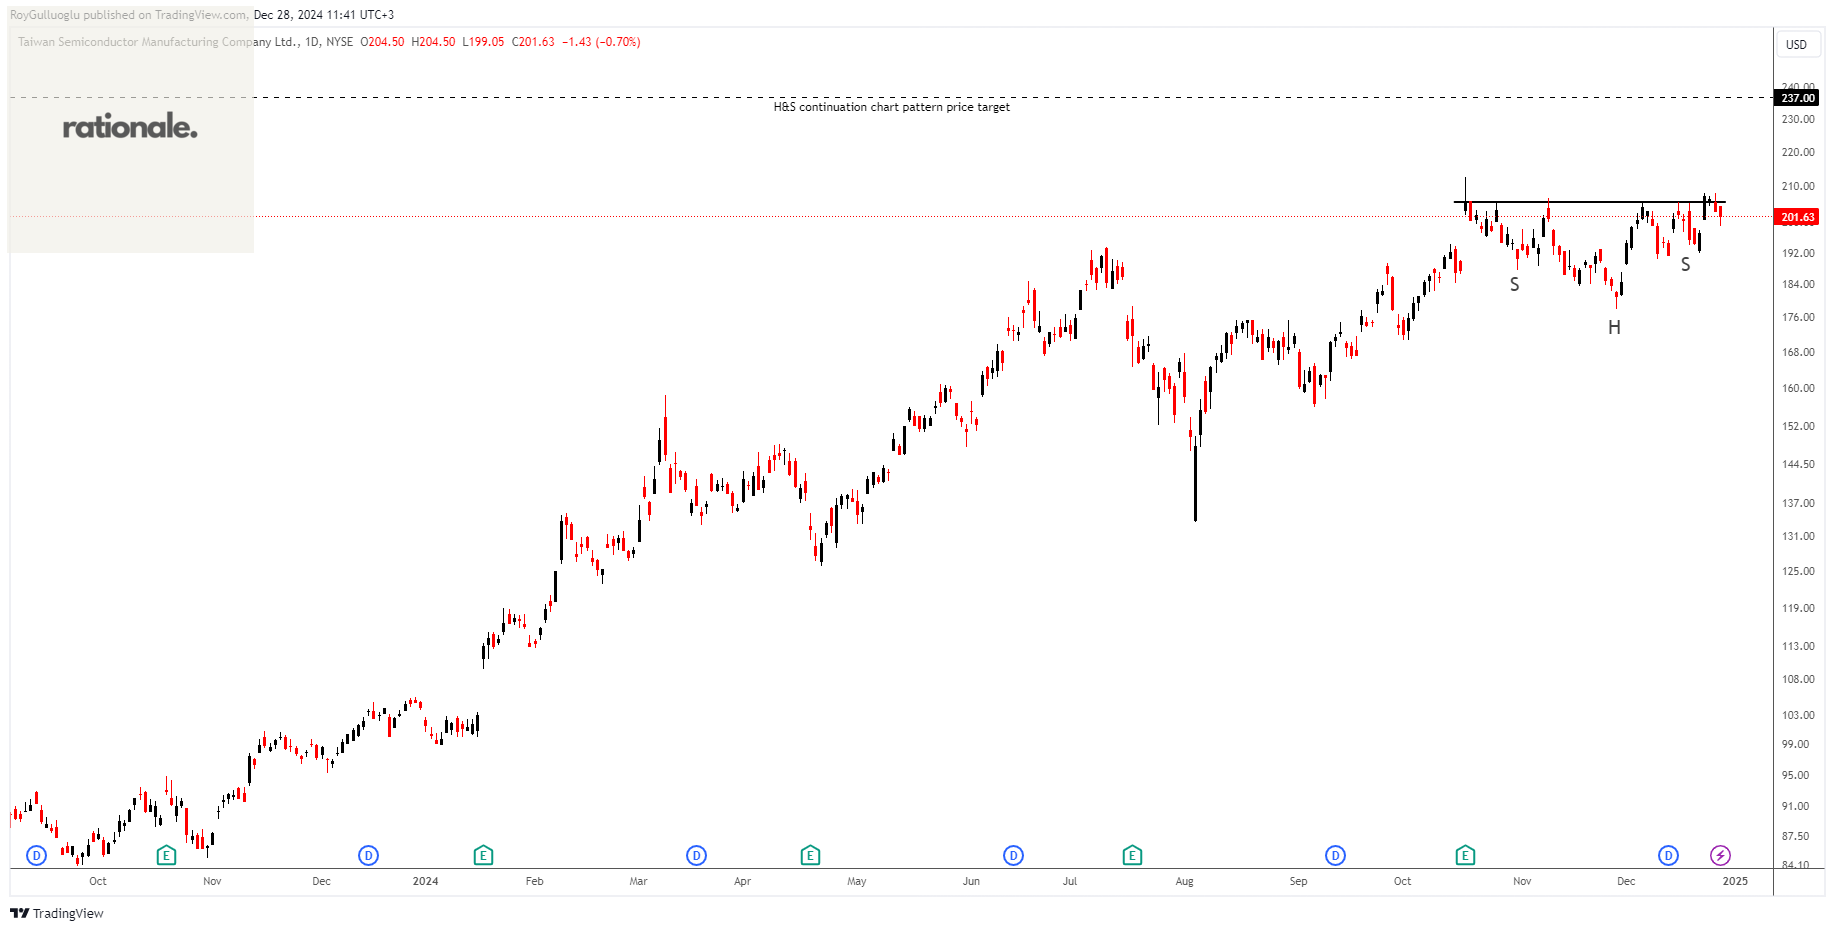
Taiwan Semiconductor Manufacturing Company Limited, together with its subsidiaries, manufactures, packages, tests, and sells integrated circuits and other semiconductor devices in Taiwan, China, Europe, the Middle East, Africa, Japan, the United States, and internationally.
The above daily chart formed an approximately 2-month-long H&S continuation chart pattern as a bullish continuation after an uptrend.
The horizontal boundary at 205.5 levels acts as a resistance within this pattern.
A daily close above 211.6 levels would validate the breakout from the 2-month-long H&S continuation chart pattern.
Based on this chart pattern, the potential price target is 237 levels.
TSM, classified under the "technology" sector, falls under the “Large Cap - Growth” stock category.
Sakata INX Corporation-(4633/TSE)-Long Idea
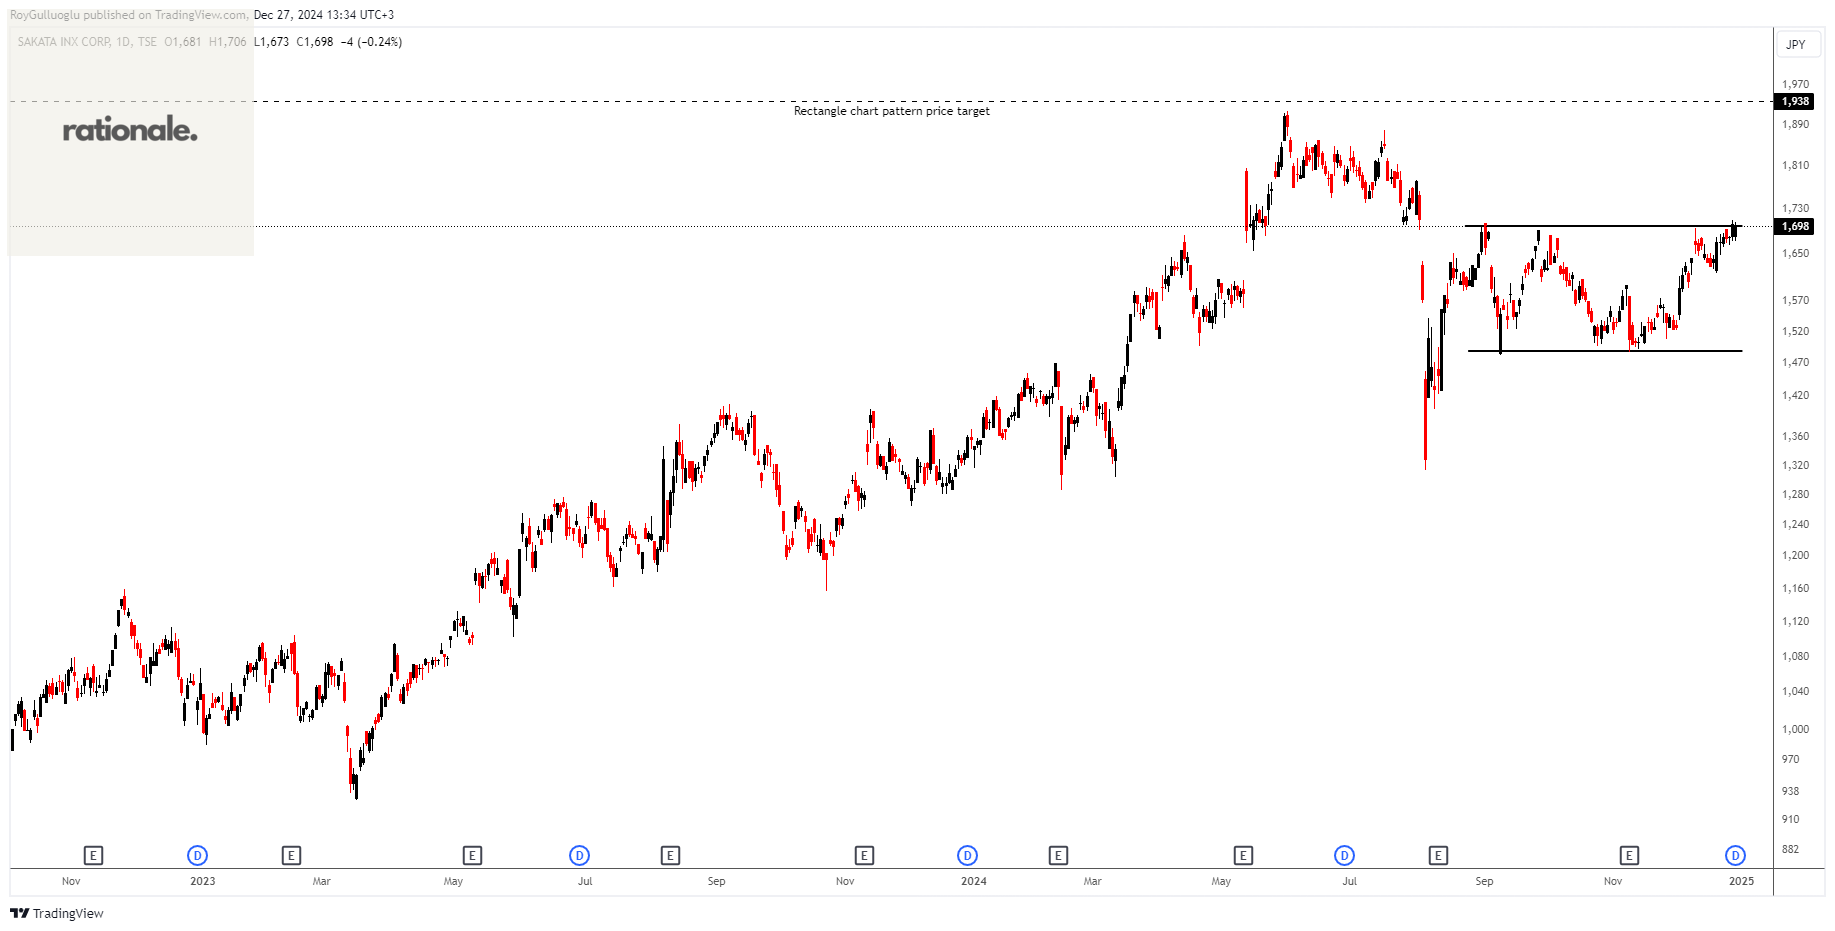
Sakata INX Corporation manufactures and sells various printing inks and auxiliary agents in Japan and internationally.
The above daily chart formed an approximately 3-month-long rectangle chart pattern as a bullish continuation after an uptrend.
The horizontal boundary at 1698 levels acts as a resistance within this pattern.
A daily close above 1749 levels would validate the breakout from the 3-month-long rectangle chart pattern.
Based on this chart pattern, the potential price target is 1938 levels.
4633, classified under the "basic materials" sector, falls under the “Small Cap - Value” stock category.
CyberAgent, Inc.-(4751/TSE)-Long Idea
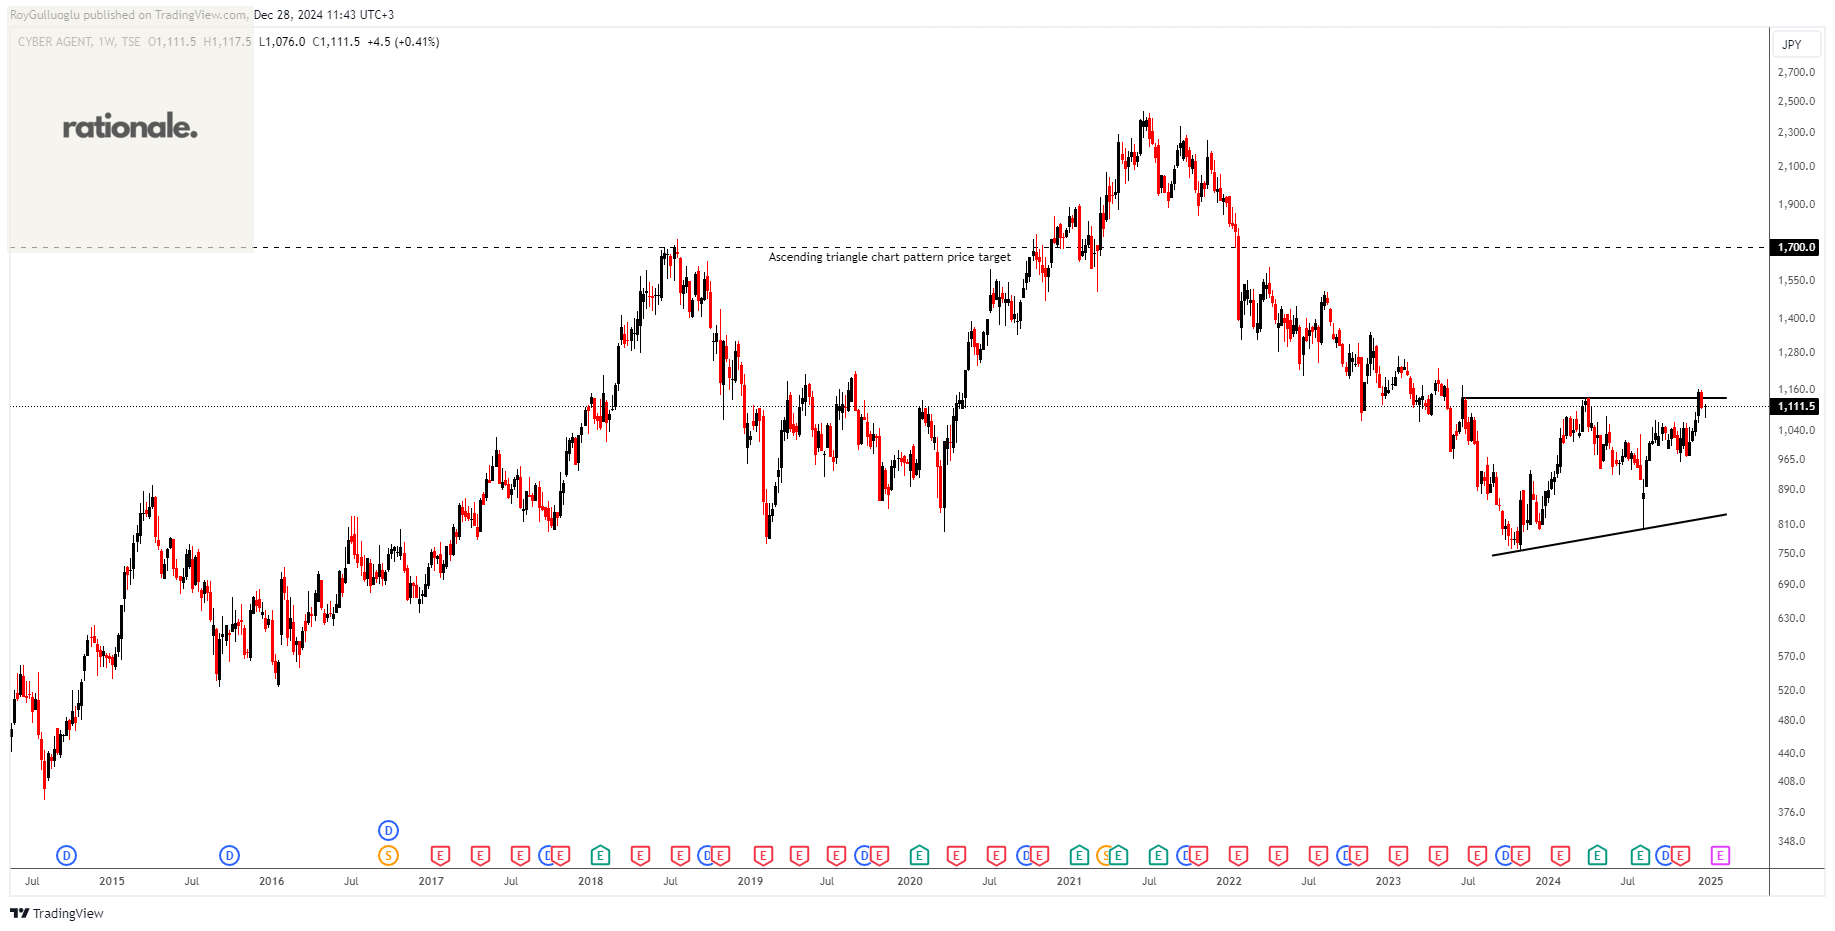
CyberAgent, Inc. engages in the media, internet advertising, game, and investment development businesses primarily in Japan.
The above weekly chart formed an approximately 15-month-long ascending triangle chart pattern as a bullish reversal after a downtrend.
The horizontal boundary at 1135 levels acts as a resistance within this pattern.
A daily close above 1169 levels would validate the breakout from the 15-month-long ascending triangle chart pattern.
Based on this chart pattern, the potential price target is 1700 levels.
4751, classified under the "communication services" sector, falls under the “Mid Cap - Growth” stock category.
Daito Trust Construction Co.,Ltd.i -(1878/TSE)-Long Idea
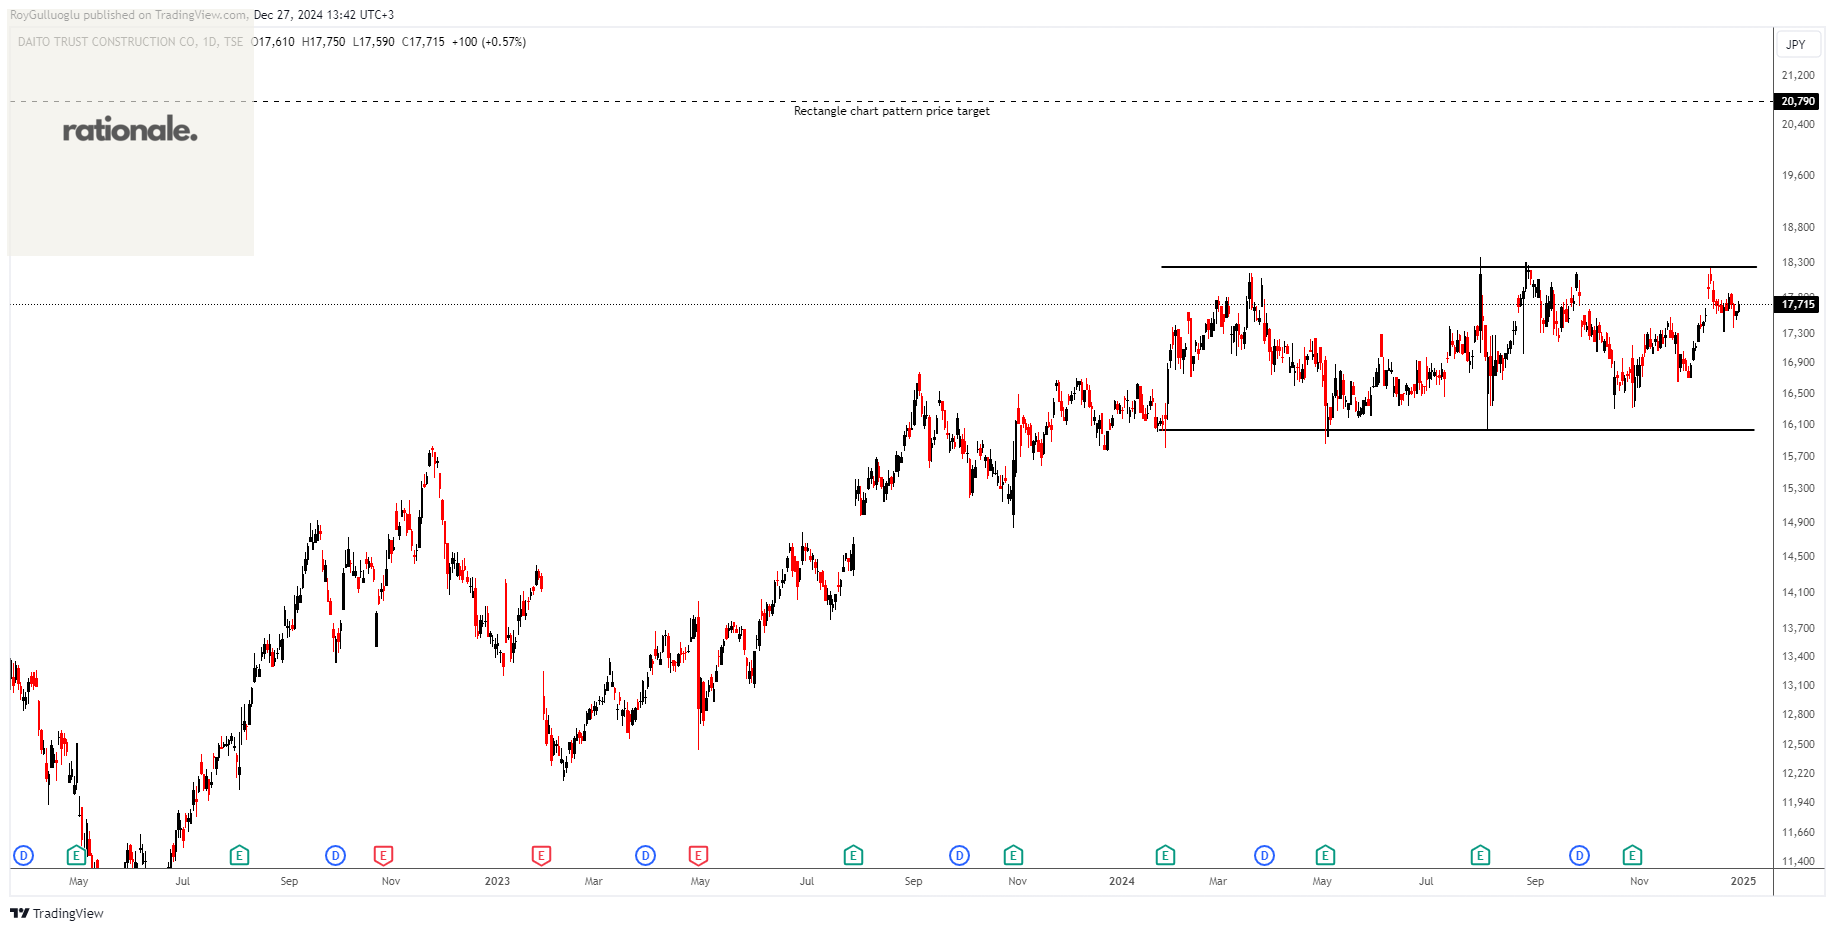
Daito Trust Construction Co.,Ltd. designs, constructs, and rents apartments and condominiums in Japan.
The above daily chart formed an approximately 7-month-long rectangle chart pattern as a bullish continuation after an uptrend.
The horizontal boundary at 18235 levels acts as a resistance within this pattern.
A daily close above 18780 levels would validate the breakout from the 7-month-long rectangle chart pattern.
Based on this chart pattern, the potential price target is 20790 levels.
1878, classified under the "real estate" sector, falls under the “Mid Cap - Income” stock category.
Siemens Limited -(SIEMENS/NSE)-Short Idea
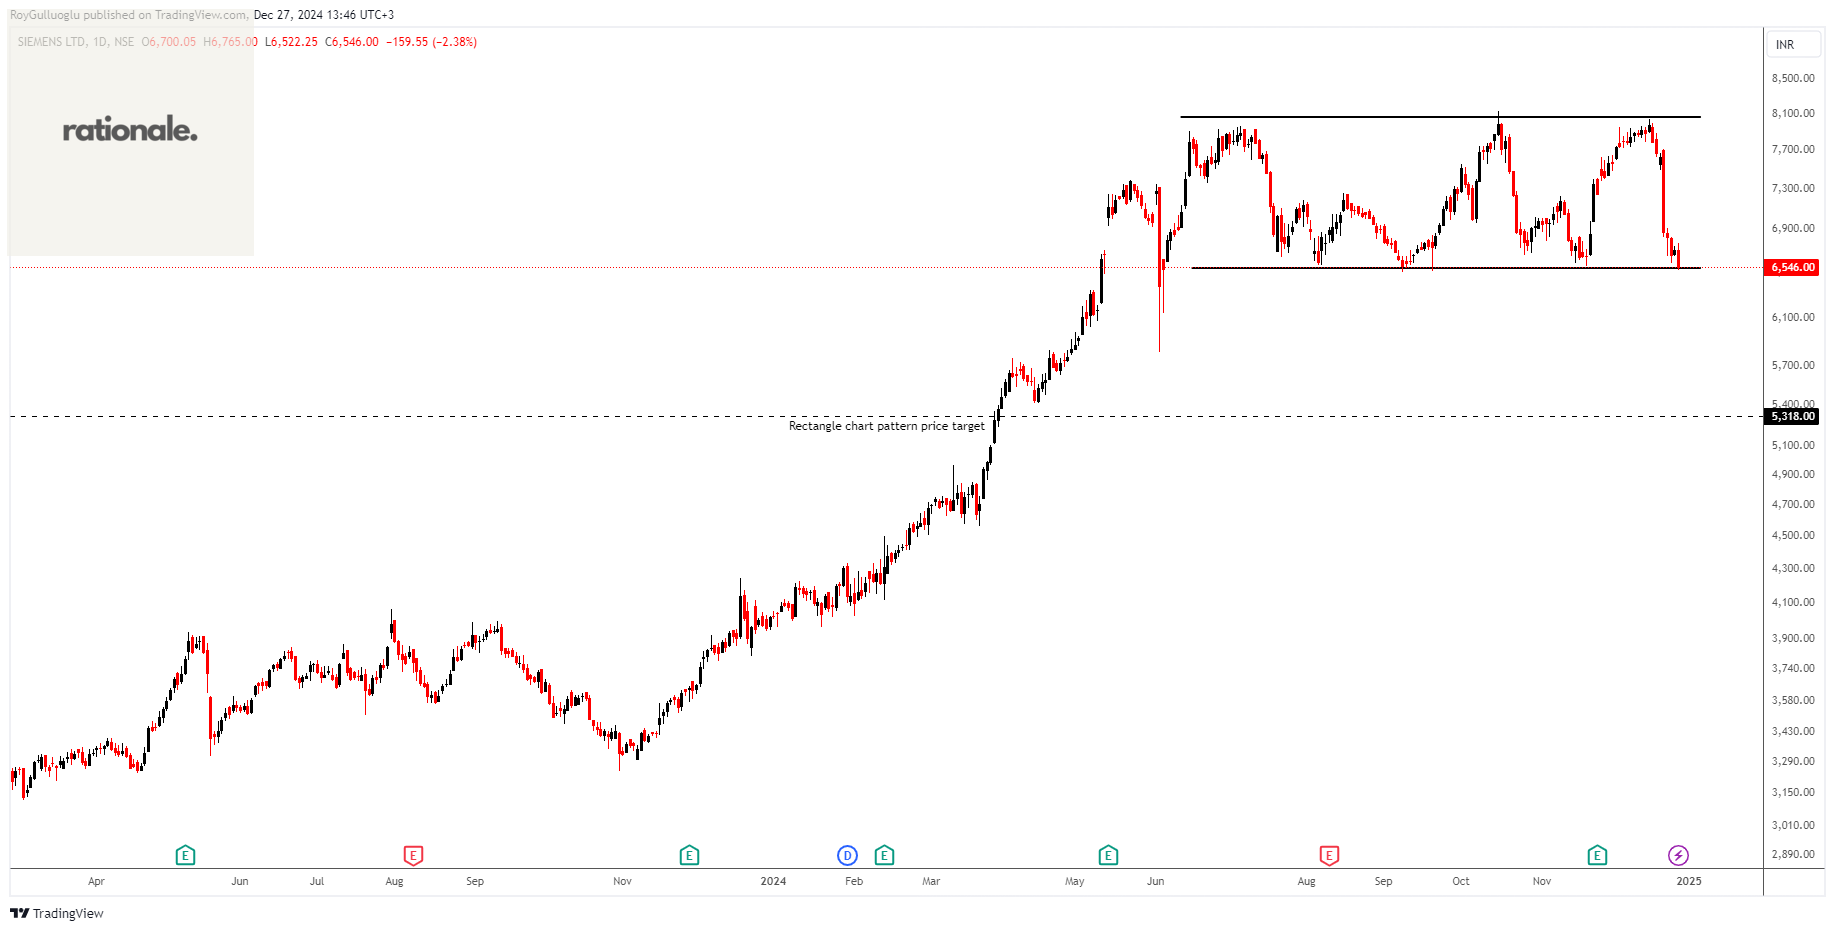
Siemens Limited manufactures and sells electric motors, generators, transformers, electricity distribution and control apparatus, general purpose machinery, and other electrical equipment in India and internationally.
The above daily chart formed an approximately 4-month-long rectangle chart pattern as a bearish reversal after an uptrend.
The horizontal boundary at 6540 levels acts as a support within this pattern.
A daily close below 6343 levels would validate the breakout from the 4-month-long rectangle chart pattern.
Based on this chart pattern, the potential price target is 5318 levels.
SIEMENS, classified under the "industrials" sector, falls under the “Large Cap - Value” stock category.