

Trade Ideas Equities
ON(NASDAQ), ENTG(NASDAQ), INDIANB(NSE), ISCTR(BIST), TSKB(BIST), KOZAA(BIST)

ON Semiconductor Corporation-(ON/NASDAQ)-Short Idea
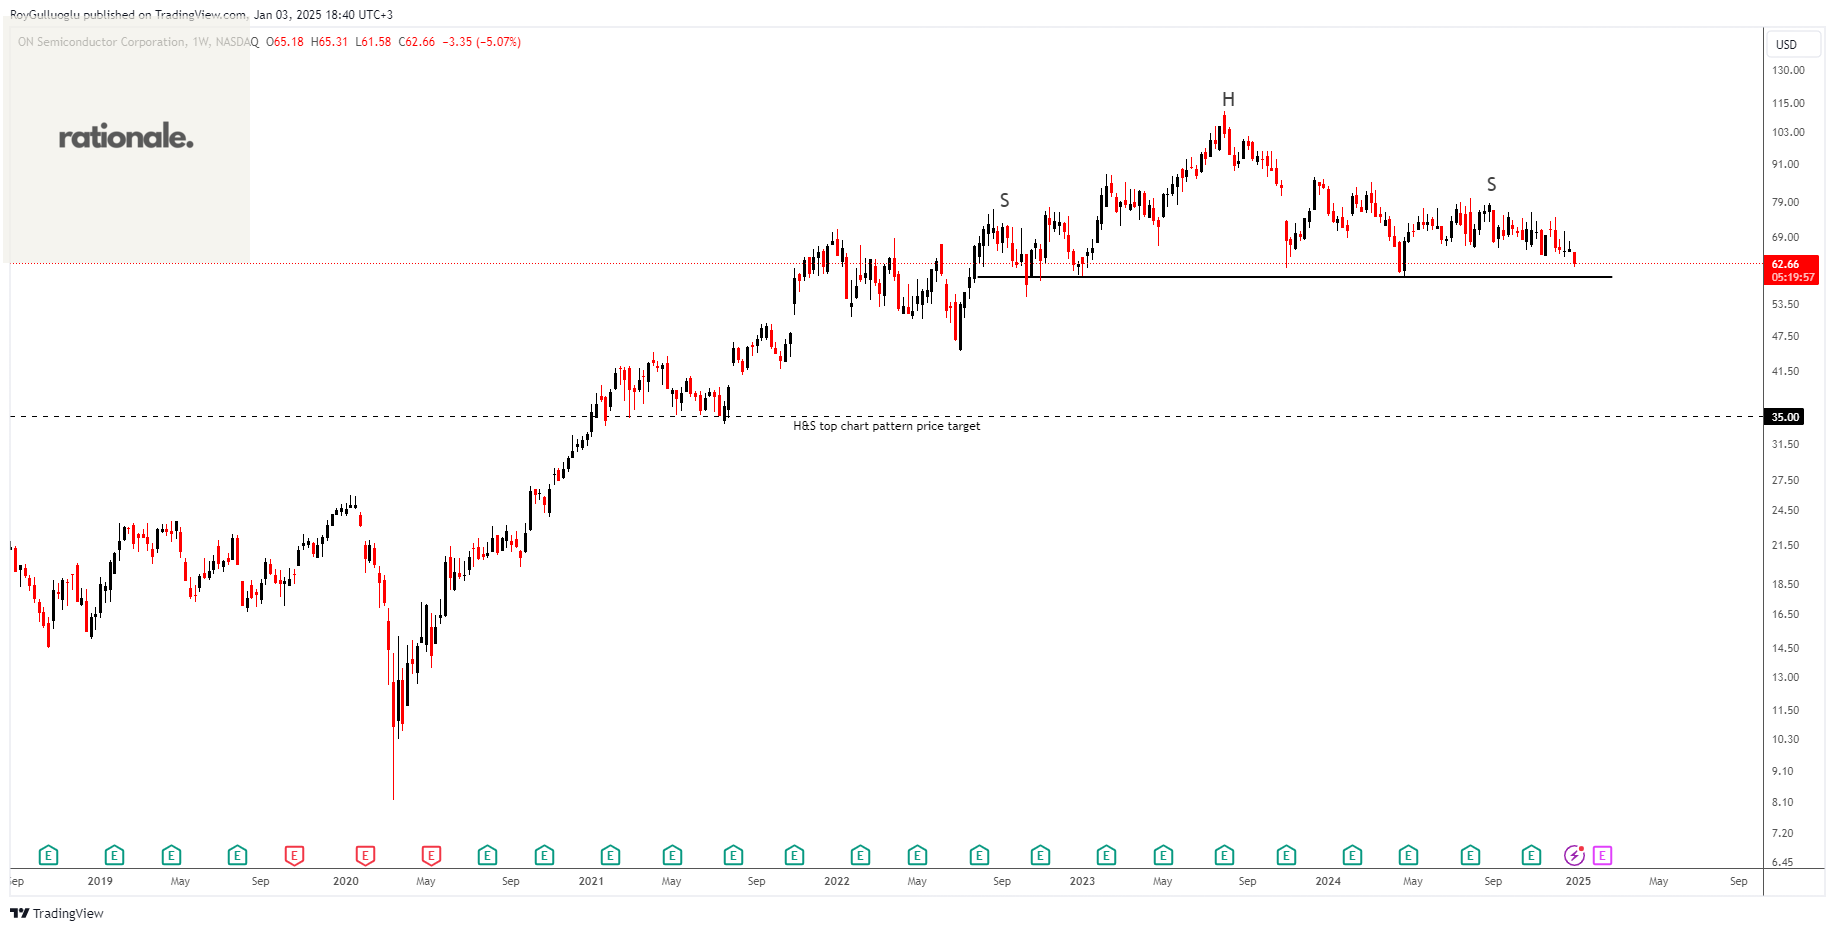
ON Semiconductor Corporation provides intelligent sensing and power solutions in the United States and internationally.
The above weekly chart formed an approximately 32-month-long H&S top chart pattern as a bearish reversal after an uptrend.
The horizontal boundary at 59.3 levels acts as a support within this pattern.
A daily close below 57.5 levels would validate the breakout from the 32-month-long H&S top chart pattern.
Based on this chart pattern, the potential price target is 35 levels.
ON, classified under the "technology" sector, falls under the “Mid Cap - Growth” stock category
Entegris, Inc.-(ENTG/NASDAQ)-Short Idea
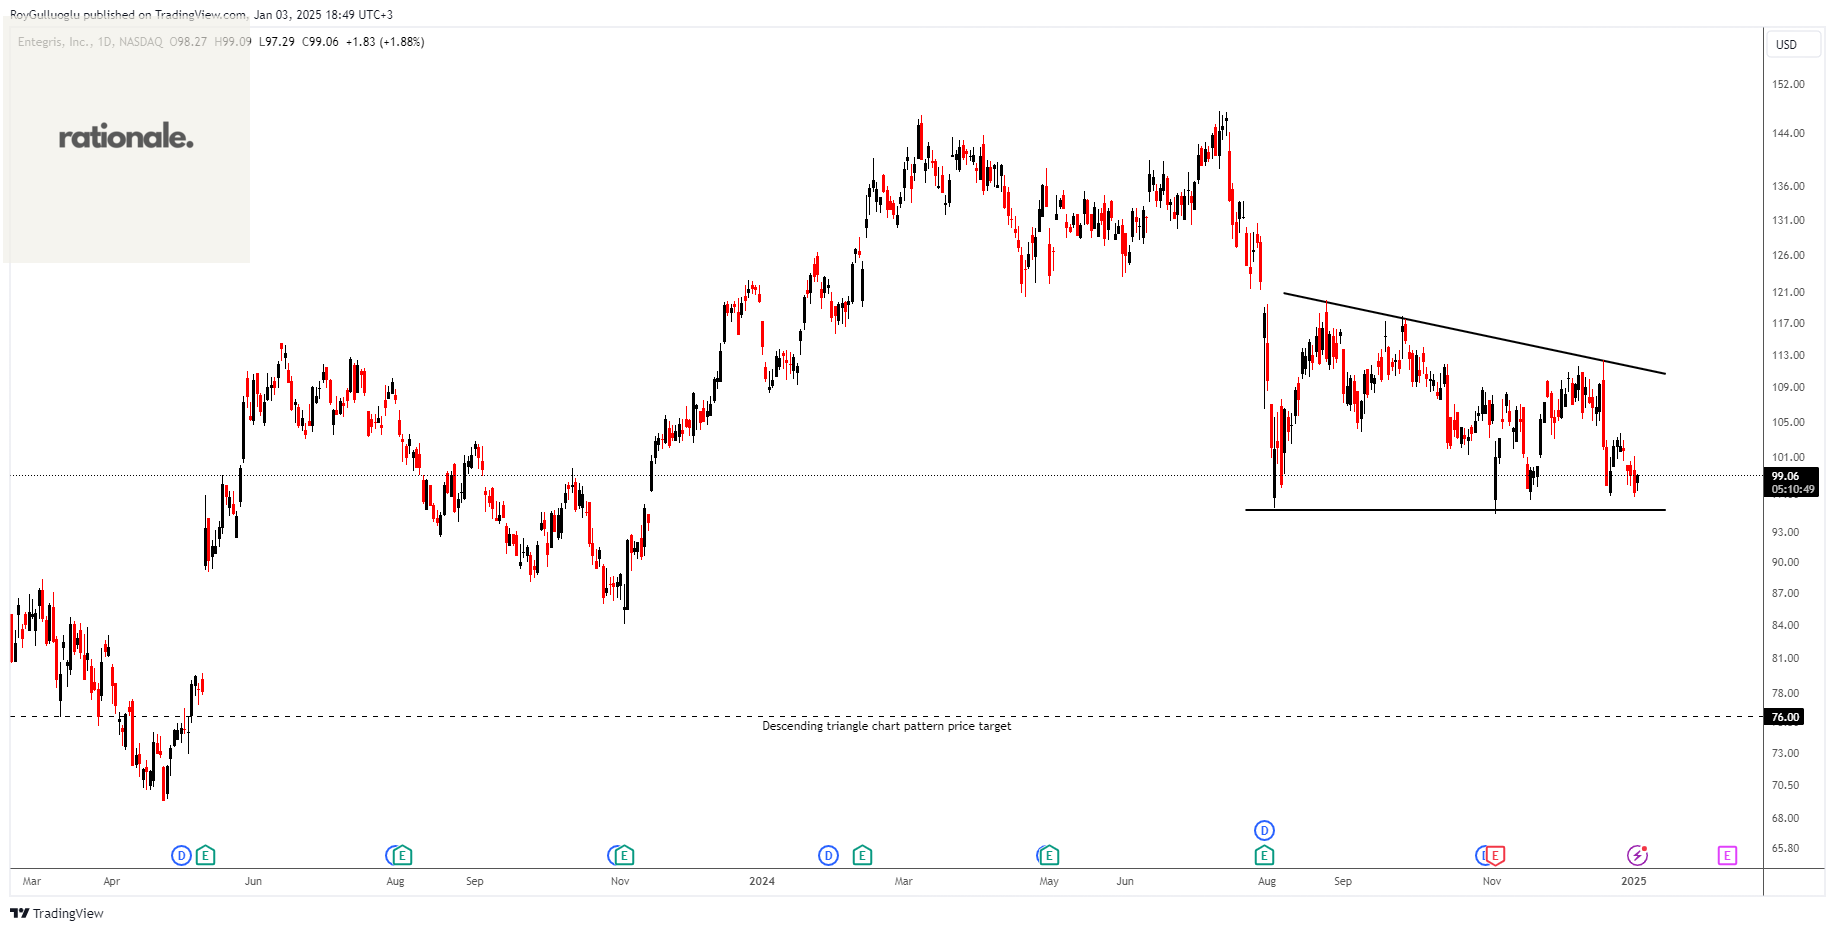
Entegris, Inc. develops, manufactures, and supplies microcontamination control products, specialty chemicals, and advanced materials handling solutions in North America, Taiwan, China, South Korea, Japan, Europe, and Southeast Asia.
The above daily chart formed an approximately 3-month-long descending triangle chart pattern as a bearish reversal after an uptrend.
The horizontal boundary at 95.35 levels acts as a support within this pattern.
A daily close below 92.5 levels would validate the breakout from the 2-month-long descending triangle chart pattern.
Based on this chart pattern, the potential price target is 76 levels.
ENTG, classified under the "technology" sector, falls under the “Large Cap - Growth” stock category.
Indian Bank -(INDIANB/NSE)-Short Idea
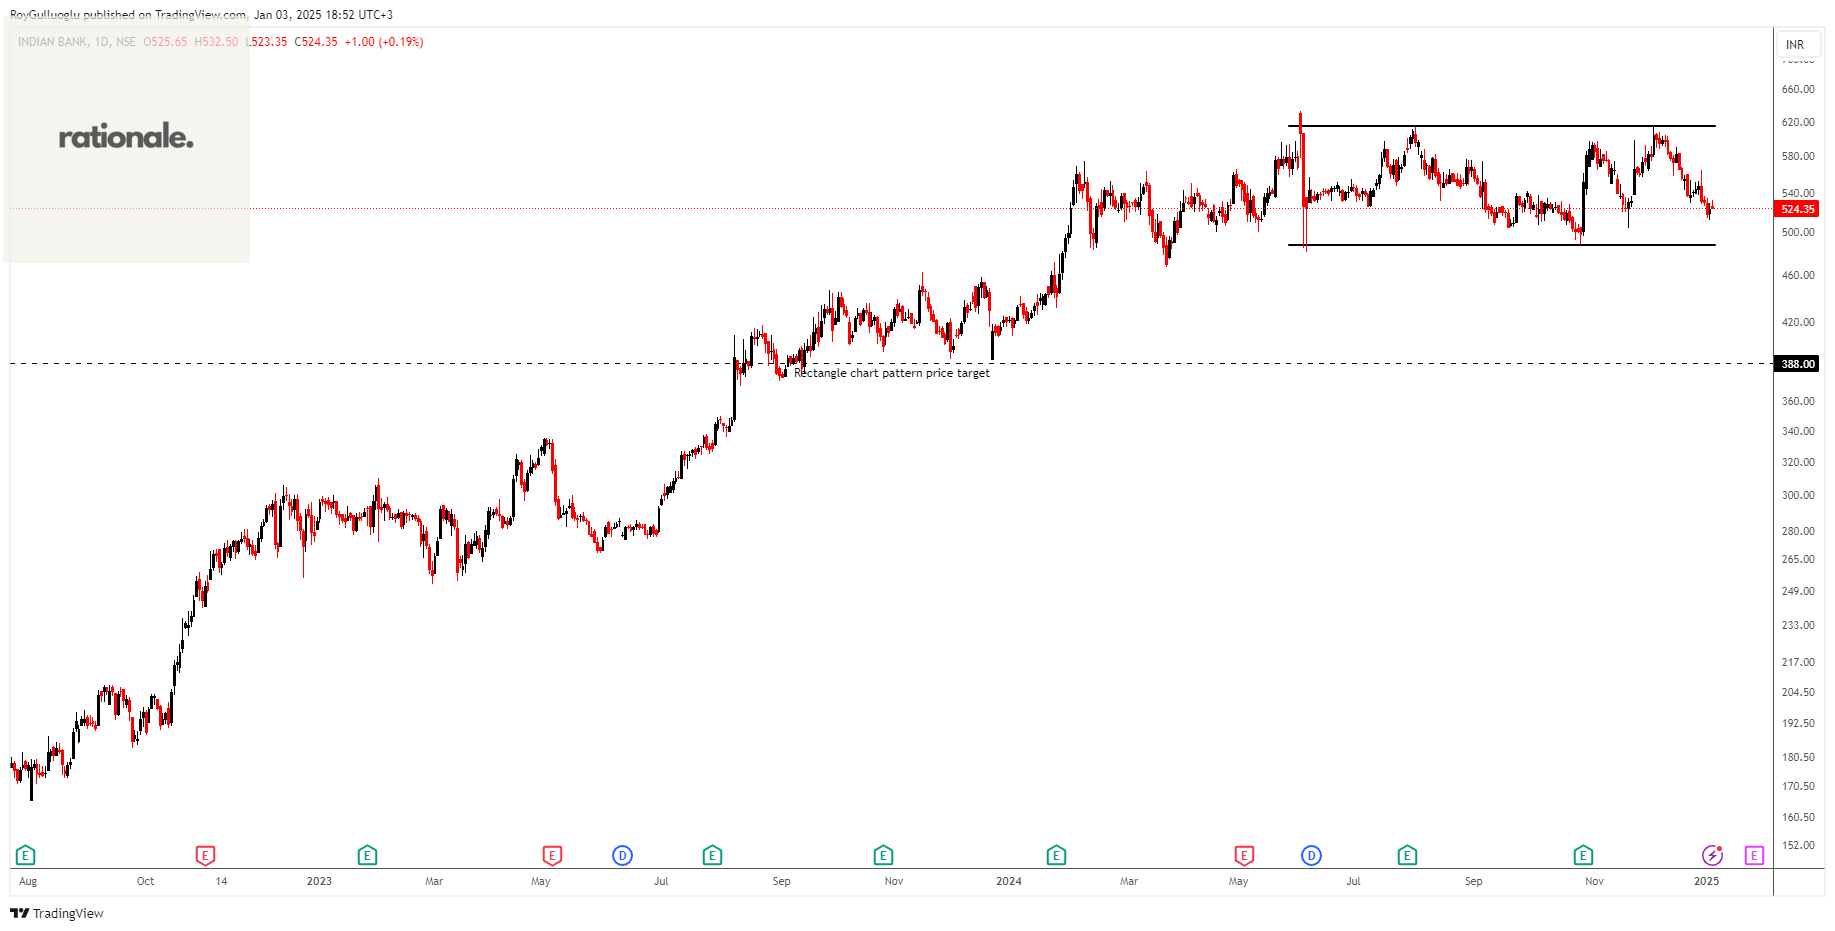
Indian Bank provides various banking products and services. The company offers deposit products, including savings bank and current accounts, term deposits, and non resident Indian (NRI) accounts.
The above daily chart formed an approximately 5-month-long rectangle chart pattern as a bearish reversal after an uptrend.
The horizontal boundary at 487.35 levels acts as a support within this pattern.
A daily close below 472.73 levels would validate the breakout from the 5-month-long rectangle chart pattern.
Based on this chart pattern, the potential price target is 388 levels.
INDIANB, classified under the "financial services" sector, falls under the “Mid Cap - Income” stock category.
Türkiye Is Bankasi A.S.-(ISCTR/BIST)-Long Idea
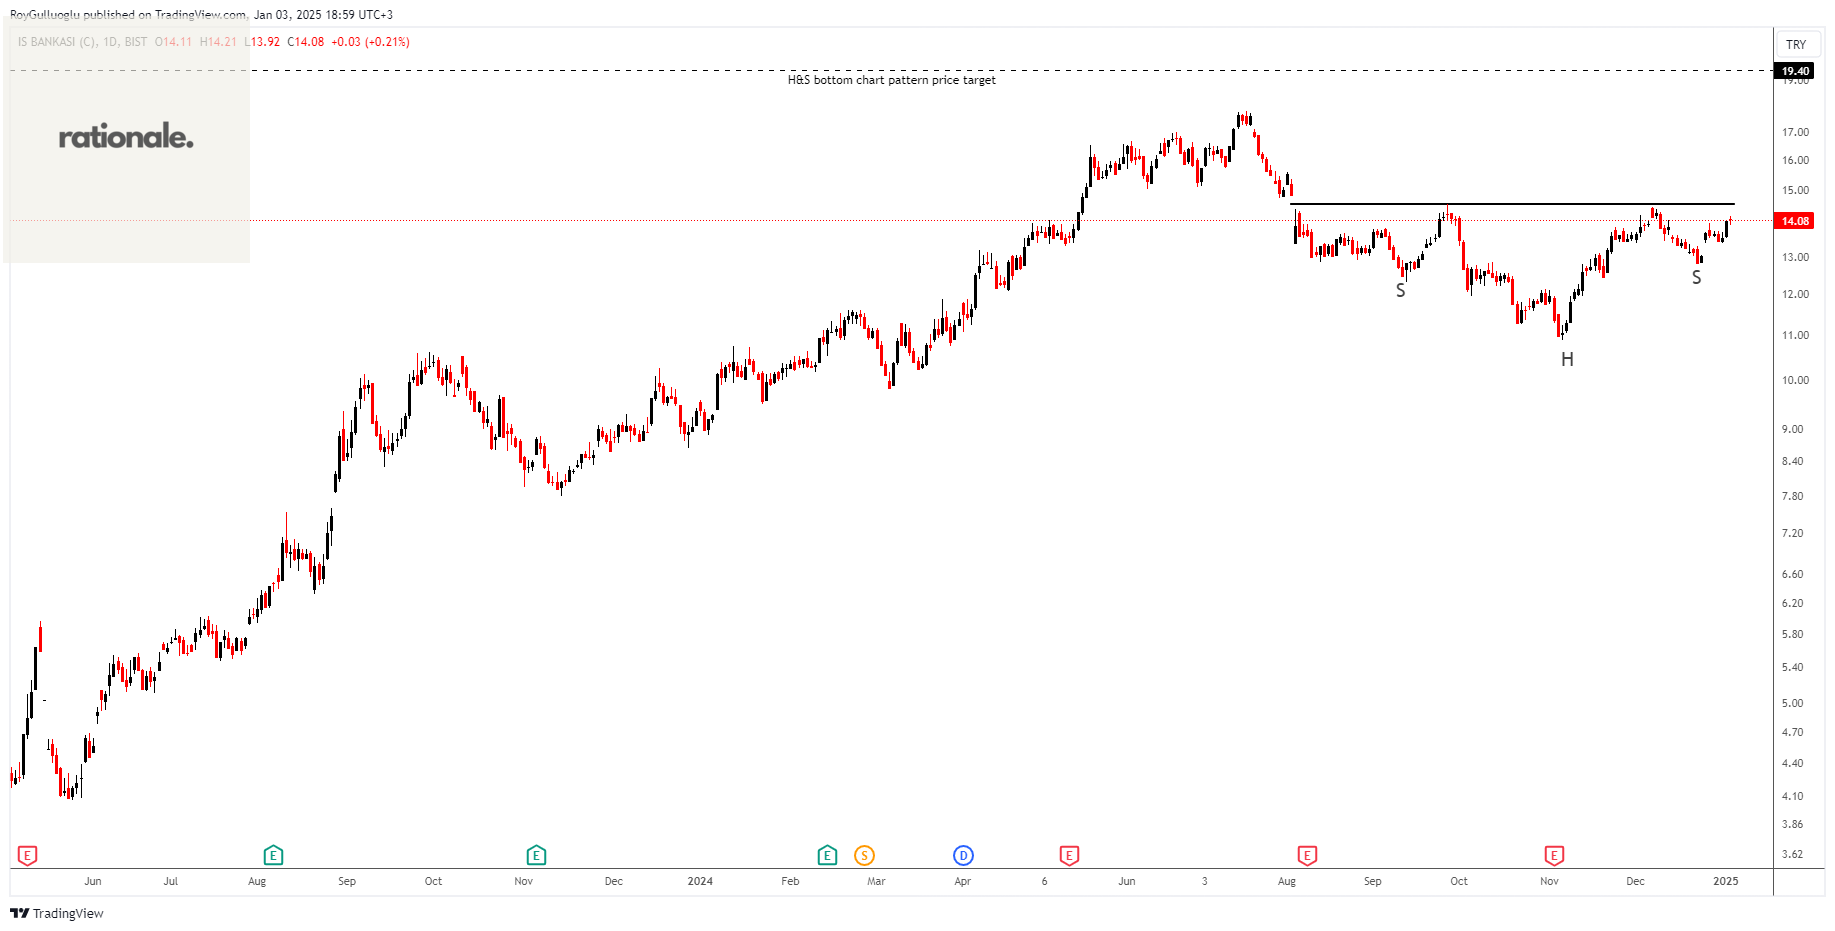
Türkiye Is Bankasi A.S. provides various banking products and services in Turkey. The company offers personal, car, house, cash, and non-cash loans; debit and credit cards; and deposit and investment products and services, such as mutual funds, gold, term deposits, non-term deposits, debt instruments, equities, warrants, eurobonds, and futures and options market services.
The above daily chart formed an approximately 3-month-long H&S continuation chart pattern as a bullish continuation after an uptrend.
The horizontal boundary at 14.55 levels acts as a resistance within this pattern.
A daily close above 15 levels would validate the breakout from the 3-month-long H&S continuation chart pattern.
Based on this chart pattern, the potential price target is 19.4 levels.
ISCTR, classified under the "financial services" sector, falls under the “Mid Cap - Income” stock category.
Türkiye Sinai Kalkinma Bankasi A.S. -(TSKB/BIST)-Long Idea
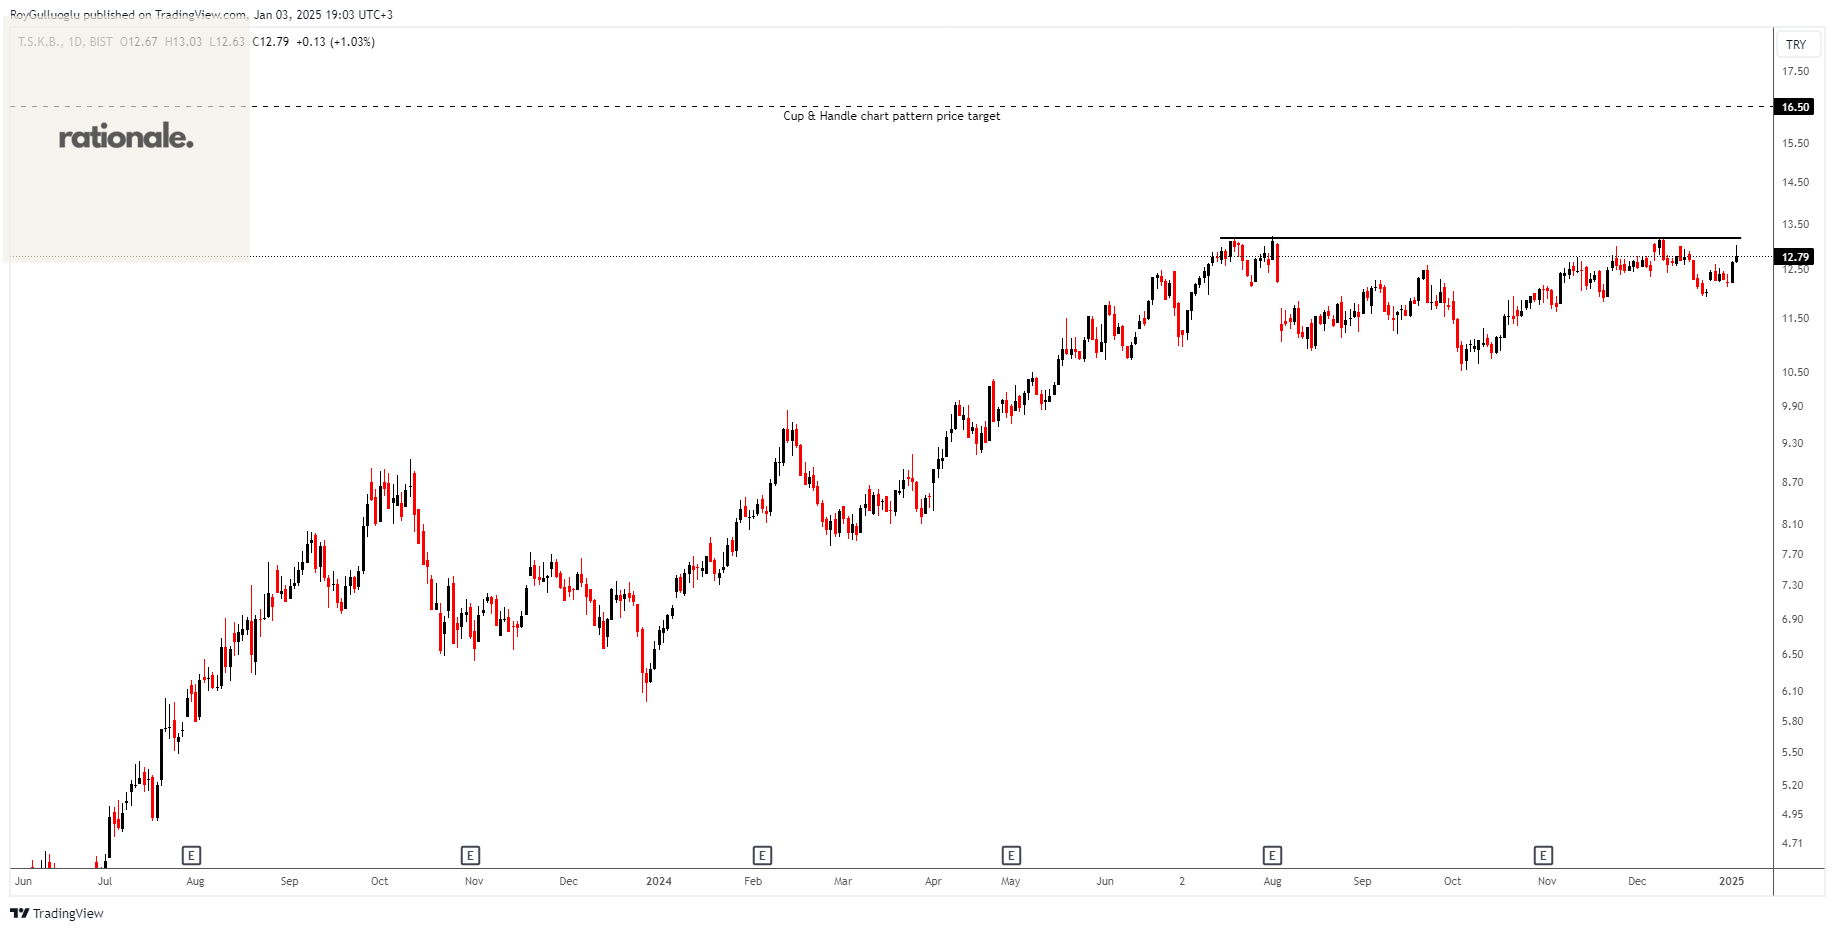
Türkiye Sinai Kalkinma Bankasi A.S. operates as a development and investment bank in Turkey and internationally.
The above daily chart formed an approximately 4-month-long Cup & Handle chart pattern as a bullish continuation after an uptrend.
The horizontal boundary at 13.18 levels acts as a resistance within this pattern.
A daily close above 13.58 levels would validate the breakout from the 4-month-long Cup & Handle chart pattern.
Based on this chart pattern, the potential price target is 16.5 levels.
TSKB, classified under the "financial services" sector, falls under the “Small Cap - Income” stock category.
Koza Anadolu Metal Madencilik Isletmeleri A.S.-(KOZAA/BIST)-Long Idea
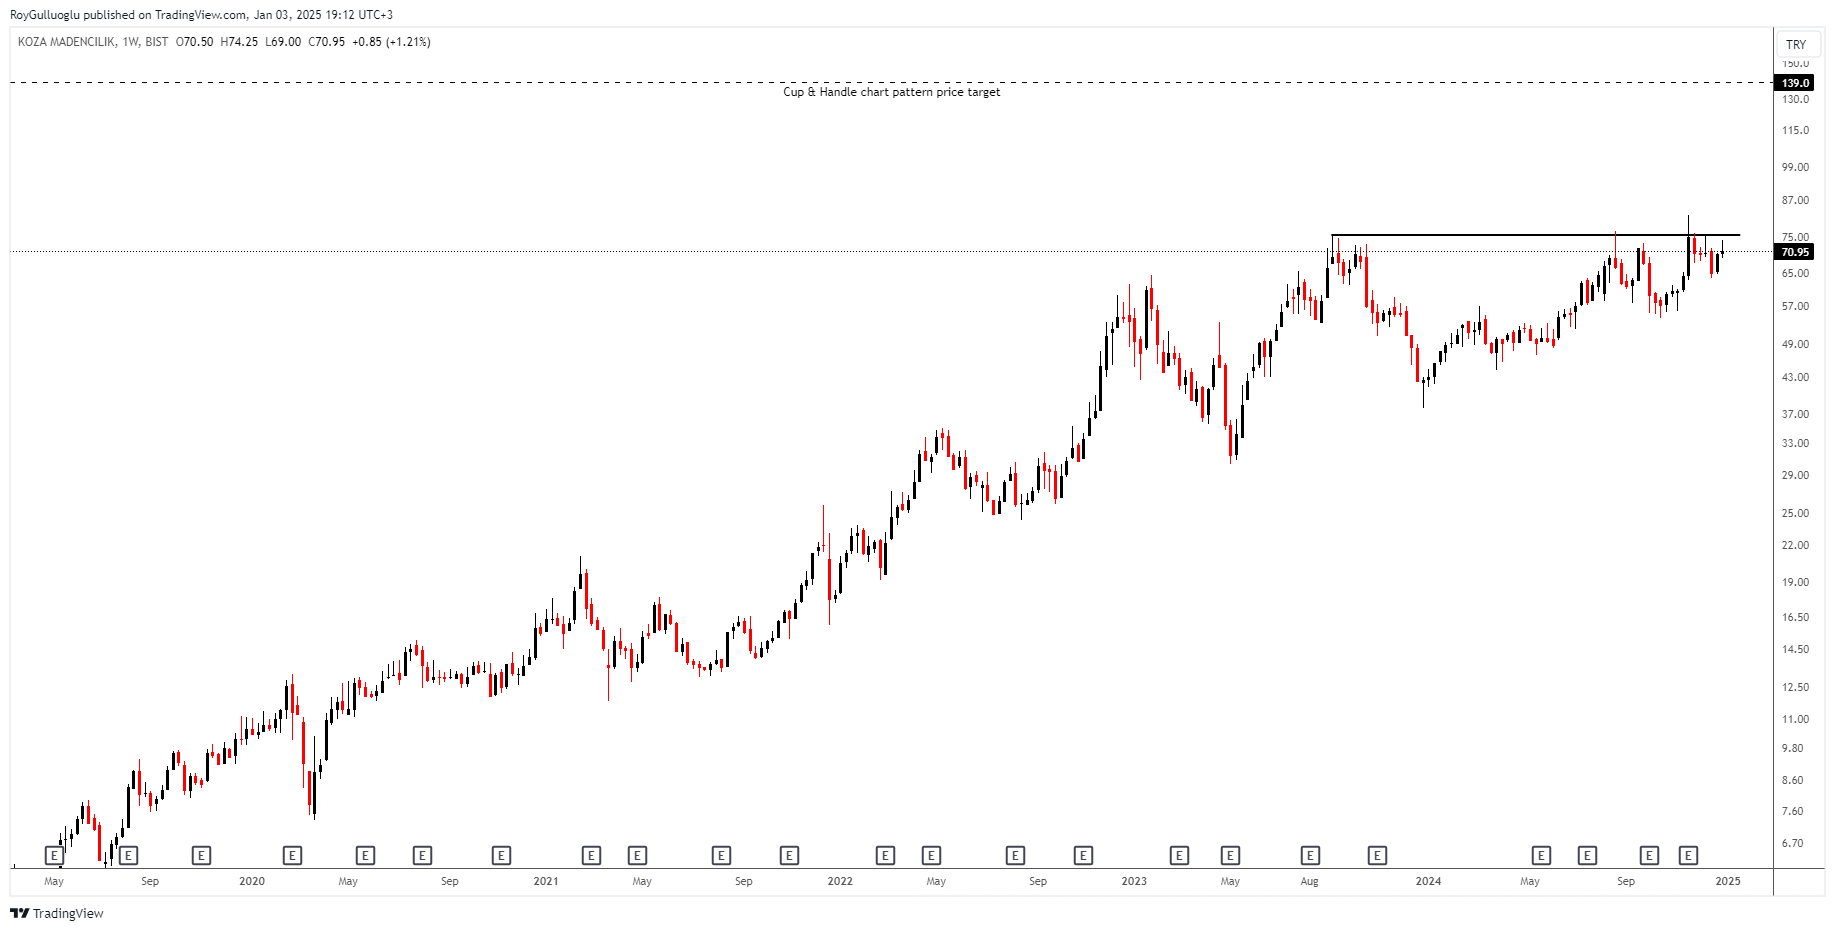
Koza Anadolu Metal Madencilik Isletmeleri A.S., together with its subsidiaries, engages in the mining activities in Turkey.
The above daily chart formed an approximately 3-month-long Cup & Handle chart pattern as a bullish continuation after an uptrend.
The horizontal boundary at 75.65 levels acts as a resistance within this pattern.
A daily close above 77.92 levels would validate the breakout from the 3-month-long Cup & Handle chart pattern.
Based on this chart pattern, the potential price target is 139 levels.
KOZAA, classified under the "basic materials" sector, falls under the “Small Cap - Value” stock category.
Thanks🙏