


Plains GP Holdings, L.P. -(PAGP/NASDAQ)-Long Idea
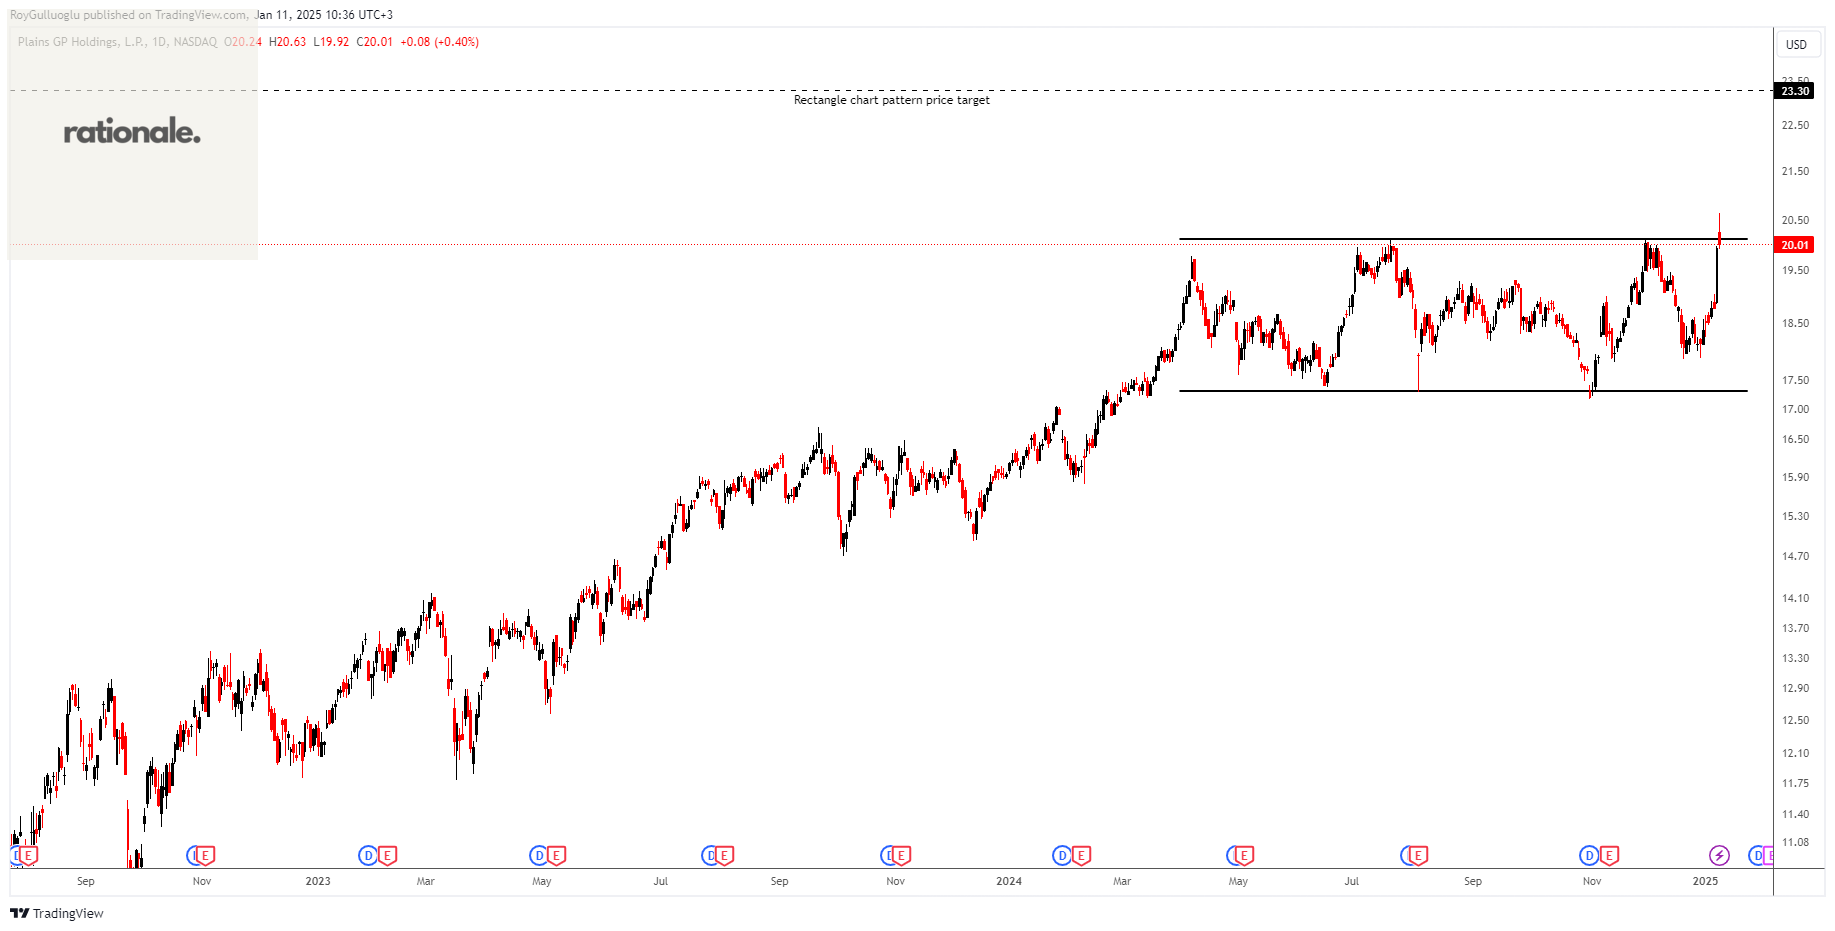
Plains GP Holdings, L.P., through its subsidiary, Plains All American Pipeline, L.P., owns and operates midstream infrastructure systems in the United States and Canada.
The above daily chart formed an approximately 6-month-long rectangle chart pattern as a bullish continuation after an uptrend.
The horizontal boundary at 20.1 levels acts as a resistance within this pattern.
A daily close above 20.7 levels would validate the breakout from the 6-month-long rectangle chart pattern.
Based on this chart pattern, the potential price target is 23.3 levels.
PANG, classified under the "energy" sector, falls under the “Mid Cap - Income” stock category.
Fidus Investment Corporation -(FDUS/NASDAQ)-Long Idea
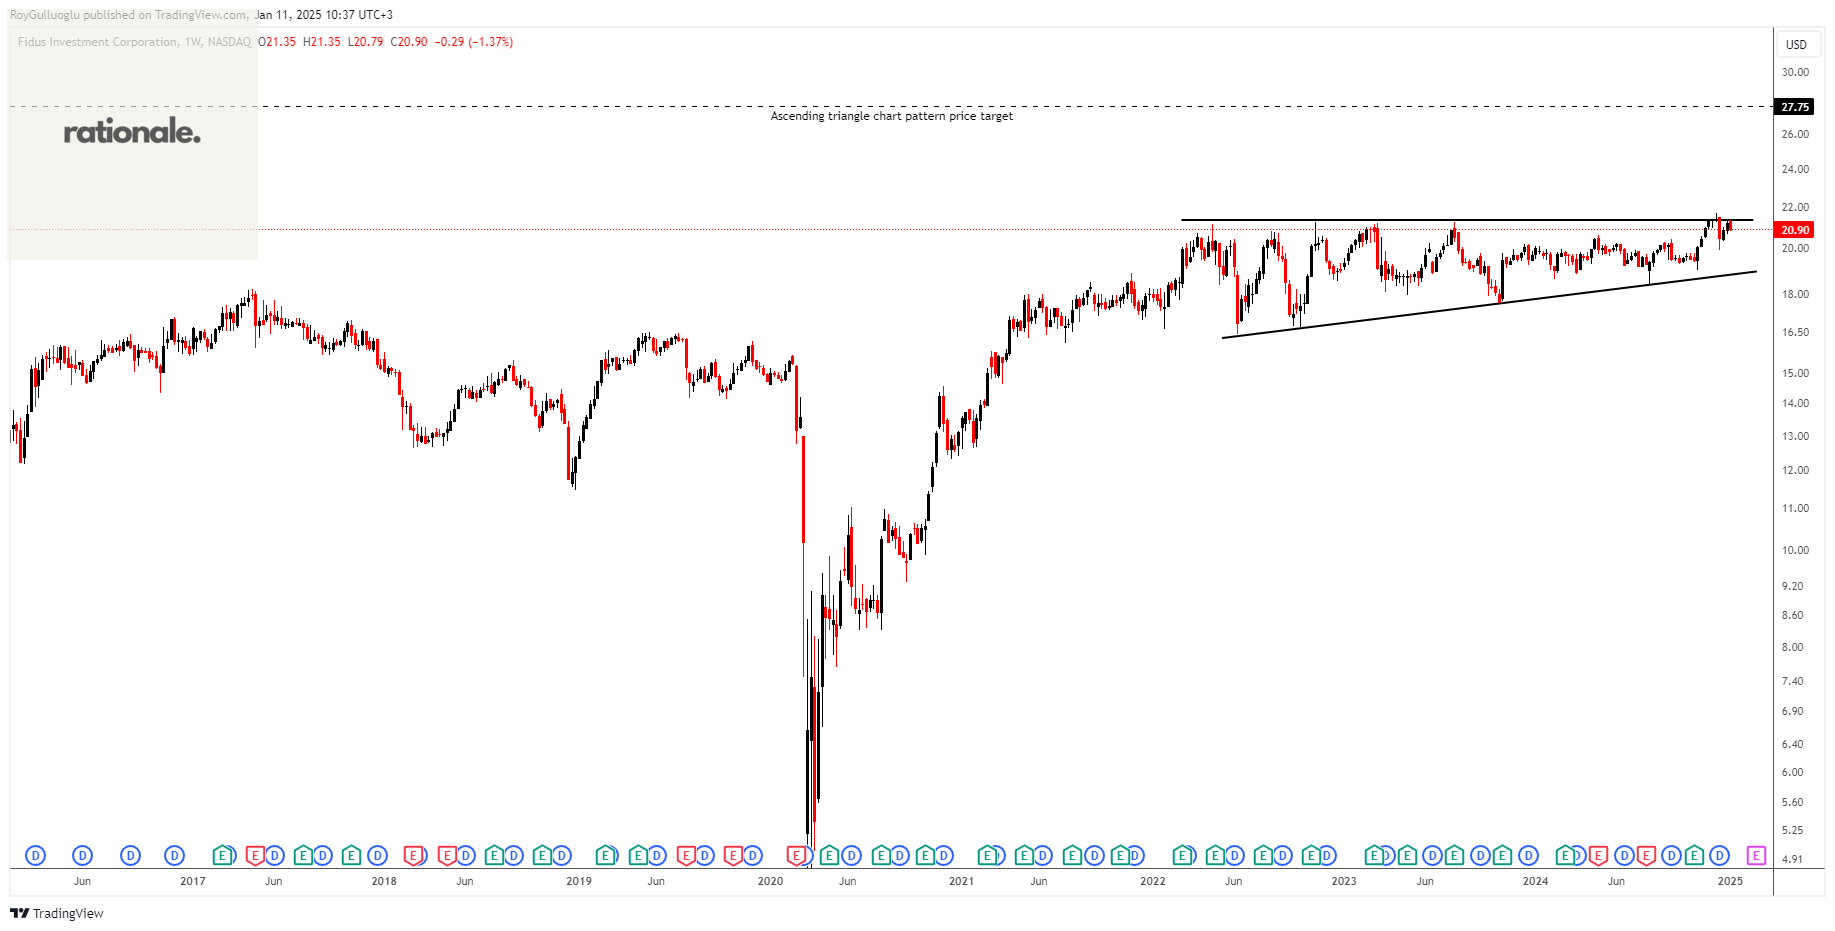
Fidus Investment Corporation is a business development company.
The above weekly chart formed an approximately 36-month-long ascending triangle chart pattern as a bullish continuation after an uptrend.
The horizontal boundary at 21.32 levels acts as a support within this pattern.
A daily close above 21.95 levels would validate the breakout from the 36-month-long ascending triangle chart pattern.
Based on this chart pattern, the potential price target is 27.75 levels.
FDUS, classified under the "financial services" sector, falls under the “Small Cap - Income” stock category.
BridgeBio Pharma, Inc.-(BBIO/NASDAQ)-Long Idea
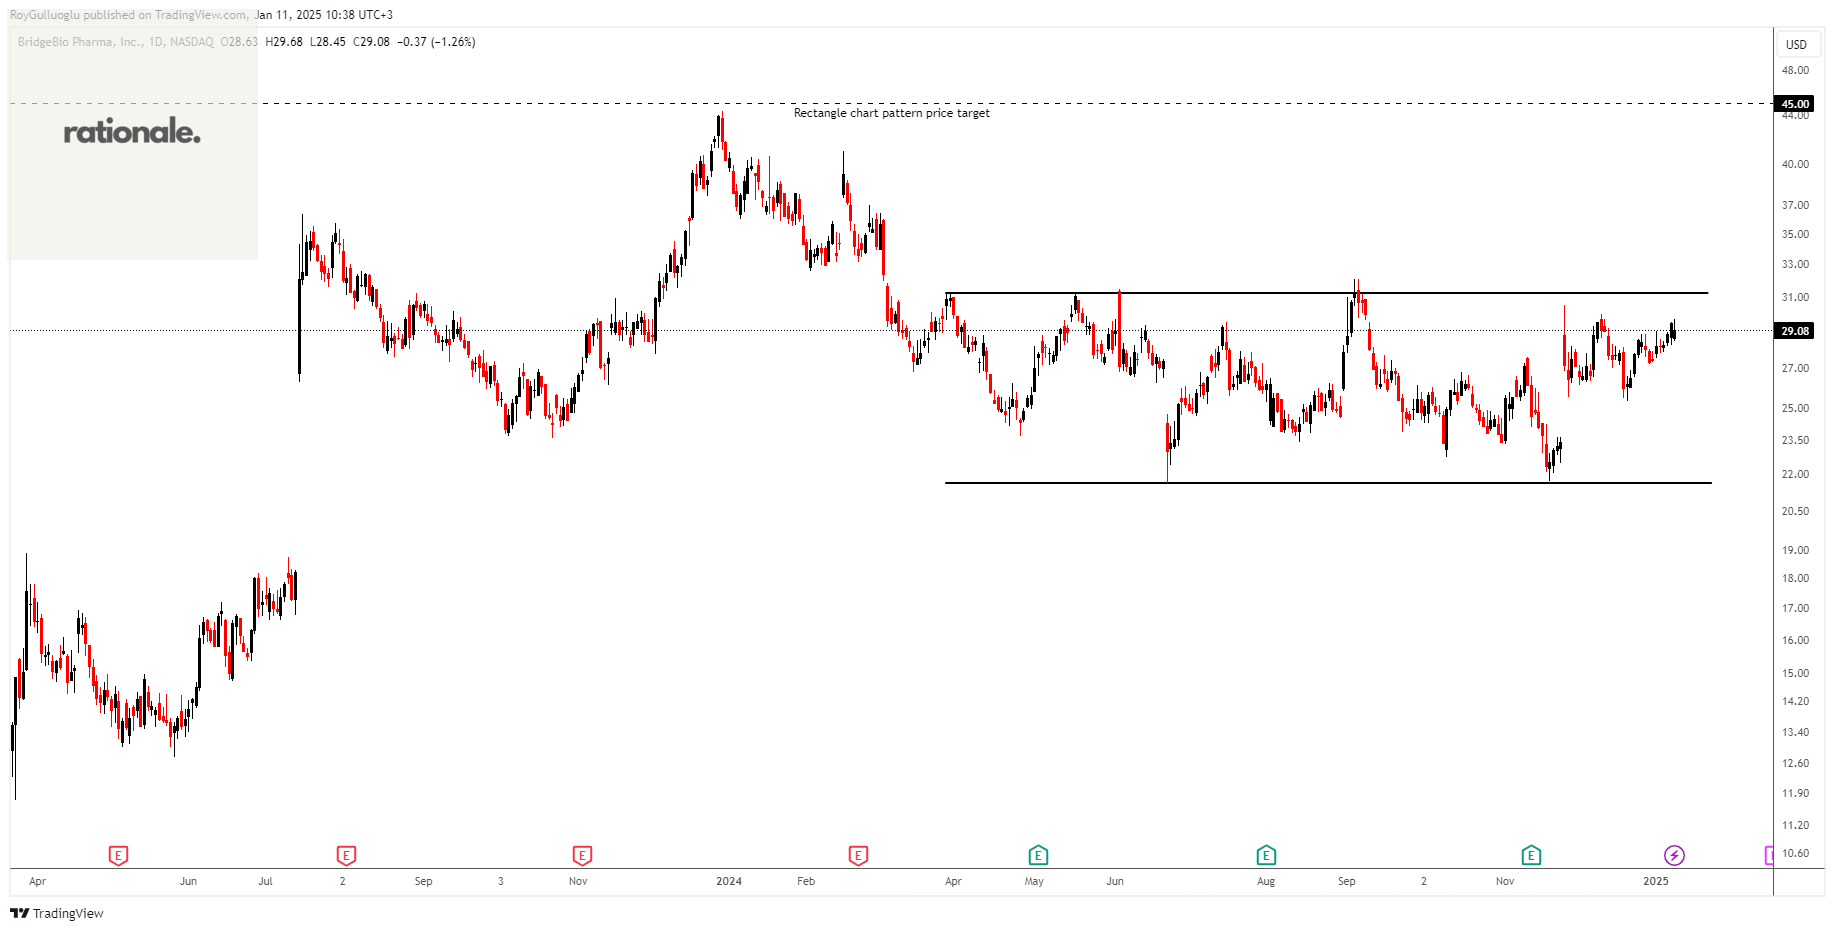
BridgeBio Pharma, Inc., a commercial-stage biopharmaceutical company, discovers, creates, tests, and delivers transformative medicines to treat patients who suffer from genetic diseases and cancers.
The above daily chart formed an approximately 6-month-long rectangle chart pattern as a bullish reversal after a downtrend.
The horizontal boundary at 31.23 levels acts as a resistance within this pattern.
A daily close above 32.17 levels would validate the breakout from the 6-month-long rectangle chart pattern.
Based on this chart pattern, the potential price target is 45 levels.
BBIO, classified under the "healthcare" sector, falls under the “Mid Cap - Value” stock category.
Daiseki Co.,Ltd. -(9793/TSE)-Long Idea
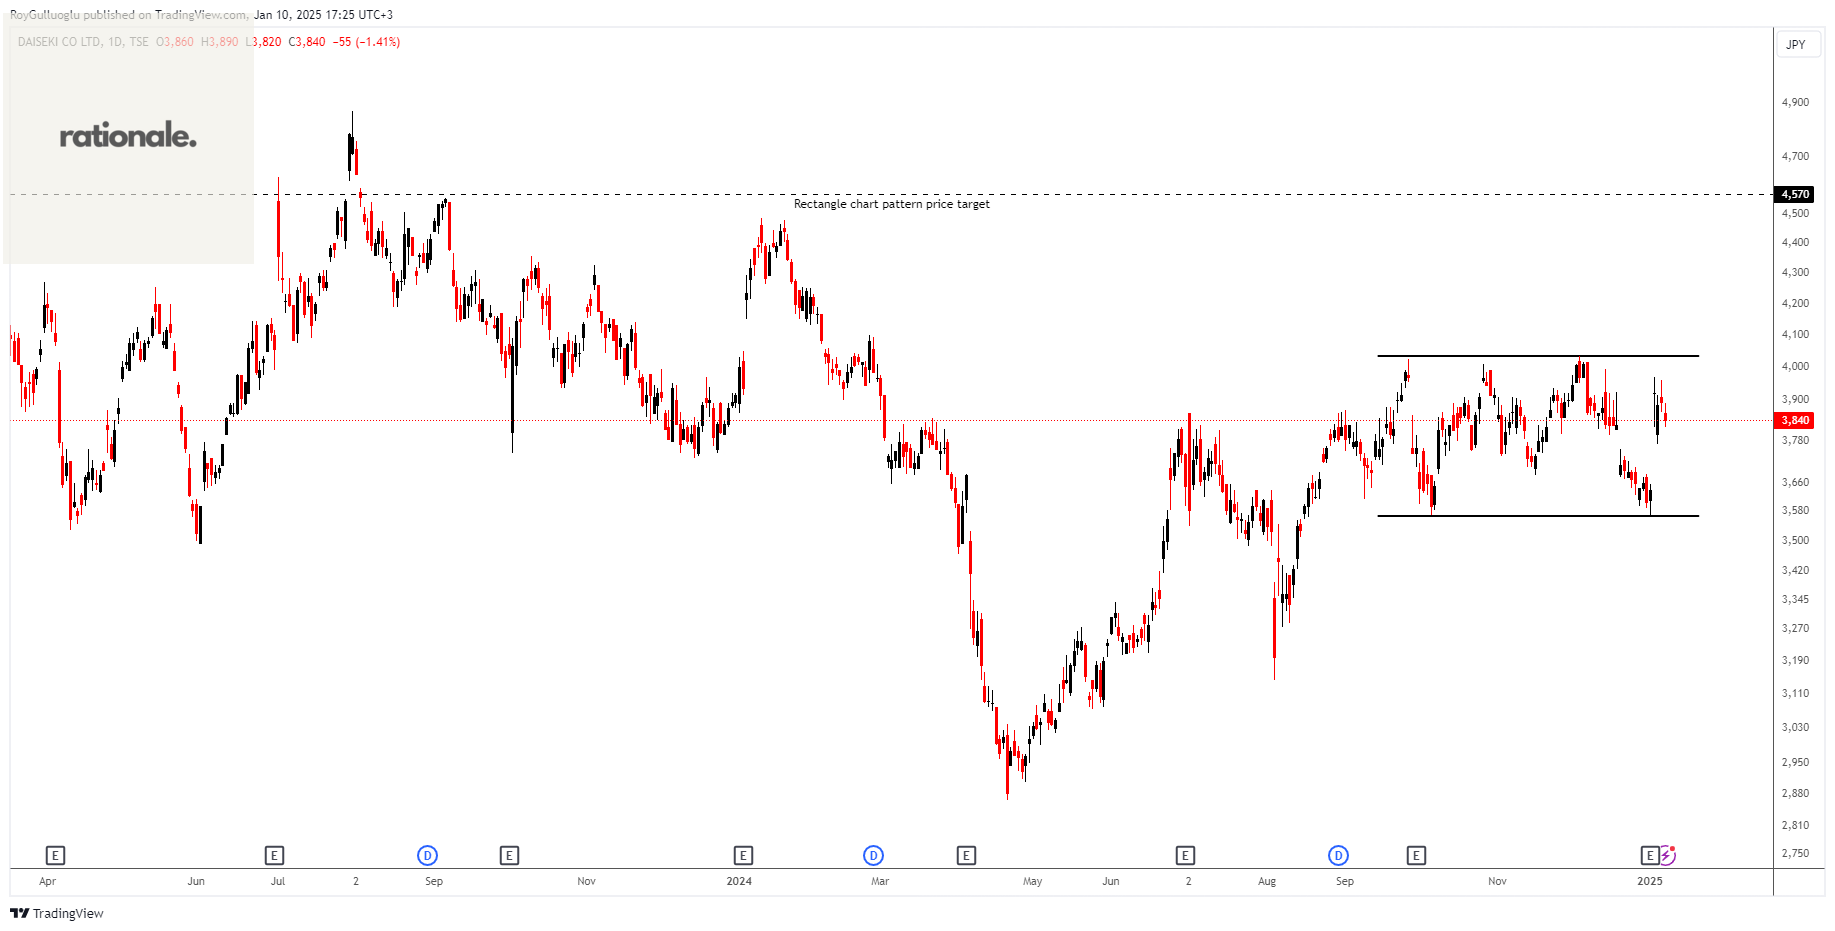
Daiseki Co.,Ltd. engages industrial waste treatment and resource recycling activities in Japan.
The above daily chart formed an approximately 3-month-long rectangle chart pattern as a bullish continuation after an uptrend.
The horizontal boundary at 4035 levels acts as a resistance within this pattern.
A daily close above 4156 levels would validate the breakout from the 3-month-long rectangle chart pattern.
Based on this chart pattern, the potential price target is 4570 levels.
9793, classified under the "industrials" sector, falls under the “Small Cap - Value” stock category.
Shell plc-(SHEL/LSE)-Long/Short Idea
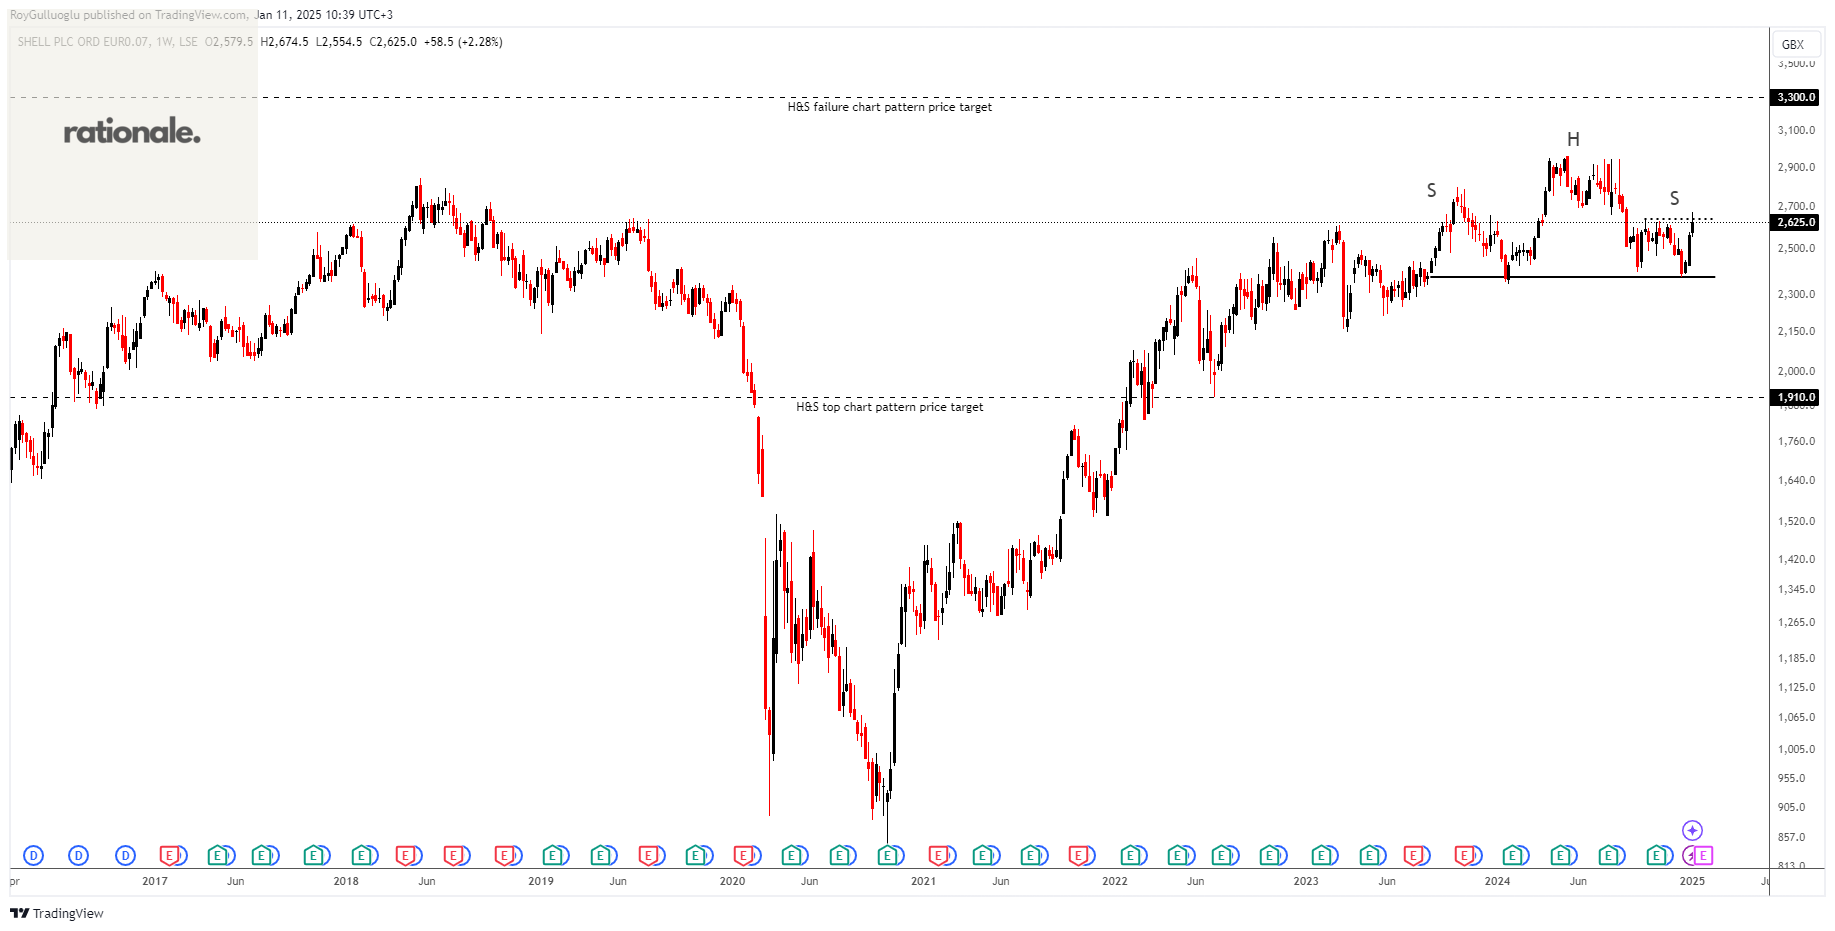
Shell plc operates as an energy and petrochemical company Europe, Asia, Oceania, Africa, the United States, and Rest of the Americas.
The above daily chart formed an approximately 2-month-long H&S top chart pattern as a bearish reversal after an uptrend or it might act as a continuation and form an H&S failure chart pattern.
The horizontal boundary at 2374.5 levels acts as a support within this pattern while 2669 levels act as a resistance.
A daily close below 2300 levels would validate the breakdown from the 2-month-long H&S top chart pattern. A daily close above 2749 would validate the breakout from the H&S failure chart pattern.
Based on the chart patterns, the potential price targets are 1910 and 3300 levels respectively.
SHEL, classified under the "energy" sector, falls under the “Large Cap - Income” stock category.