Trade Ideas Equities
COKE(NASDAQ), FTV(NASDAQ), DNTH(NASDAQ), CW(NYSE), ALV(XETR), DEMANT(OMXCOP)
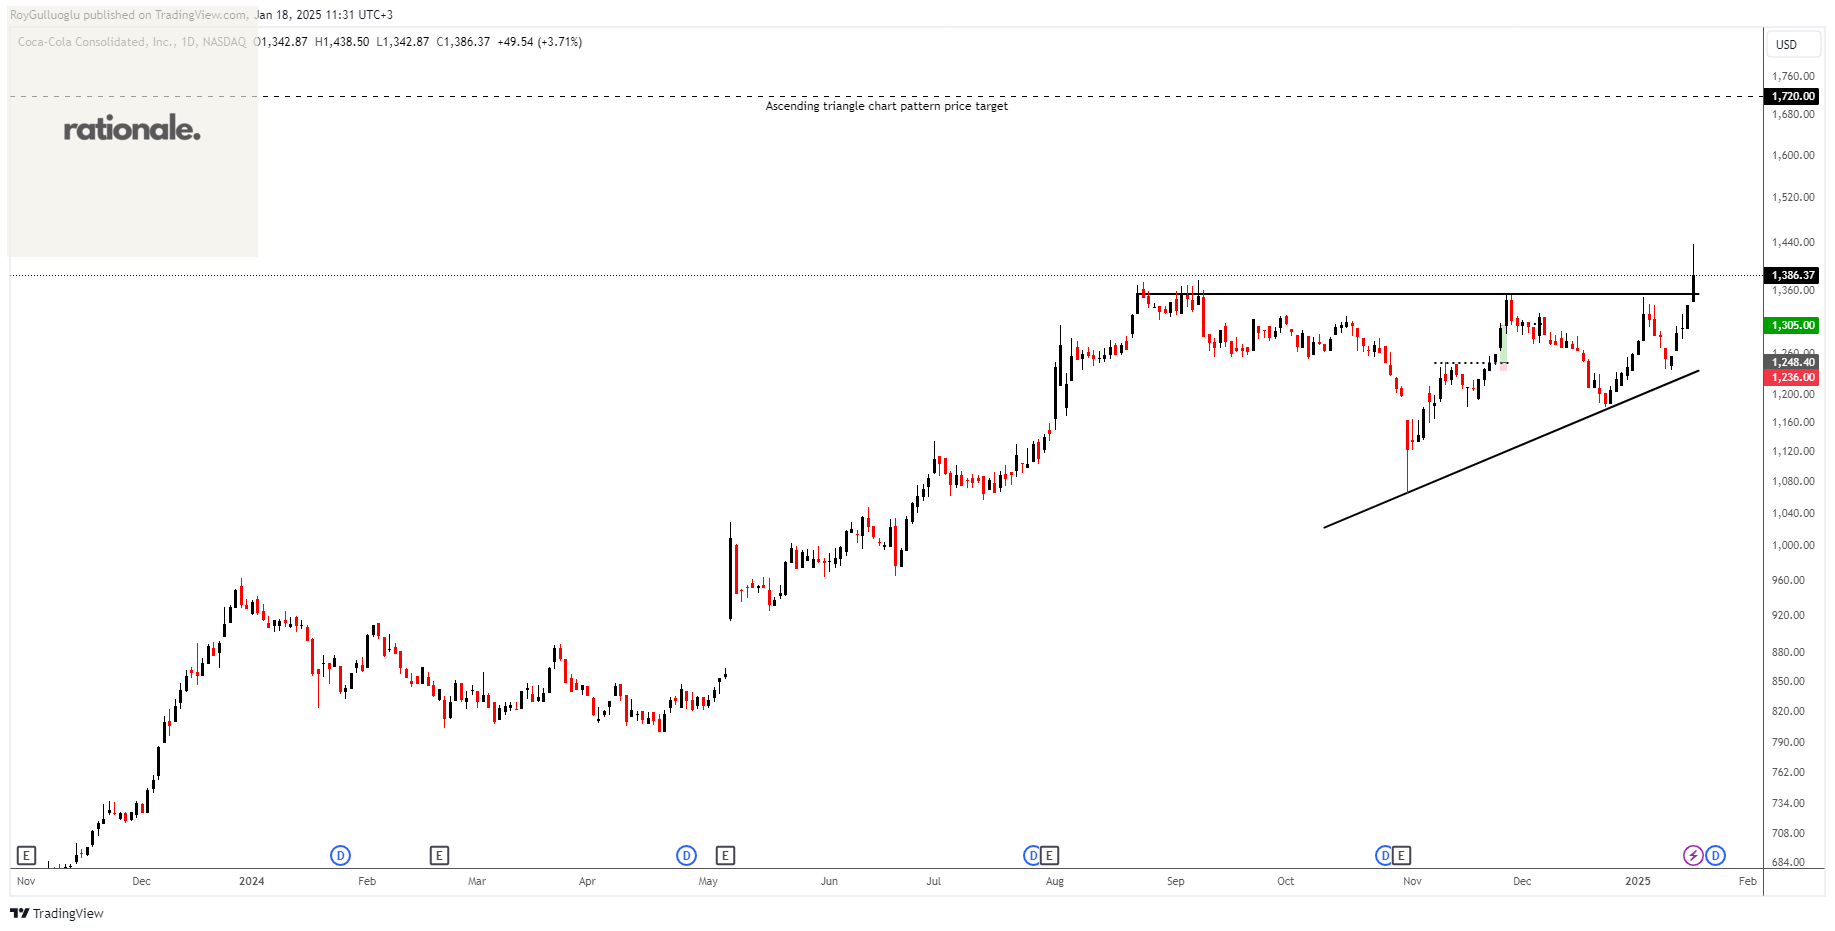
Coca-Cola Consolidated, Inc.-(COKE/NASDAQ)-Long Idea
Coca-Cola Consolidated, Inc., together with its subsidiaries, manufactures, markets, and distributes nonalcoholic beverages primarily products of The Coca-Cola Company in the United States.
The above daily chart formed an approximately 3-month-long ascending triangle chart pattern as a bullish continuation after an uptrend.
The horizontal boundary at 1354 levels acts as a resistance within this pattern.
A daily close above 1394 levels would validate the breakout from the 6-month-long rectangle chart pattern.
Based on this chart pattern, the potential price target is 1720 levels.
COKE, classified under the "consumer defensive" sector, falls under the “Large Cap - Value” stock category.
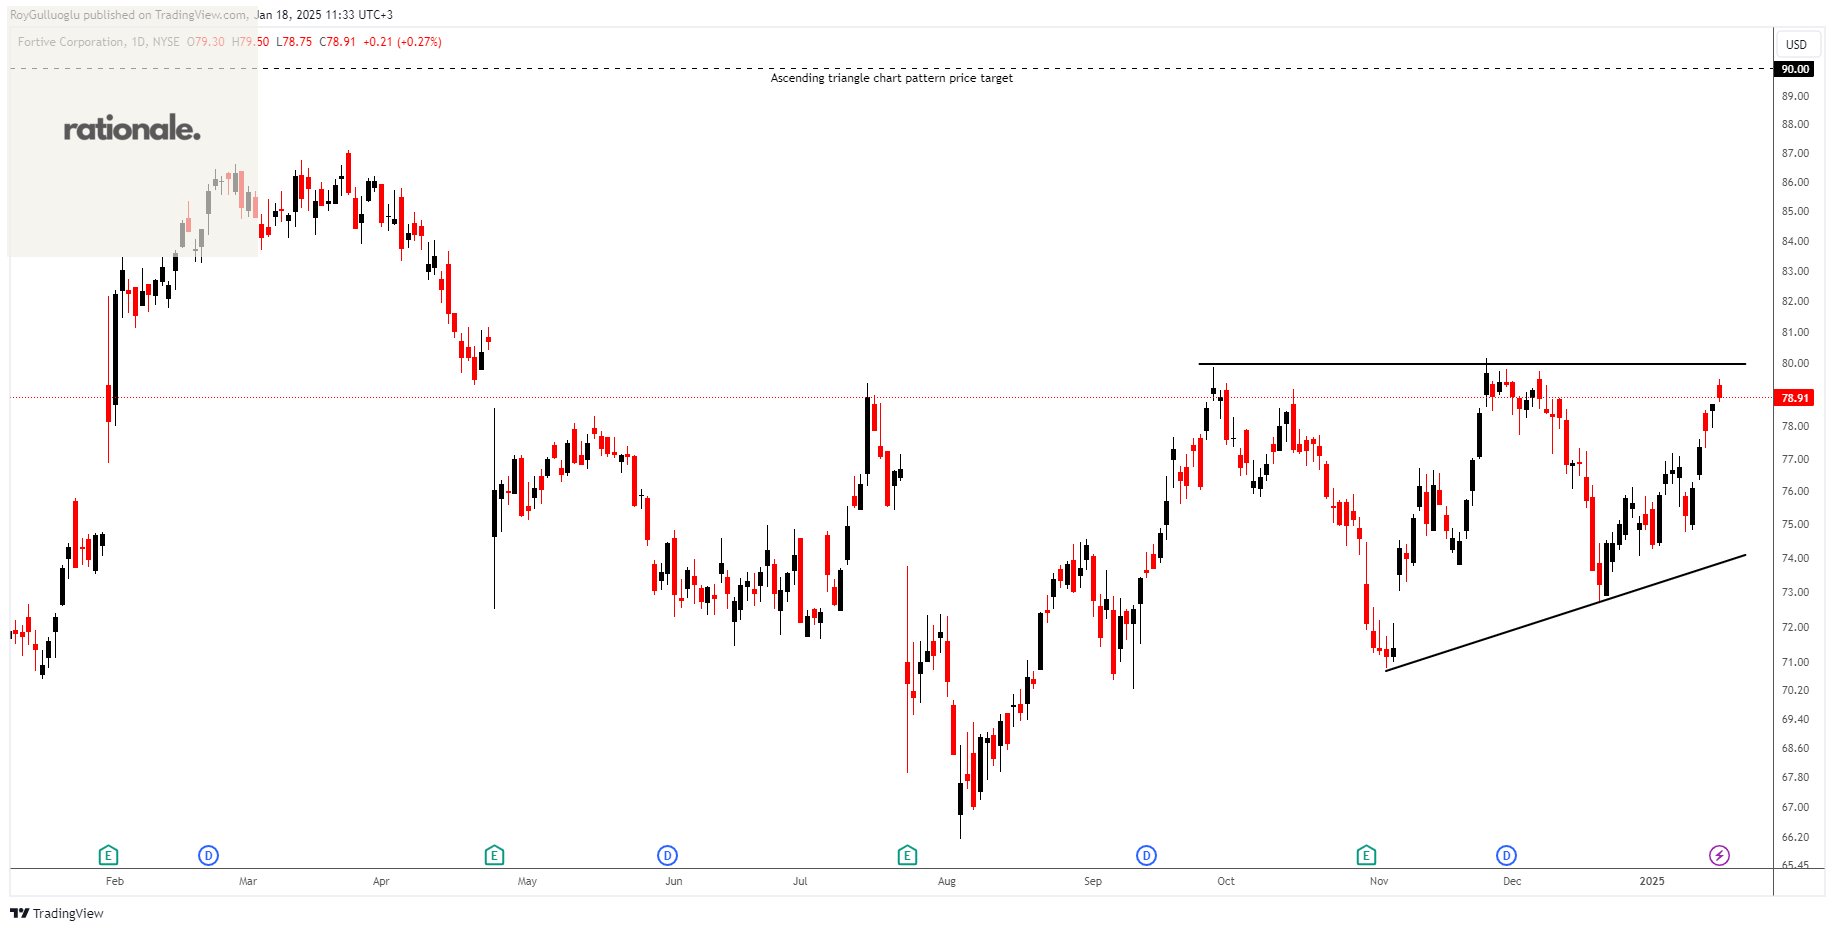
Fortive Corporation-(FTV/NYSE)-Long Idea
Fortive Corporation designs, develops, manufactures, and services professional and engineered products, software, and services in the United States, China, and internationally.
The above daily chart formed an approximately 2-month-long ascending triangle chart pattern as a bullish continuation after an uptrend.
The horizontal boundary at 79.96 levels acts as a resistance within this pattern.
A daily close above 82.35 levels would validate the breakout from the 2-month-long ascending triangle chart pattern.
Based on this chart pattern, the potential price target is 90 levels.
FTV, classified under the "technology" sector, falls under the “Large Cap - Growth” stock category.
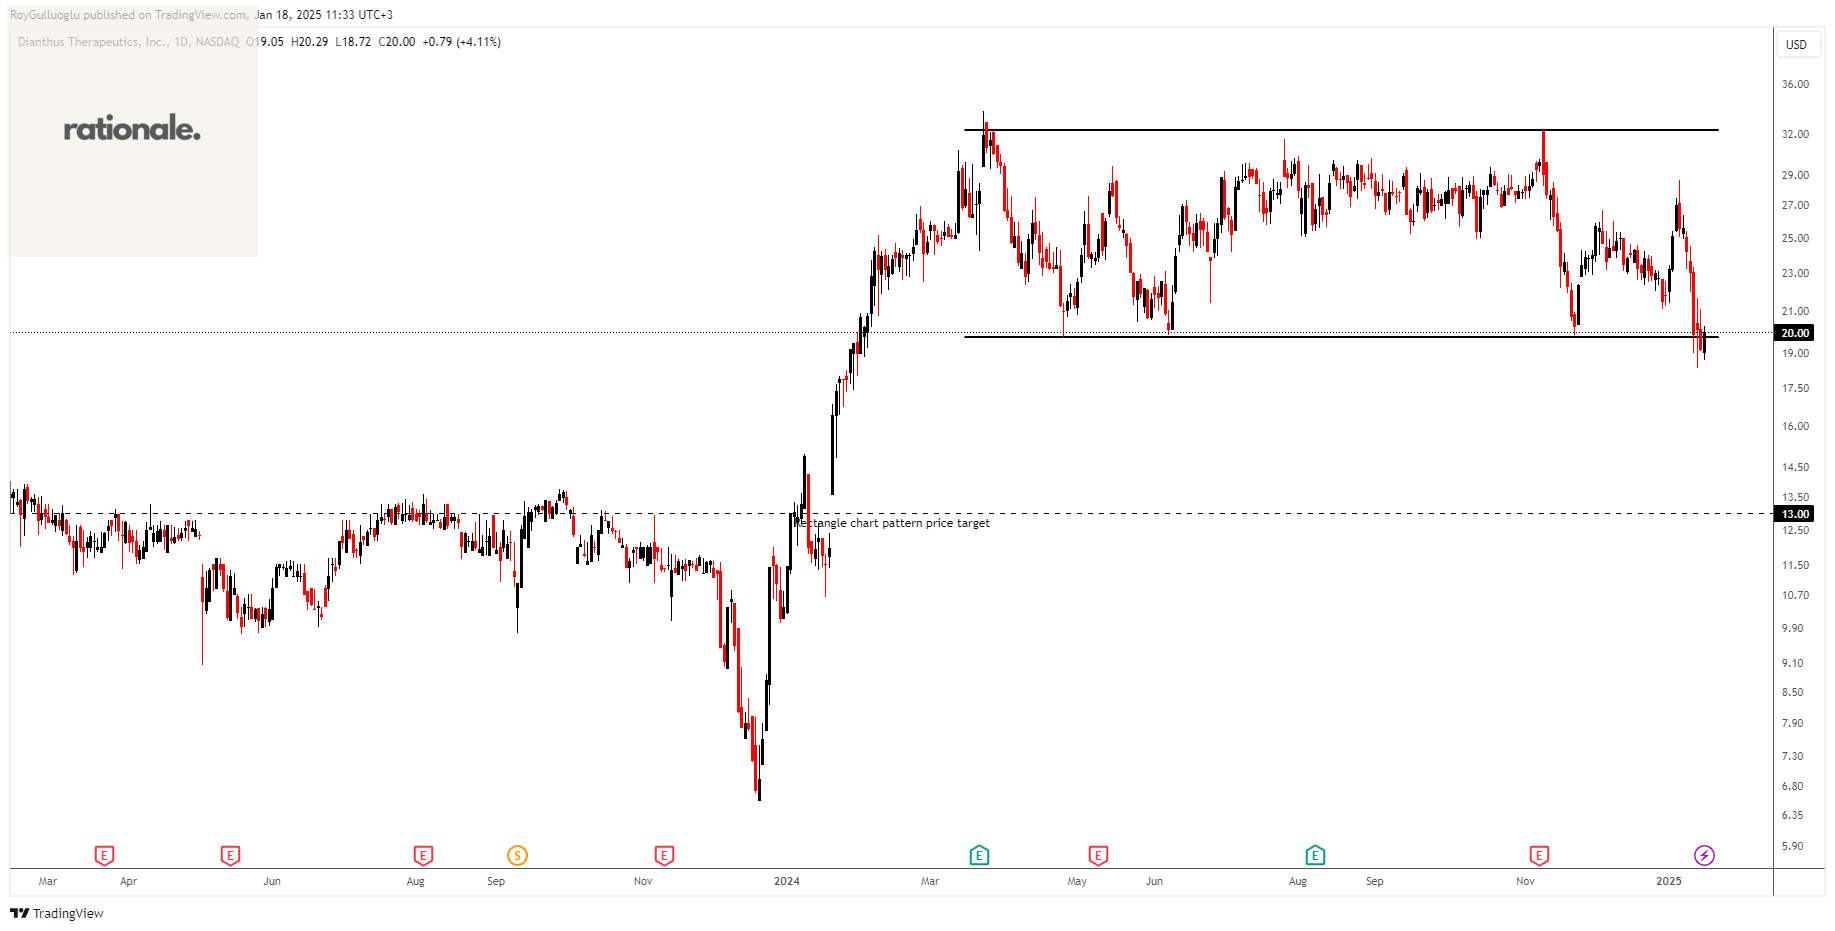
Dianthus Therapeutics, Inc.-(DNTH/NASDAQ)-Short Idea
Dianthus Therapeutics, Inc., a clinical-stage biotechnology company, develops complement therapeutics for patients with severe autoimmune and inflammatory diseases.
The above daily chart formed an approximately 6-month-long rectangle chart pattern as a bearish reversal after an uptrend.
The horizontal boundary at 19.75 levels acts as a support within this pattern.
A daily close below 19.1575 levels would validate the breakdown from the 6-month-long rectangle chart pattern.
Based on this chart pattern, the potential price target is 13 levels.
DNTH, classified under the "healthcare" sector, falls under the “Small Cap - Value” stock category.
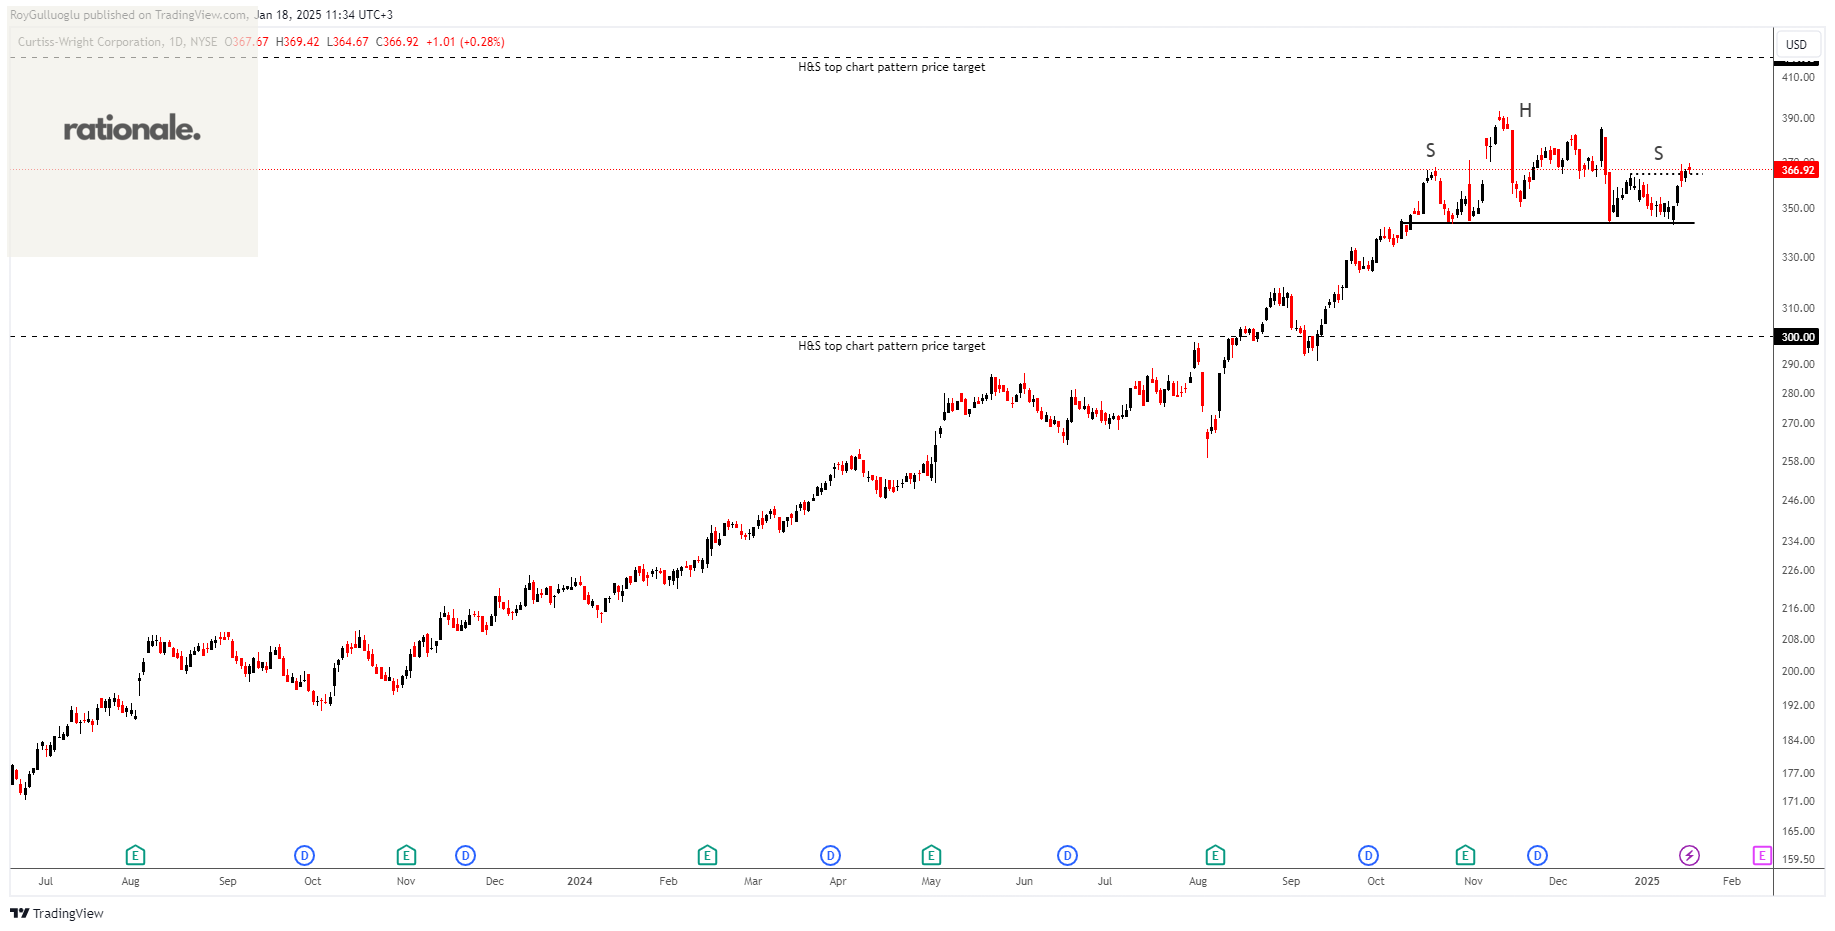
Curtiss-Wright Corporation-(CW/NASDAQ)-Long/Short Idea
Curtiss-Wright Corporation, together with its subsidiaries, provides engineered products, solutions, and services mainly to aerospace and defense, commercial power, process, and industrial markets worldwide.
The above daily chart formed an approximately 2-month-long H&S top chart pattern as a bearish reversal after an uptrend or it might act as a continuation and form an H&S failure chart pattern.
The horizontal boundary at 343.86 levels acts as a support within this pattern while 364.5 levels act as a resistance.
A daily close below 333.54 levels would validate the breakdown from the 2-month-long H&S top chart pattern. A daily close above 375.43 would validate the breakout from the H&S failure chart pattern.
Based on the chart patterns, the potential price targets are 300 and 420 levels respectively.
CW, classified under the "industrials" sector, falls under the “Large Cap - Value” stock category.
Allianz SE -(ALV/XETR)-Long Idea
Allianz SE, together with its subsidiaries, provides property-casualty insurance, life/health insurance, and asset management products and services worldwide.
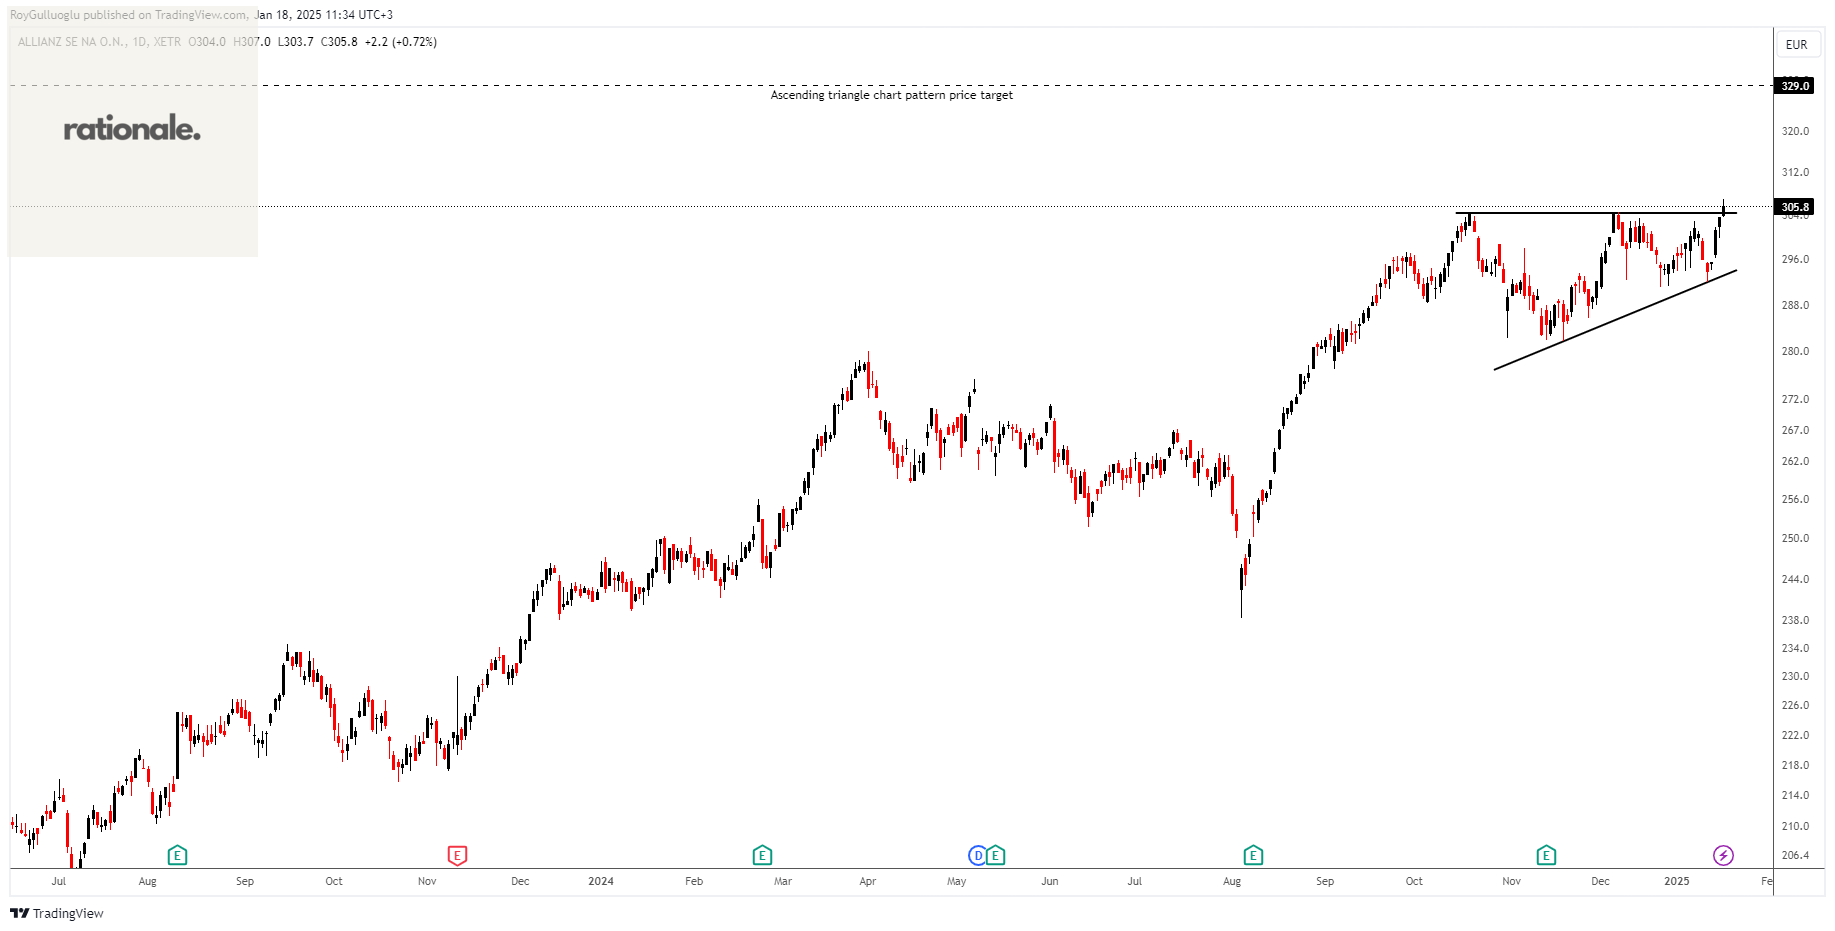
The above daily chart formed an approximately 2-month-long ascending triangle chart pattern as a bullish continuation after an uptrend.
The horizontal boundary at 304.5 levels acts as a resistance within this pattern.
A daily close above 313.63 levels would validate the breakout from the 2-month-long ascending triangle chart pattern.
Based on this chart pattern, the potential price target is 329 levels.
ALV, classified under the "financial services" sector, falls under the “Large Cap - Income” stock category.
Demant A/S-(DEMANT/OMXCOP)-Long Idea
Demant A/S operates as a hearing healthcare and audio technology company in Europe, North America, the Asia Pacific, Asia, and internationally. It operates through two segments: Hearing Healthcare and Communications.
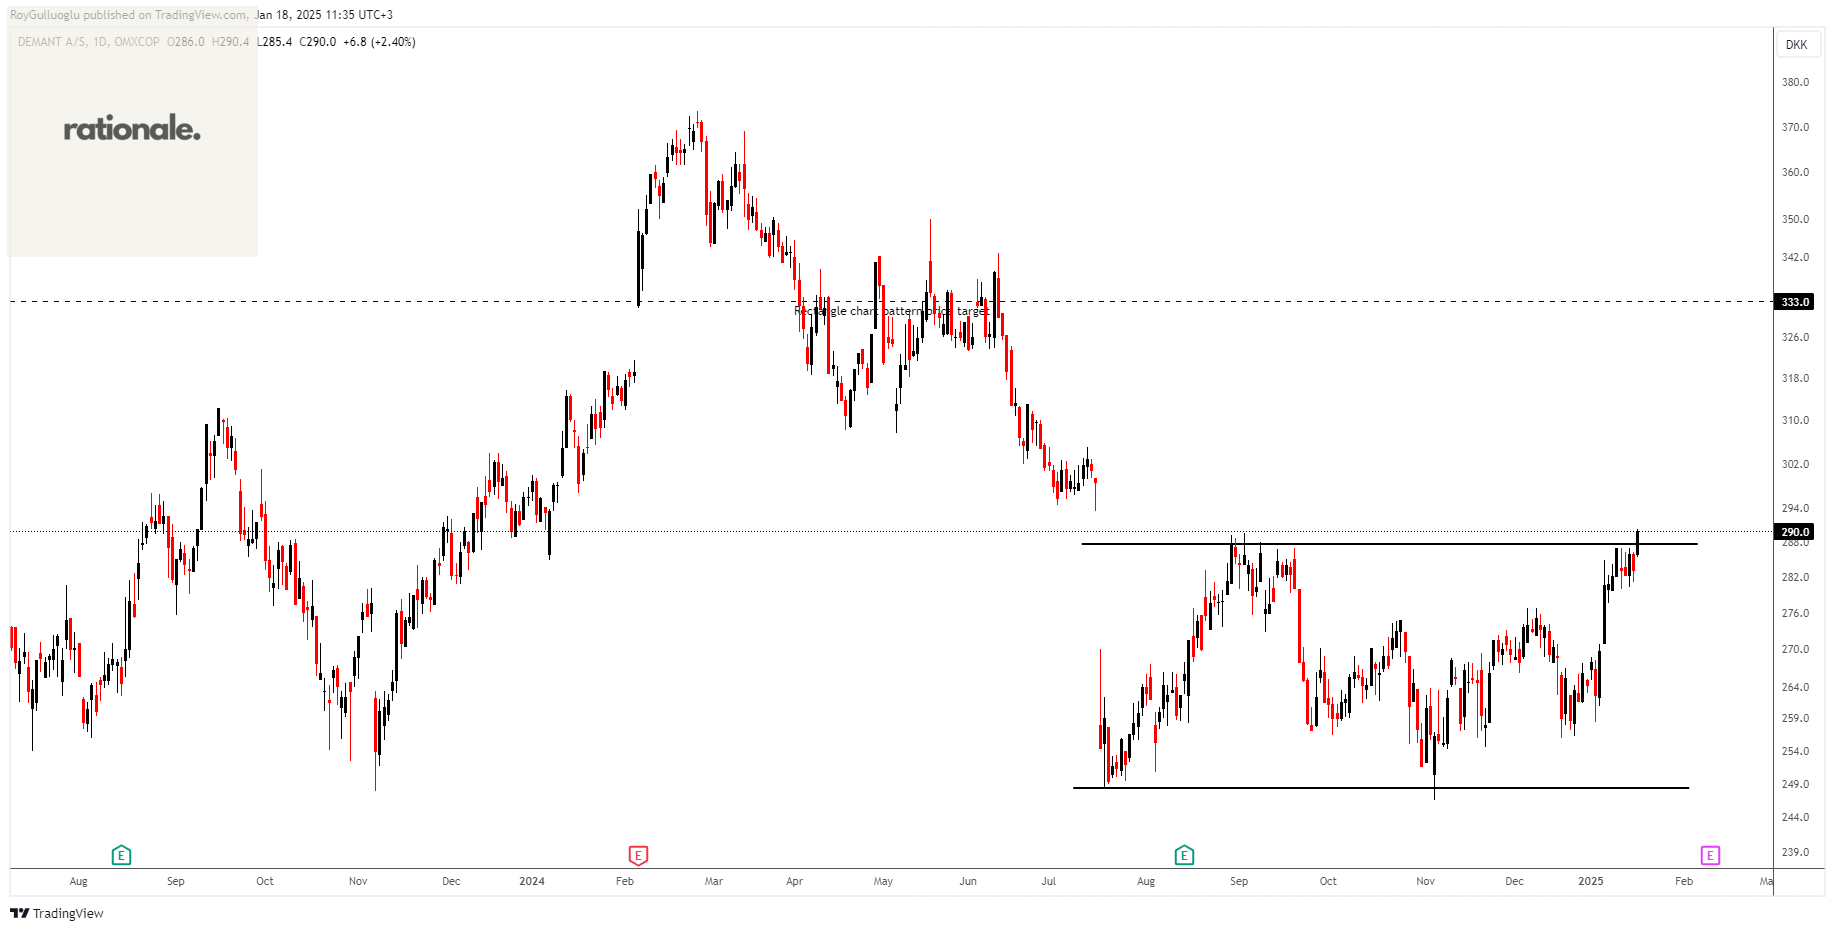
The above daily chart formed an approximately 4-month-long rectangle chart pattern as a bullish reversal after a downtrend.
The horizontal boundary at 287.8 levels acts as a resistance within this pattern.
A daily close above 296.4 levels would validate the breakout from the 4-month-long rectangle chart pattern.
Based on this chart pattern, the potential price target is 333 levels.
DEMANT, classified under the "healthcare" sector, falls under the “Mid Cap - Value” stock category.


Teşekkürler..