

Trade Ideas Equities
TRIN(NASDAQ), AGO(NYSE), SPGI(NYSE), MDT(NYSE), KRN(XETR), TSCO(LSE), TOASO(BIST), VAKBN(BIST)

Trinity Capital Inc.-(TRIN/NASDAQ)-Long Idea
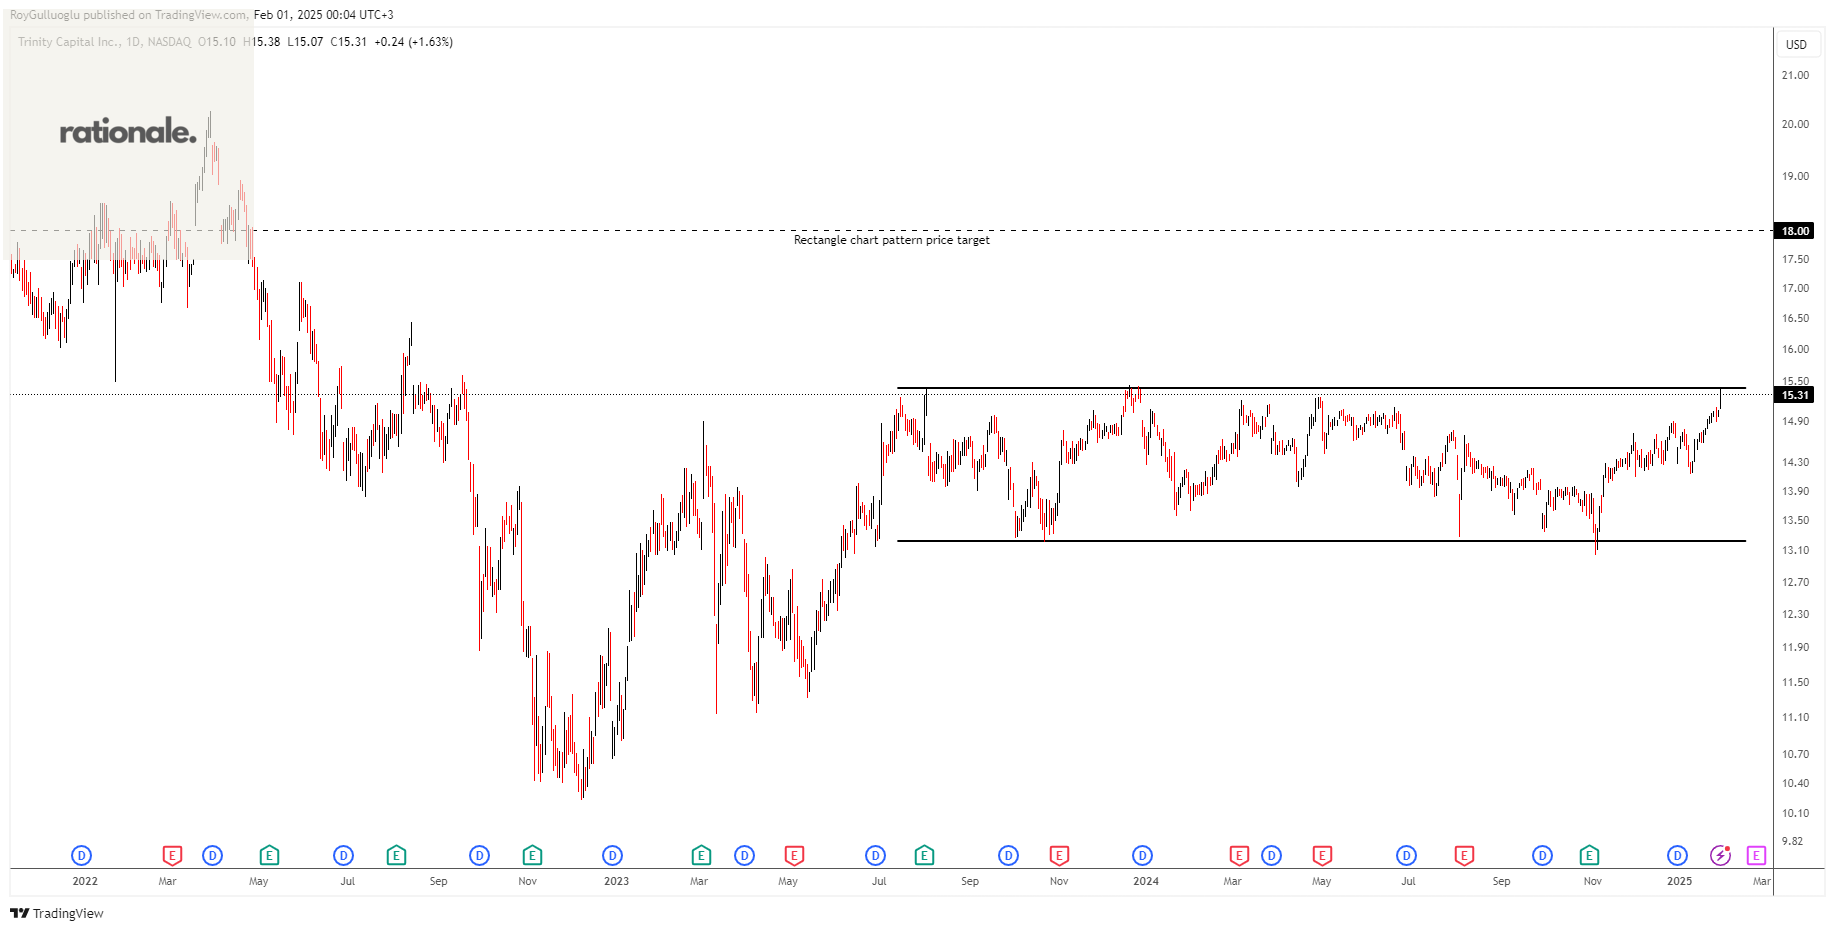
Trinity Capital Inc. is a business development company specializing in term loans, equipment financing, and private equity-related investments.
The above daily chart formed an approximately 12-month-long rectangle chart pattern as a bullish continuation after an uptrend.
The horizontal boundary at 15.4 levels acts as a resistance within this pattern.
A daily close above 15.85 levels would validate the breakout from the 12-month-long rectangle chart pattern.
Based on this chart pattern, the potential price target is 18 levels.
TRIN, classified under the "financial services" sector, falls under the “Small Cap - Income” stock category.
Assured Guaranty Ltd.-(AGO/NYSE)-Long Idea
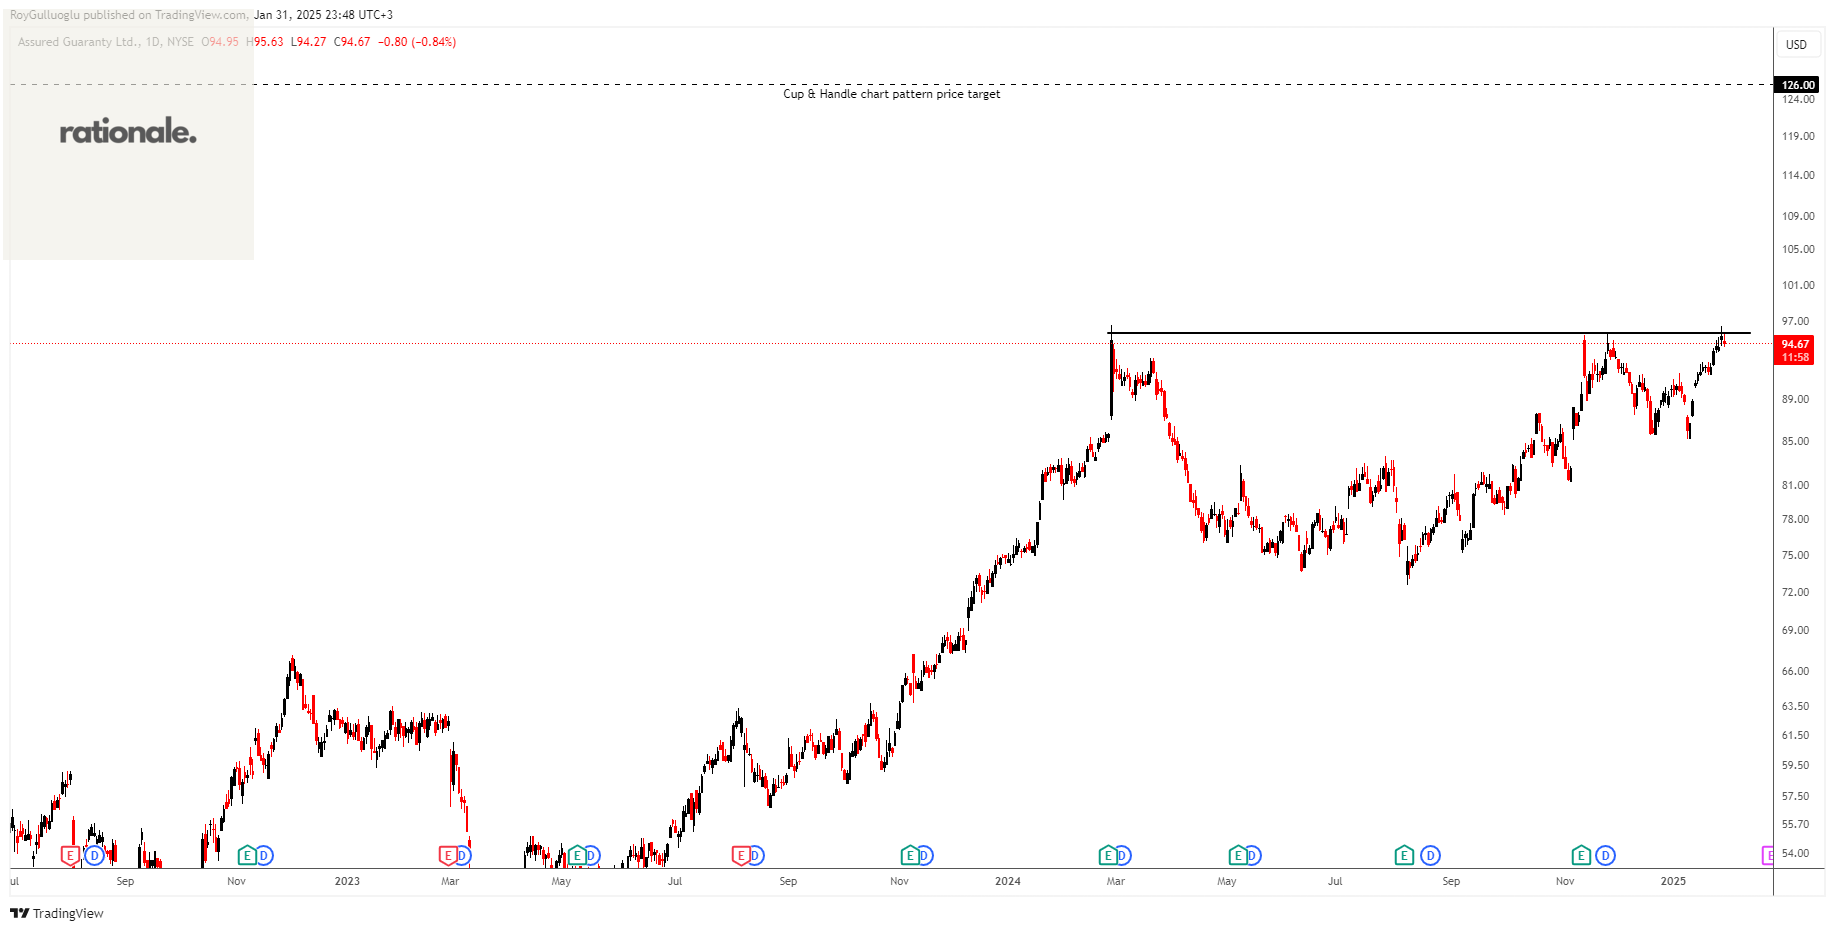
Assured Guaranty Ltd., together with its subsidiaries, provides credit protection products to public finance, infrastructure, and structured finance markets in the United States and internationally.
The above daily chart formed an approximately 8-month-long Cup & Handle continuation chart pattern as a bullish continuation after an uptrend.
The horizontal boundary at 95.75 levels acts as a resistance within this pattern.
A daily close above 98.6 levels would validate the breakout from the 8-month-long Cup & Handle continuation chart pattern.
Based on this chart pattern, the potential price target is 126 levels.
AGO, classified under the "financial services" sector, falls under the “Mid Cap - Income” stock category.
S&P Global Inc.-(SPGI/NYSE)-Long Idea
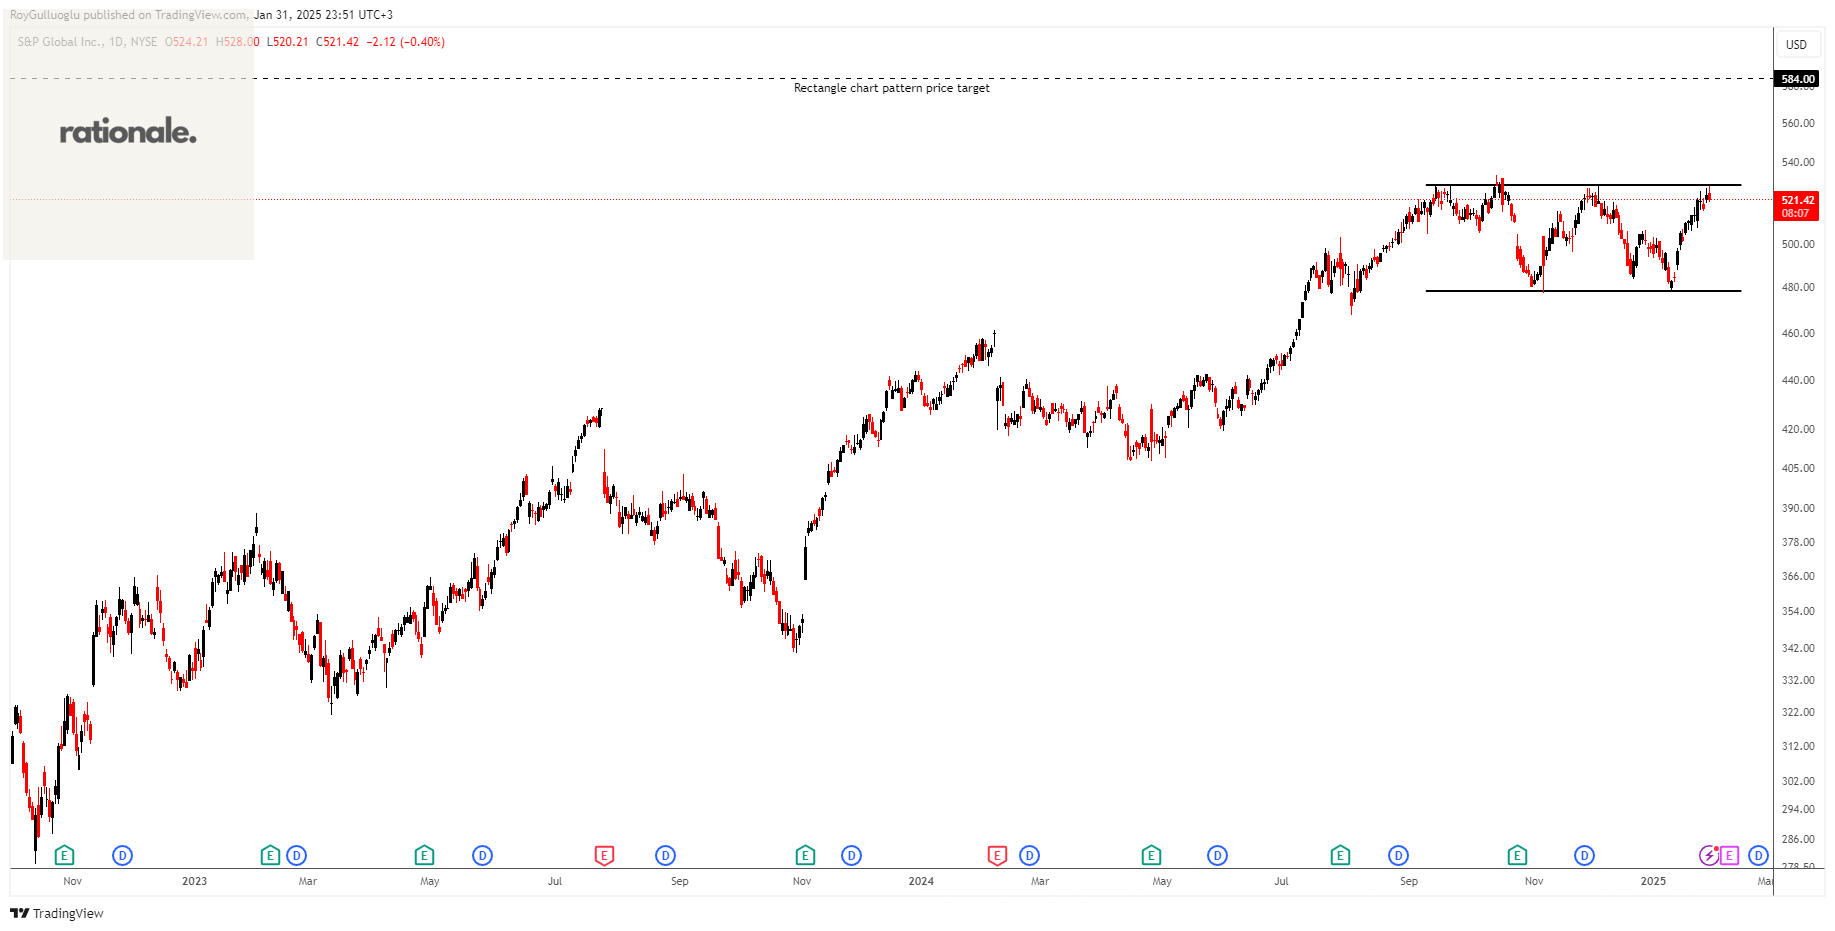
S&P Global Inc., together with its subsidiaries, provides credit ratings, benchmarks, analytics, and workflow solutions in the global capital, commodity, and automotive markets.
The above daily chart formed an approximately 3-month-long rectangle chart pattern as a bullish continuation after an uptrend.
The horizontal boundary at 528.14 levels acts as a resistance within this pattern.
A daily close above 544 levels would validate the breakout from the 3-month-long rectangle chart pattern.
Based on this chart pattern, the potential price target is 584 levels.
SPGI, classified under the "financial services" sector, falls under the “Large Cap - Income” stock category.
Medtronic plc -(MDT/NYSE)-Long Idea
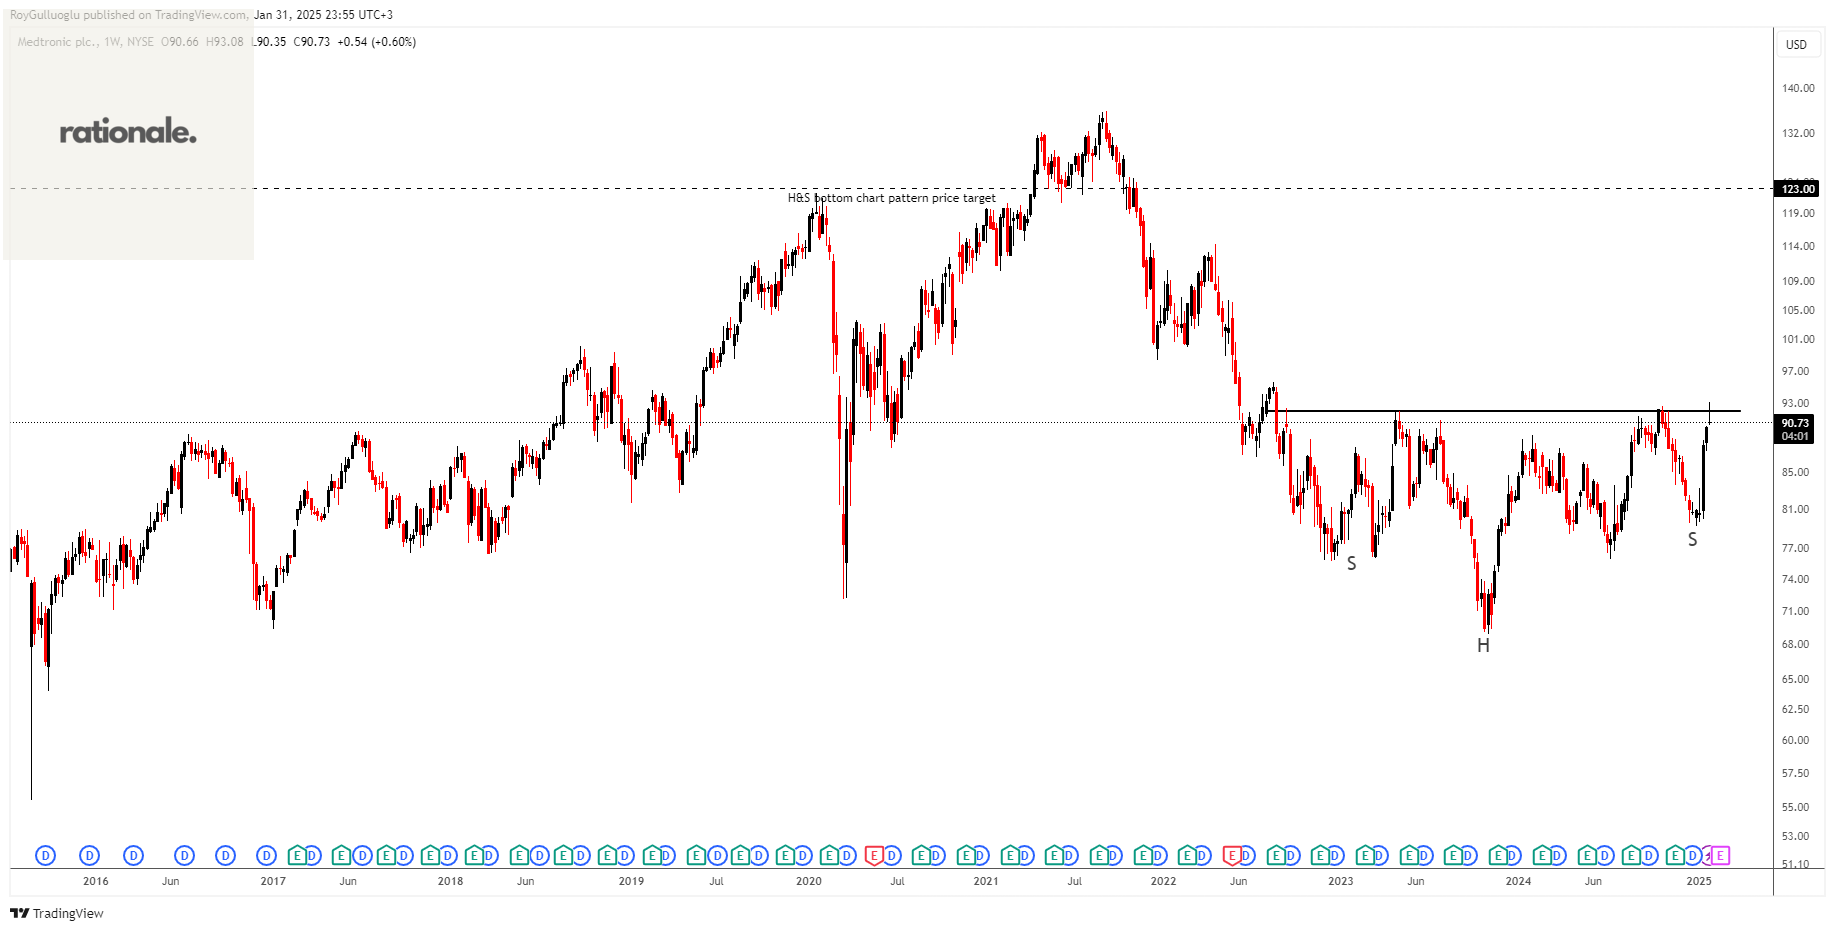
Medtronic plc develops, manufactures, and sells device-based medical therapies to healthcare systems, physicians, clinicians, and patients worldwide.
The above weekly chart formed an approximately 30-month-long H&S bottom chart pattern as a bullish reversal after a downtrend.
The horizontal boundary at 92 levels acts as a resistance within this pattern.
A daily close above 94.75 levels would validate the breakout from the 30-month-long H&S bottom chart pattern.
Based on this chart pattern, the potential price target is 123 levels.
MDT, classified under the "healthcare" sector, falls under the “Large Cap - Value” stock category.
Krones AG-(KRN/XETR)-Long Idea
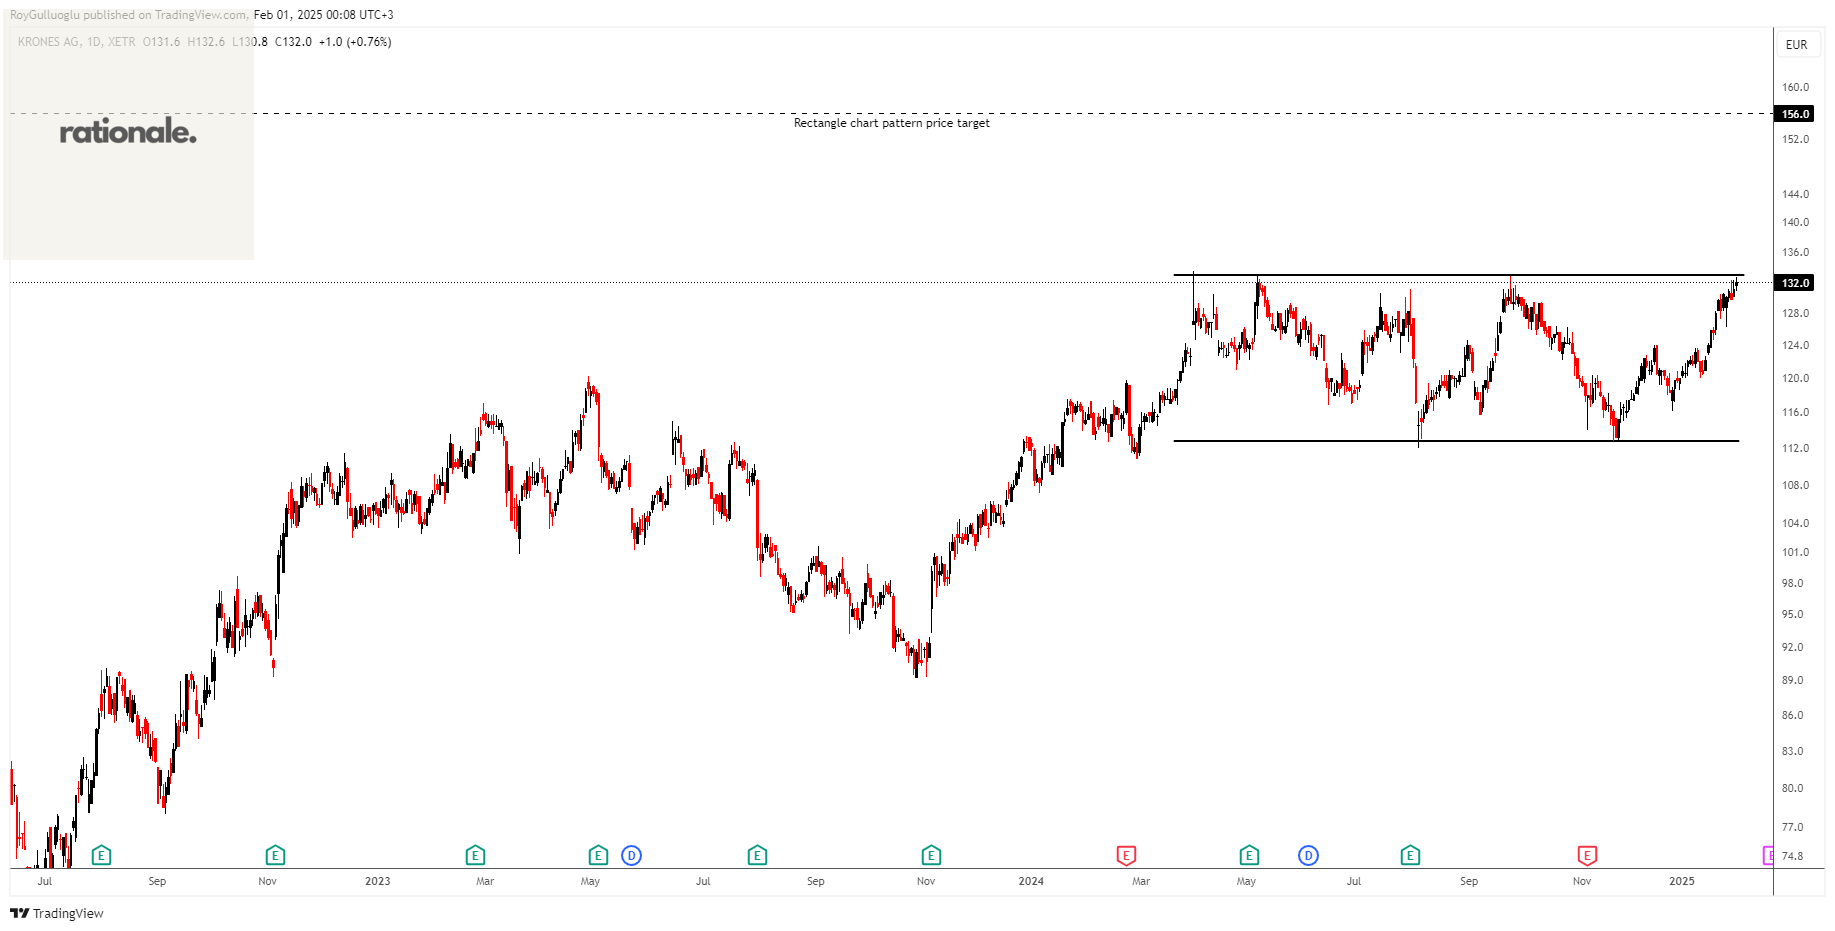
Krones AG, together with its subsidiaries, engages in the planning, development, and manufacture of machines and lines for the production, filling, and packaging technology in Germany and internationally.
The above daily chart formed an approximately 7-month-long rectangle chart pattern as a bullish continuation after an uptrend.
The horizontal boundary at 132.8 levels acts as a resistance within this pattern.
A daily close above 136.8 levels would validate the breakout from the 7-month-long rectangle chart pattern.
Based on this chart pattern, the potential price target is 156 levels.
KRN, classified under the "industrials" sector, falls under the “Mid Cap - Value” stock category.
Tesco PLC-(TSCO/LSE)-Long Idea
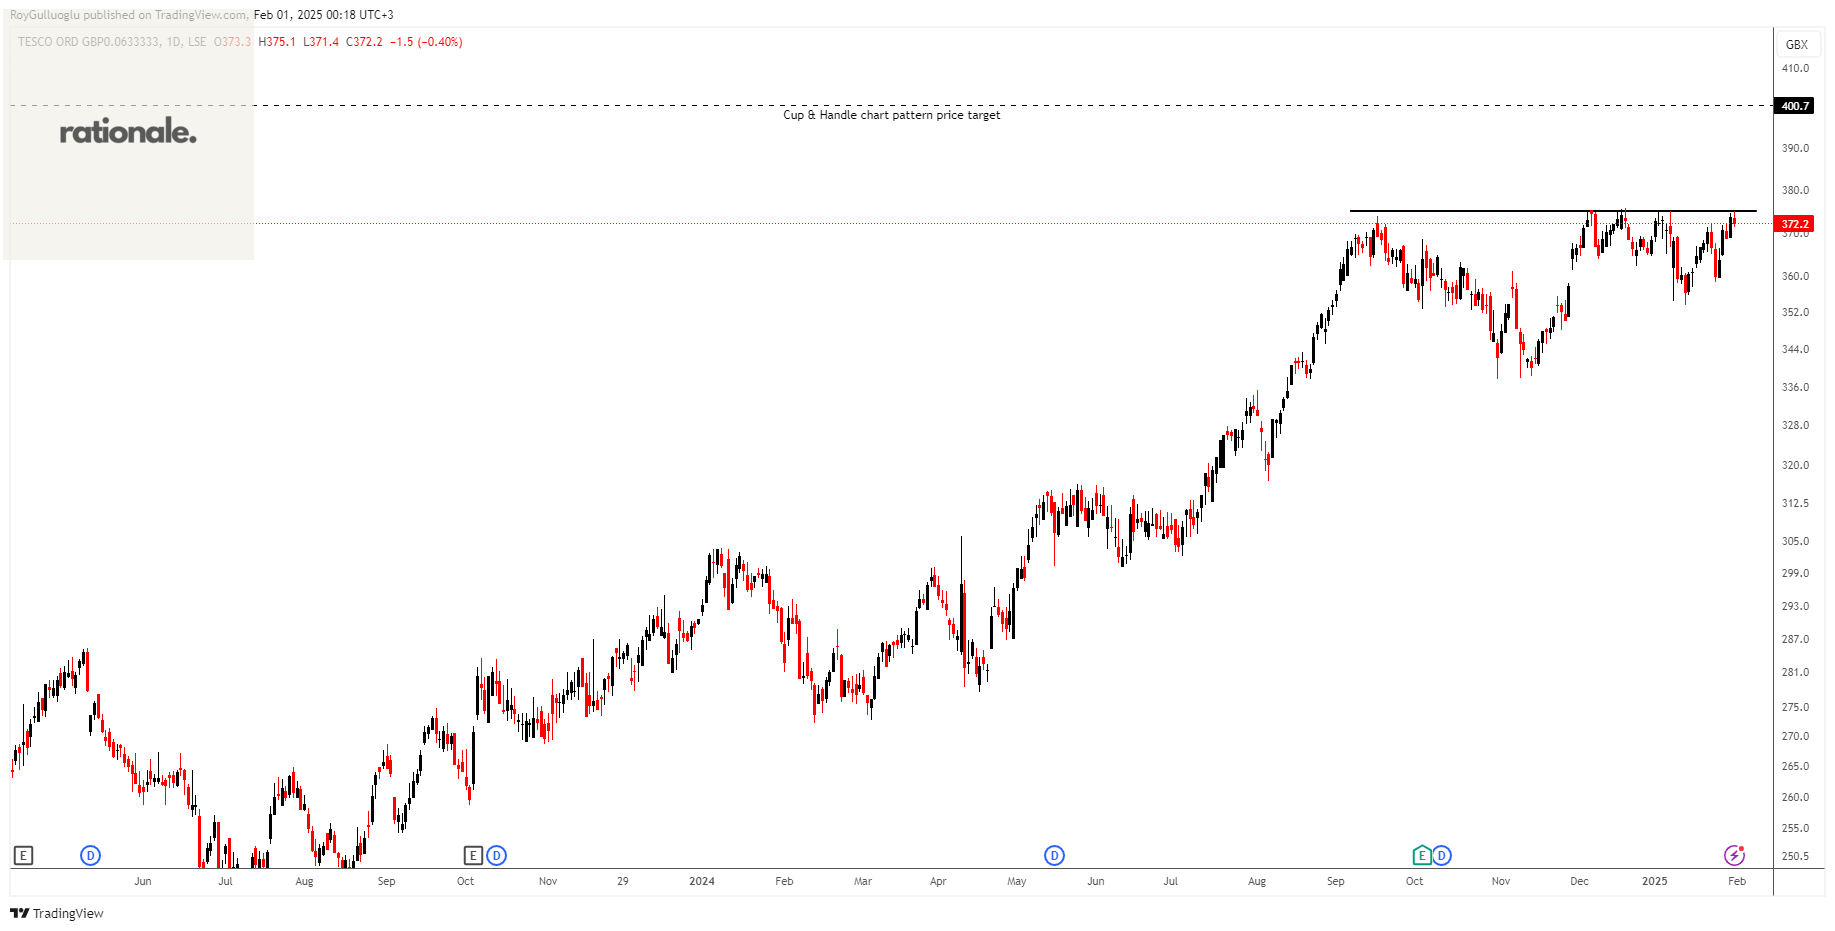
Tesco PLC, together with its subsidiaries, operates as a grocery retailer in the United Kingdom, Republic of Ireland, the Czech Republic, Slovakia, and Hungary.
The above daily chart formed an approximately 3-month-long Cup & Handle continuation chart pattern as a bullish continuation after an uptrend.
The horizontal boundary at 375 levels acts as a resistance within this pattern.
A daily close above 386 levels would validate the breakout from the 3-month-long Cup & Handle continuation chart pattern.
Based on this chart pattern, the potential price target is 400.7 levels.
TSCO, classified under the "consumer defensive" sector, falls under the “Large Cap - Value” stock category.
Tofas Türk Otomobil Fabrikasi Anonim Sirketi-(TOASO/BIST)-Long Idea
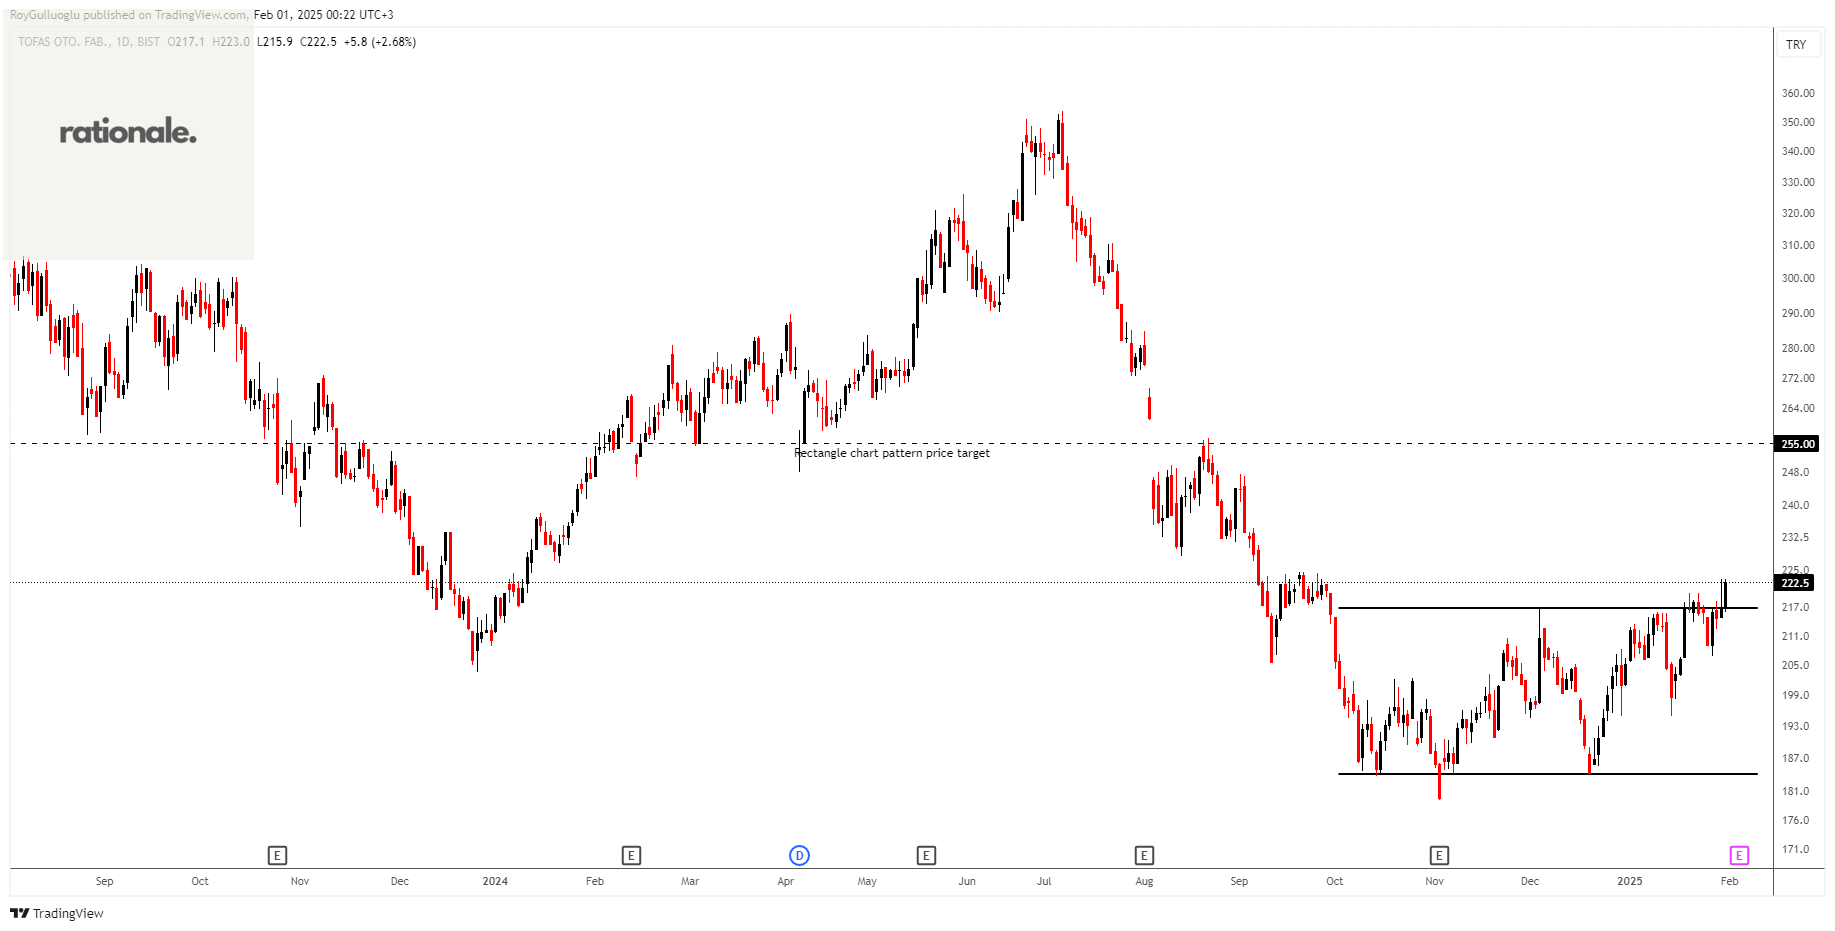
Tofas Türk Otomobil Fabrikasi Anonim Sirketi manufactures and sells passenger cars and light commercial vehicles in Turkey.
The above daily chart formed an approximately 3-month-long rectangle chart pattern as a bullish reversal after a downtrend.
The horizontal boundary at 216.8 levels acts as a resistance within this pattern.
A daily close above 223.3 levels would validate the breakout from the 3-month-long rectangle chart pattern.
Based on this chart pattern, the potential price target is 255 levels.
TOASO, classified under the "consumer cyclicals" sector, falls under the “Mid Cap - Growth” stock category.
Türkiye Vakiflar Bankasi Türk Anonim Ortakligi-(VAKBN/BIST)-Long Idea
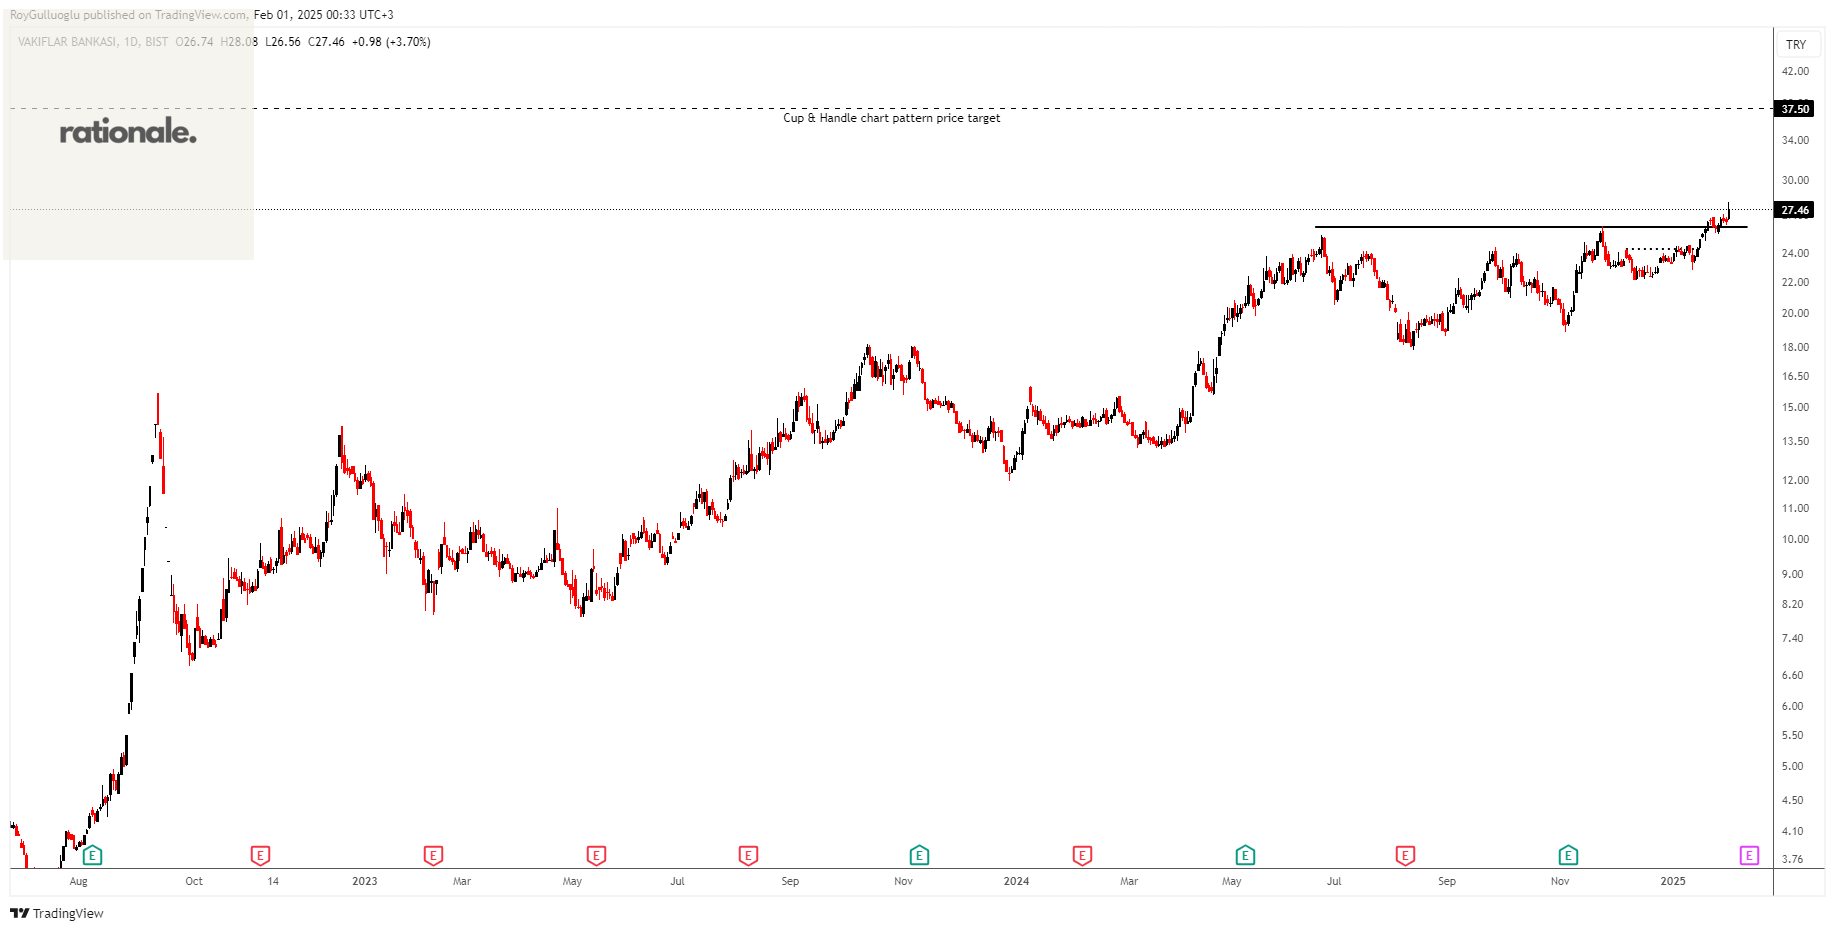
Türkiye Vakiflar Bankasi Türk Anonim Ortakligi, together with its subsidiaries, provides corporate, commercial, small business, retail, and investment banking services in Turkey and internationally.
The above daily chart formed an approximately 5-month-long Cup & Handle continuation chart pattern as a bullish continuation after an uptrend.
The horizontal boundary at 26 levels acted as a resistance within this pattern.
A daily close above 26.78 levels validated the breakout from the 5-month-long Cup & Handle continuation chart pattern.
Based on this chart pattern, the potential price target is 37.5 levels.
VAKBN, classified under the "financial services" sector, falls under the “Mid Cap - Income” stock category.
Teşekkürler Roy