

Trade Ideas Fx-Futures-Etf-Crypto
SOXX(NASDAQ), 2644(TSE), AXSUSDT, ONTUSDT

iShares Semiconductor ETF-(SOXX/NASDAQ)-Long/Short Idea
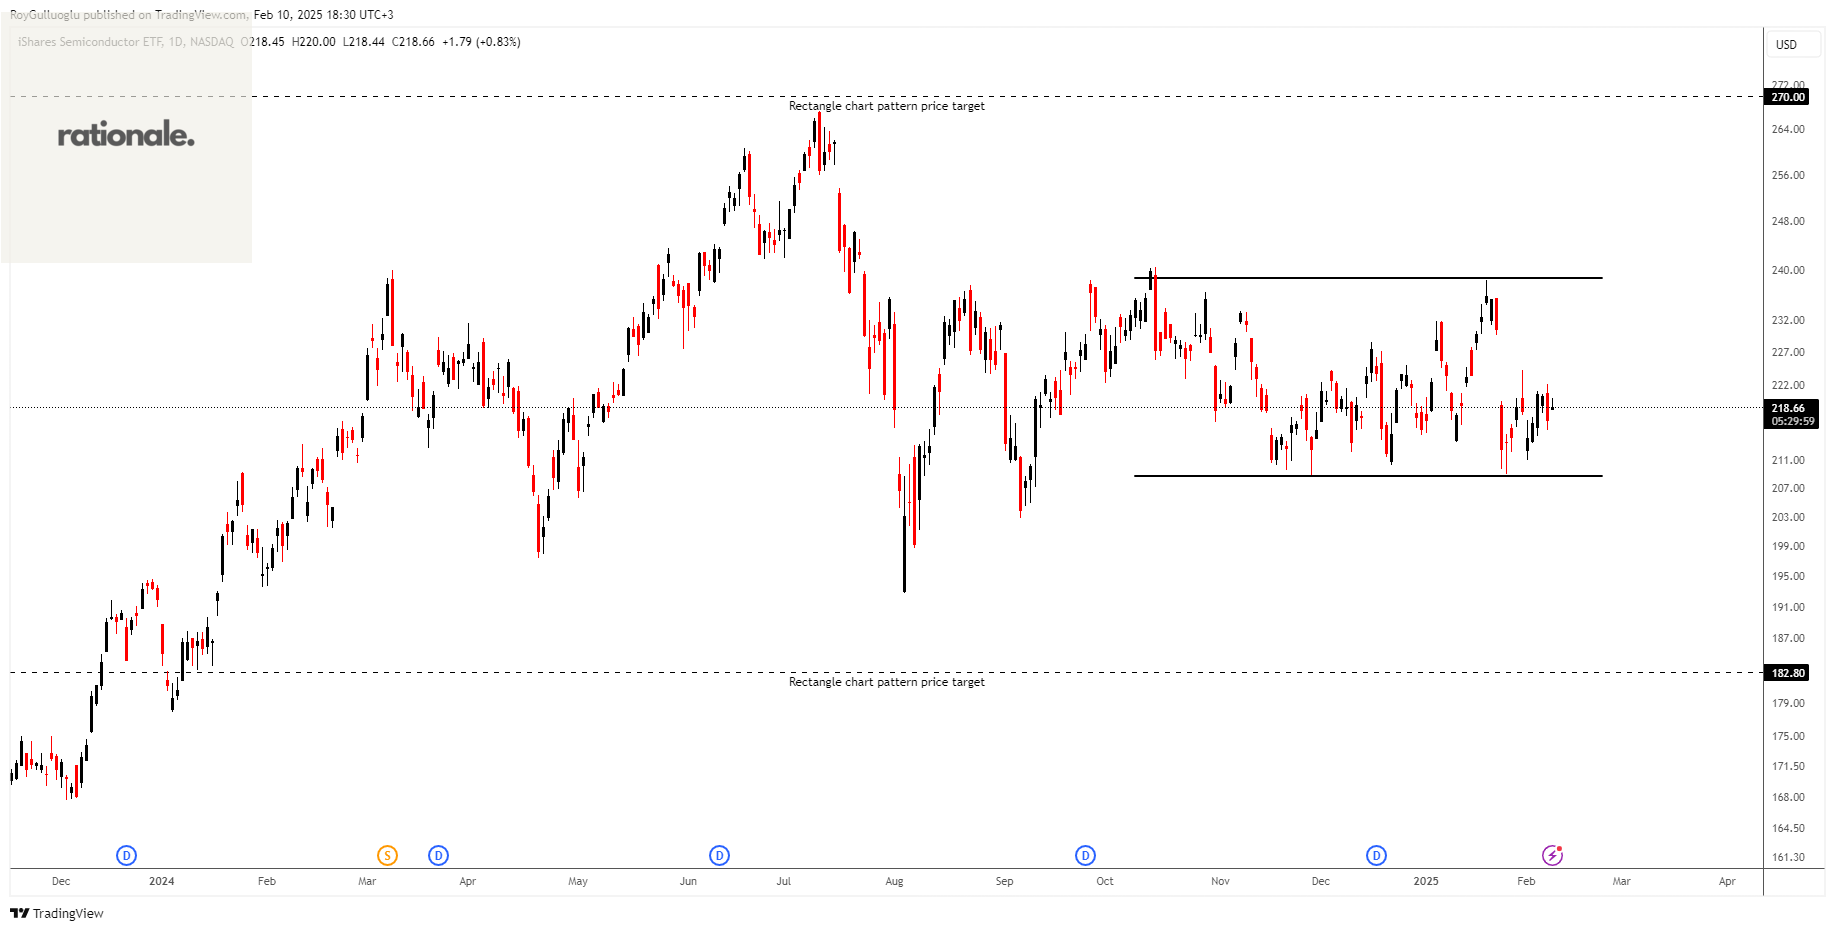
The above daily chart formed an approximately 3-month-long rectangle chart pattern as a bearish reversal or bullish continuation after an uptrend.
The horizontal boundary at 208.75 levels acts as a support within this pattern while 238.63 levels act as a resistance.
A daily close below 202.48 levels would validate the breakdown from the 3-month-long rectangle chart pattern. A daily close above 245.7 would validate the breakout from the H&S failure chart pattern.
Based on the chart patterns, the potential price targets are 182.8 and 270 levels respectively.
Tariff-related developments will be crucial for the semiconductor sector, determining whether this chart follows a bullish continuation or a bearish reversal.
Global X Japan Semiconductor ETF-(2644/TSE)-Long Idea
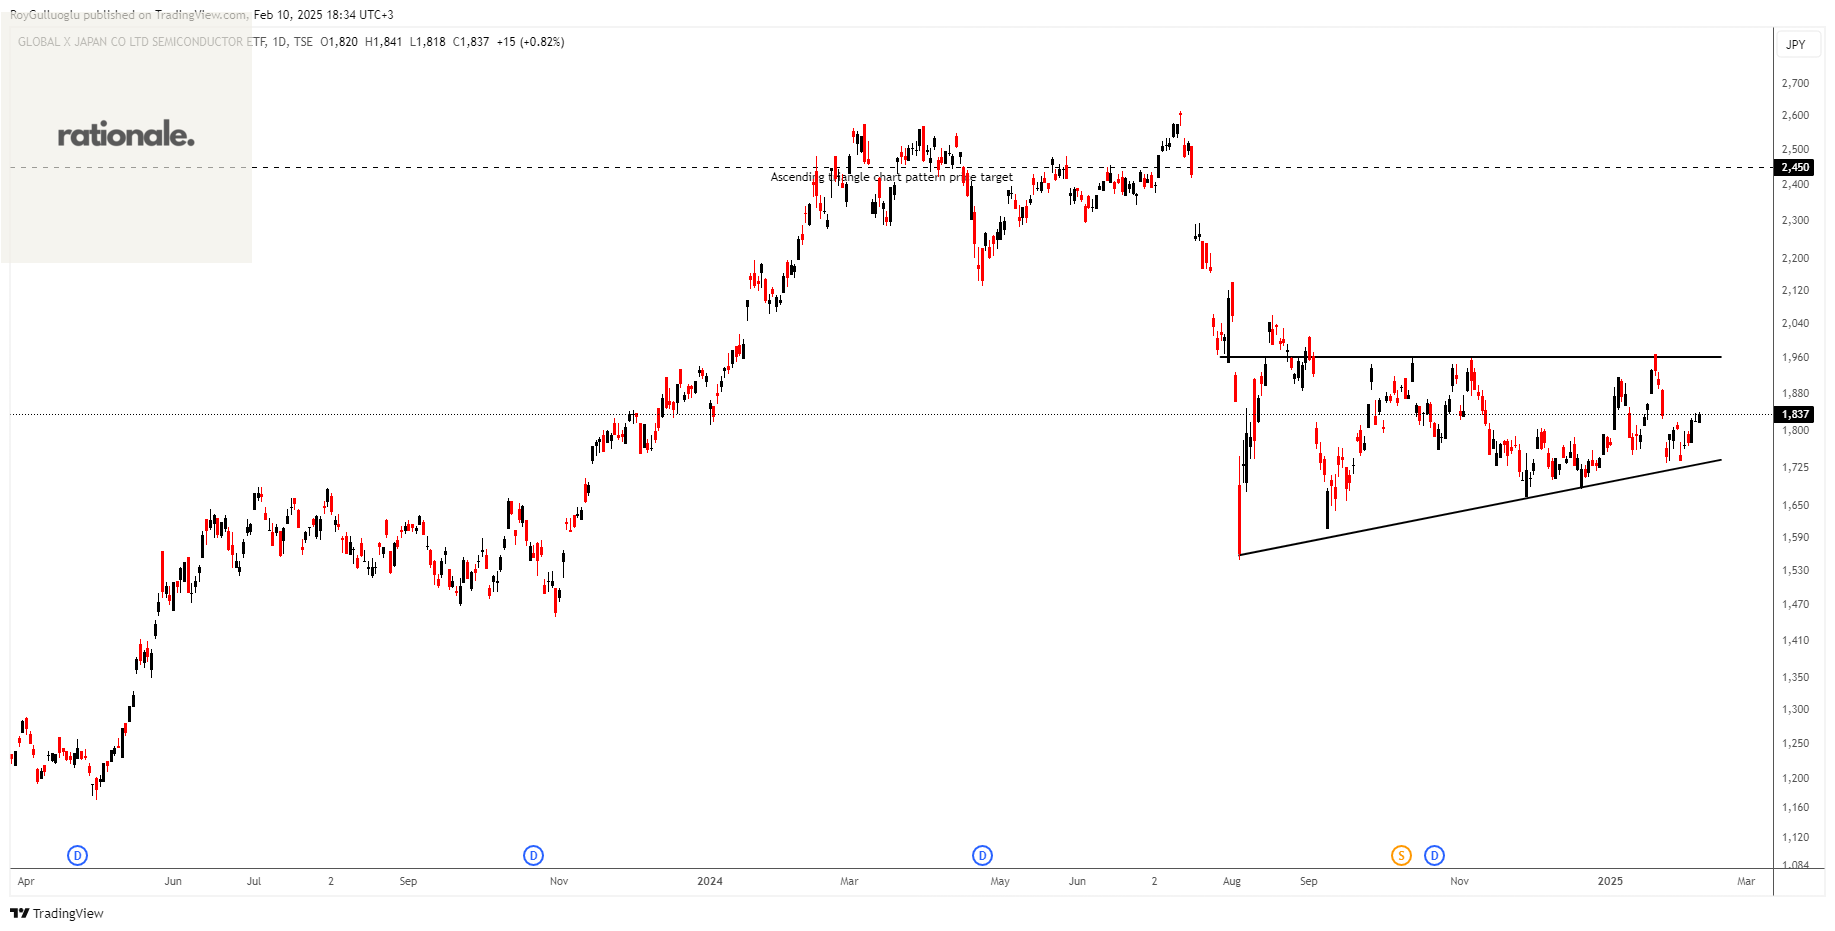
The Global X Japan Semiconductor ETF seeks to invest in Japanese companies whose principal business is in semiconductor related industries.
The above daily chart formed an approximately 4-month-long ascending triangle chart pattern as a bullish reversal after a downtrend.
The horizontal boundary at 1963 levels acts as a resistance within this pattern.
A daily close above 2021 levels would validate the breakout from the 4-month-long ascending triangle chart pattern.
Based on this chart pattern, the potential price target is 2450 levels.
Reciprocal tariffs would be a key factor influencing Japan's semiconductor sector.
AXSUSDT-Short Idea
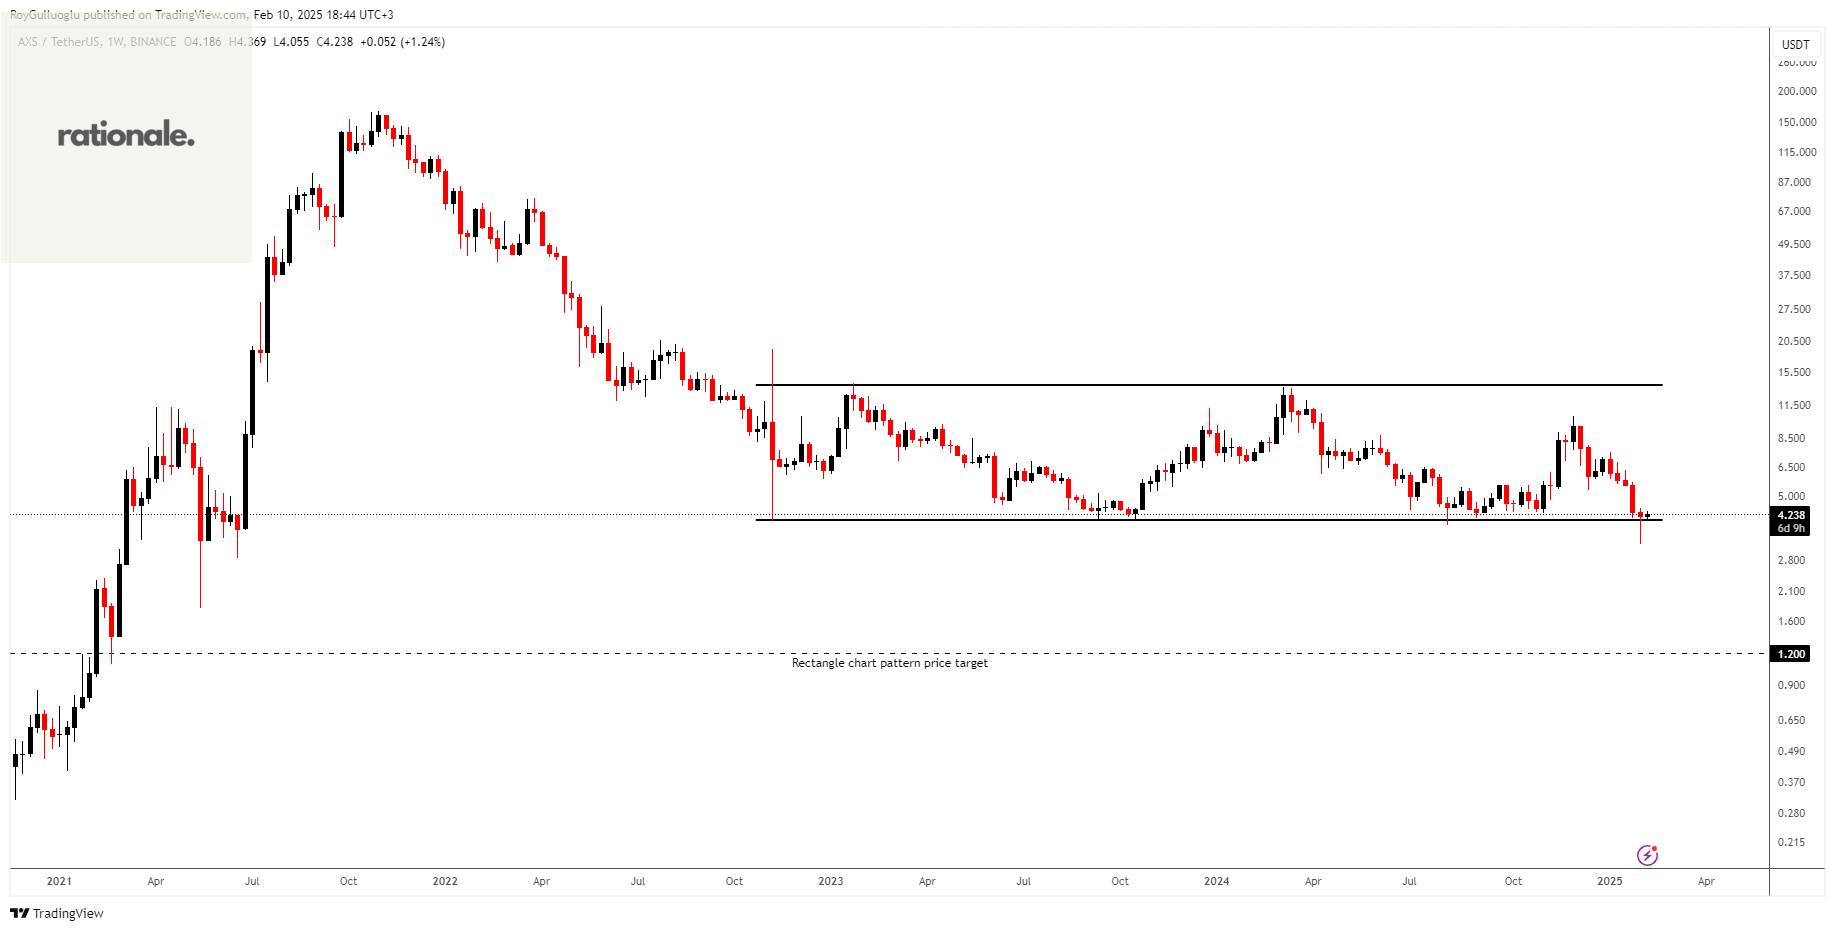
The above weekly chart formed an approximately 29-month-long rectangle chart pattern as a bearish continuation after a downtrend.
The horizontal boundary at 4.01 levels acts as a support within this pattern.
A daily close below 3.9 levels would validate the breakdown from the 29-month-long rectangle chart pattern.
Based on this chart pattern, the potential price target is approximately 1.2 levels.
The chart could move in either direction, but it's presented as a short idea since the price is trading below long-term moving averages.
ONTUSDT-Short Idea
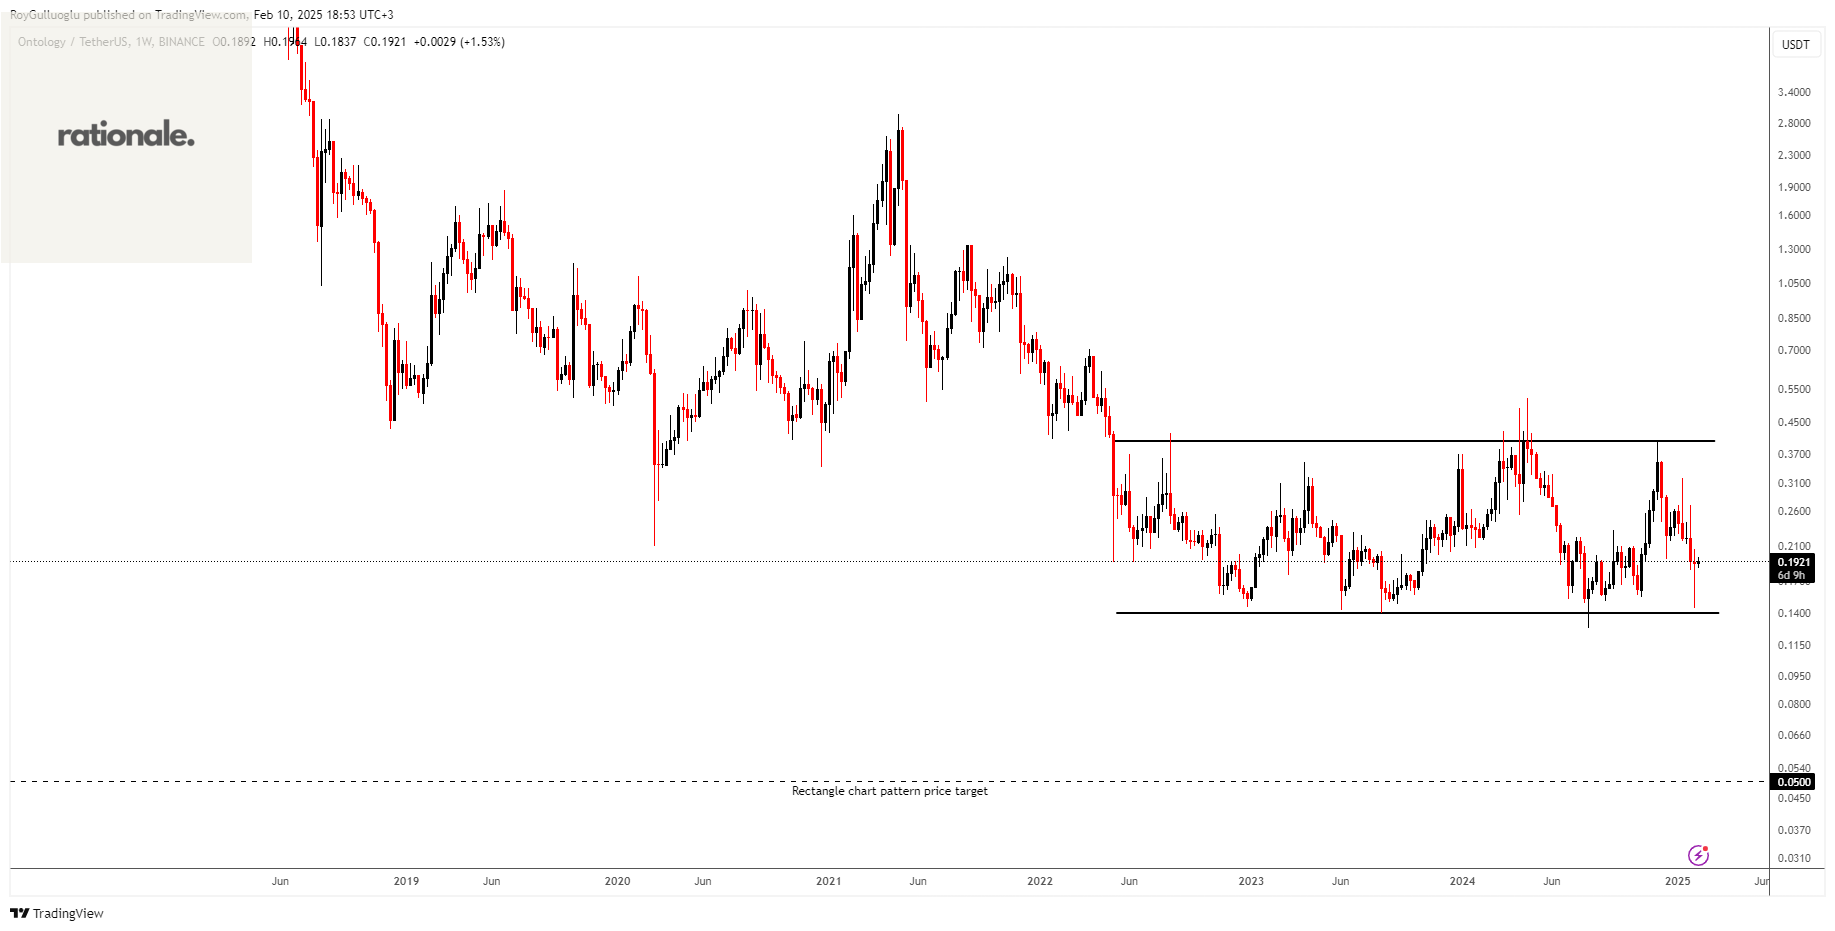
The above weekly chart formed an approximately 35-month-long rectangle chart pattern as a bearish continuation after a downtrend.
The horizontal boundary at 0.14 levels acts as a support within this pattern.
A daily close below 0.136 levels would validate the breakdown from the 35-month-long rectangle chart pattern.
Based on this chart pattern, the potential price target is approximately 0.05 levels.
The chart could move in either direction, but it's presented as a short idea since the price is trading below long-term moving averages.
Teşekkürler Roy