


Hello everyone! The new episode of the "Market Update" video is out alongside the new Rationale FX-FUTURES-ETF-CRYPTO report!
BTCUSDT-Long/Short Idea
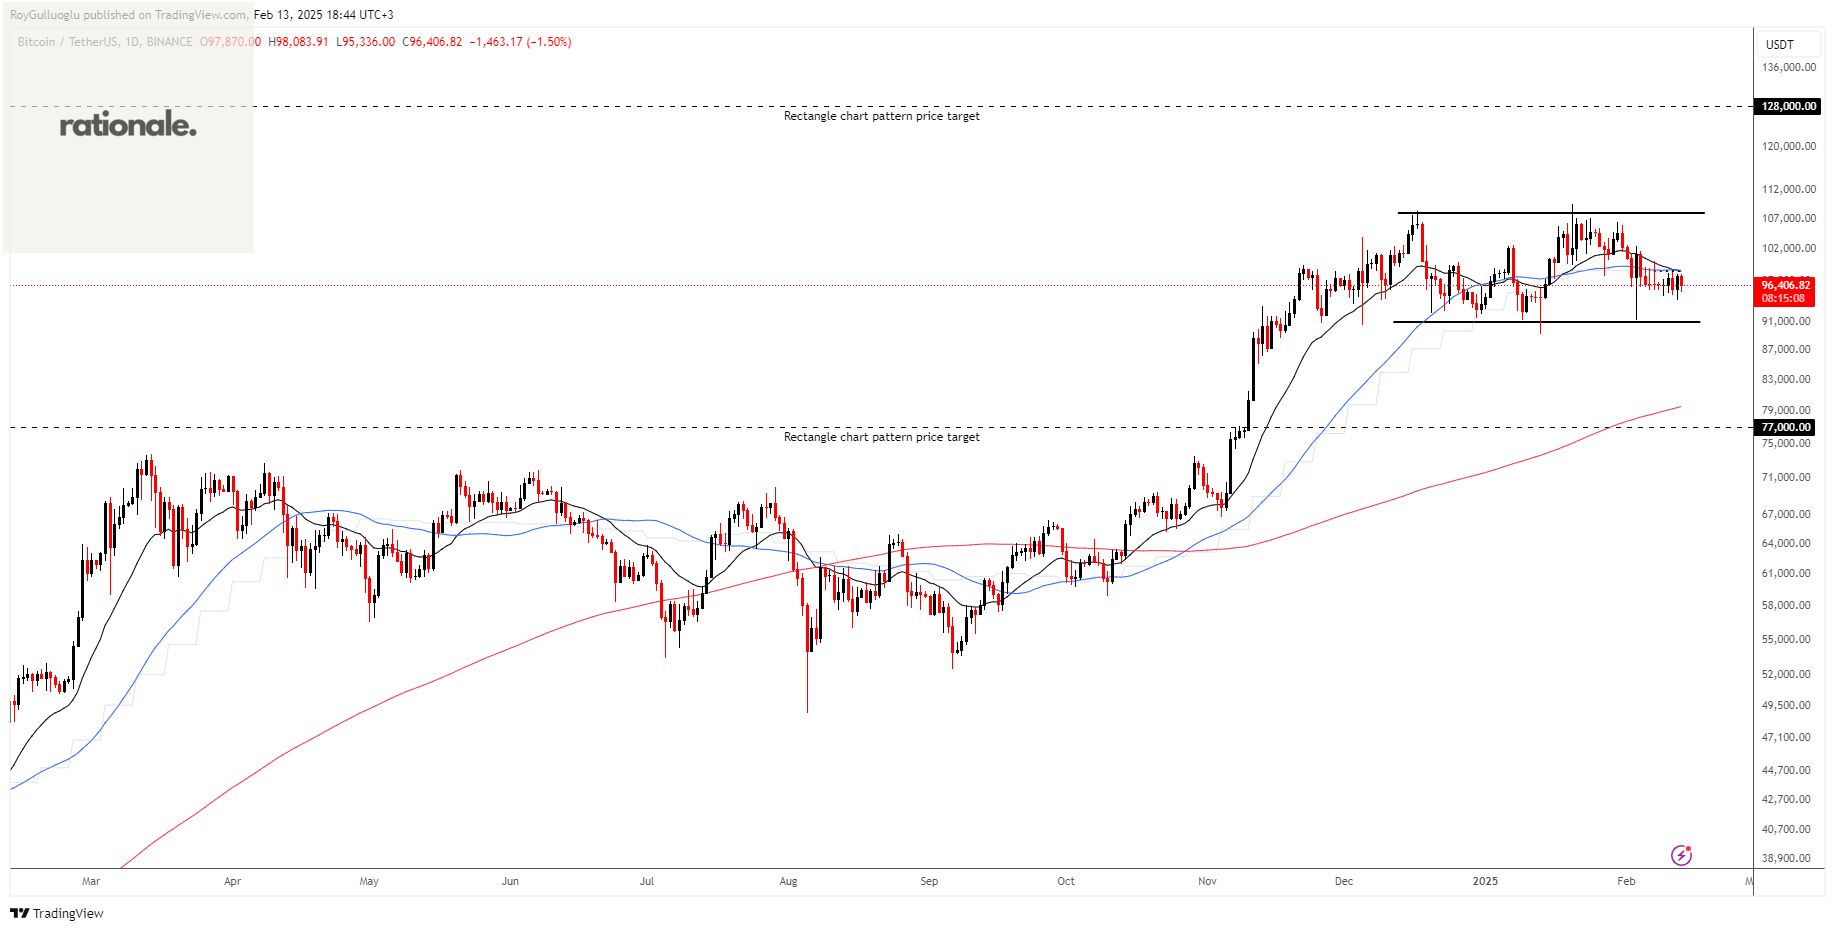
Bitcoin is still trading above the 200-day moving average, keeping my outlook bullish. However, if the price moves toward the 90,000 level while converging with the 200-day moving average and breaks down, the rectangle pattern could signal a bearish reversal after the uptrend. Therefore, I'm outlining plans for both scenarios.
Bitcoin has been consolidating for days with declining volume, suggesting that a strong price move in either direction may not be far off.
The above daily Bitcoin chart formed an approximately 2-month-long rectangle chart pattern as a bearish reversal or bullish continuation after an uptrend.
The horizontal boundary at 91000 levels acts as a support within this pattern while 108000 levels act as a resistance.
A daily close below 88300 levels would validate the breakdown and a daily close above 93700 would validate the breakout from the 2-month-long rectangle chart pattern.
Based on the chart patterns, the potential price targets are 77000 and 128000 levels respectively.
GBPNZD-Long Idea
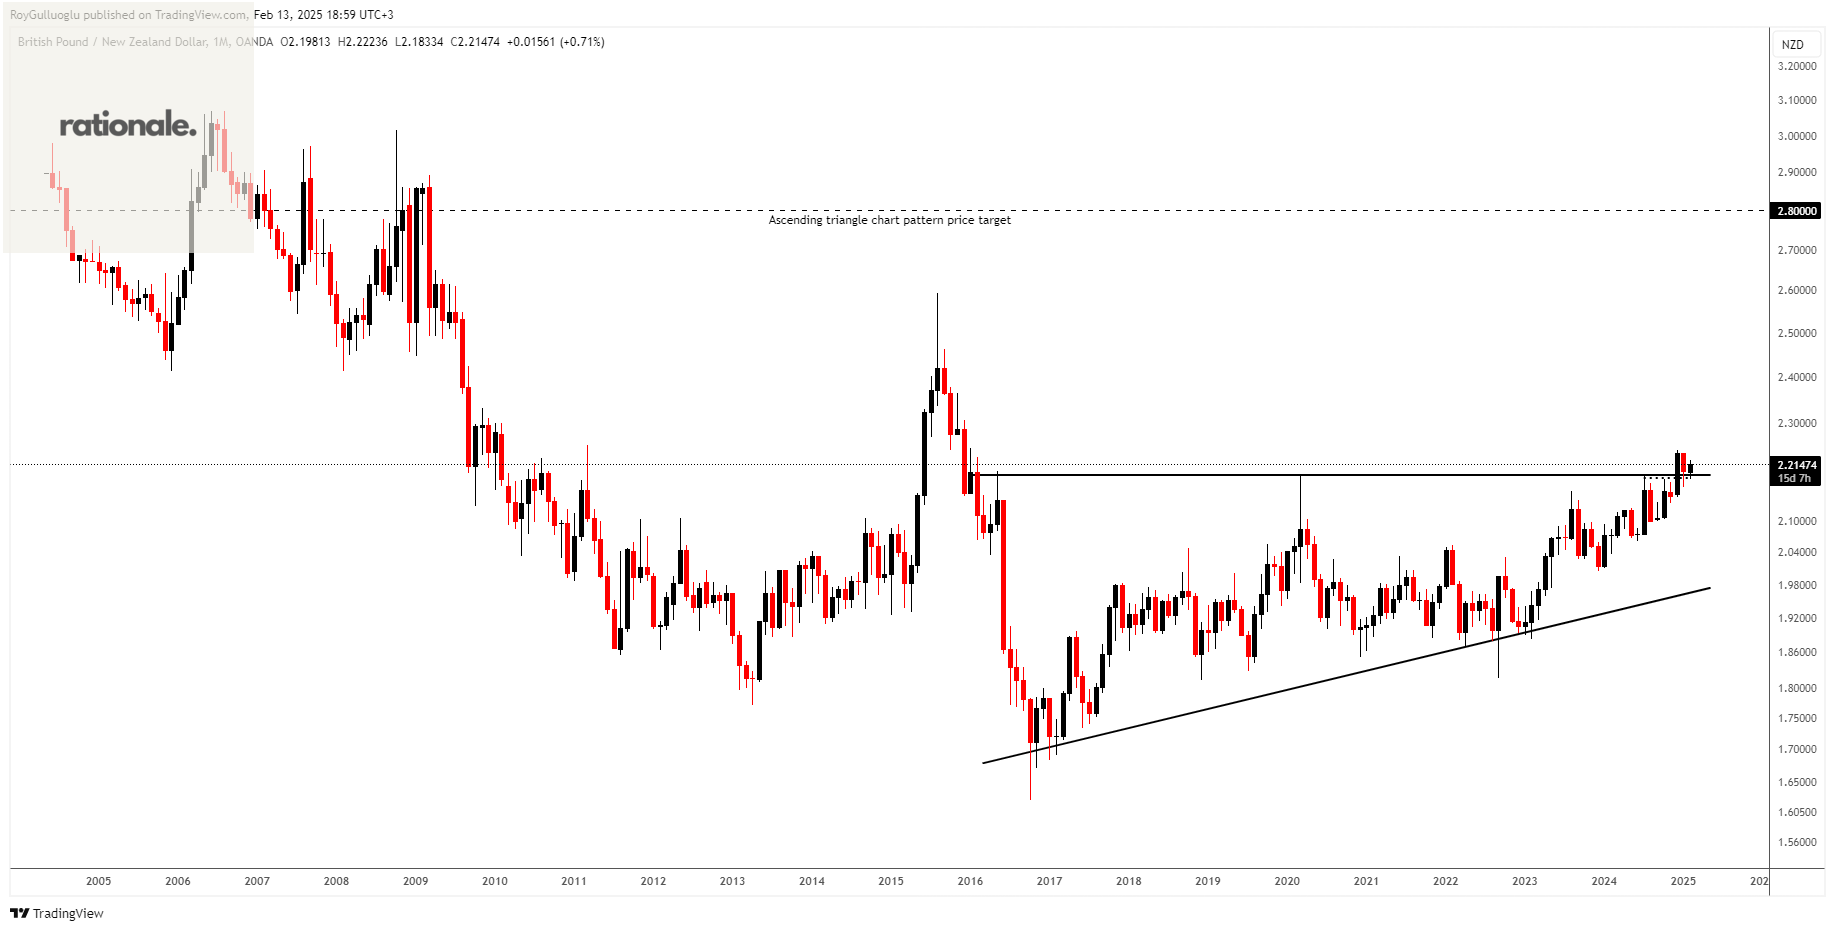
The above monthly chart formed an approximately 9-years-long ascending triangle chart pattern as a bullish reversal after a downtrend.
The horizontal boundary at 2.19 levels acted as a resistance within this pattern.
A daily close above 2.22 levels validated the breakout from the 9-year-long ascending triangle chart pattern.
Based on this chart pattern, the potential price target is approximately 2.8 levels.
The price pulled back after the breakout and reacted to the 2.19 level, which has now turned from old resistance into new support. While this is a long-term setup, it’s worth keeping an eye on.
GBP Strengthening: The February monetary policy report indicated that the BoE revised its inflation forecast higher, driving GBP strength. Given the ongoing inflation risks, it makes sense to expect rates to remain elevated—despite the recent rate cut—unless there are major disruptions in economic activity.
NZD Weakness: While New Zealand also faces inflationary concerns, they are less pronounced compared to the UK. The RBNZ last cut rates in November 2024, bringing the Official Cash Rate to 4.25%, as inflation returned to its target range. Given that rates have remained elevated for a considerable time and the RBNZ has signaled the possibility of further cuts if economic conditions align with forecasts, another rate cut is highly likely. This contrasts with the UK, where the outlook remains more uncertain due to persistent inflation risks.
Caution: NZD’s correlation with precious metals presents a risk factor. If gold continues to appreciate, it could provide support for NZD, potentially impacting this trade idea.
In summary, while both central banks have recently cut rates, the RBNZ has signaled the possibility of further cuts, whereas the BoE is more cautious due to concerns about rising inflation.
CADCHF-Long Idea
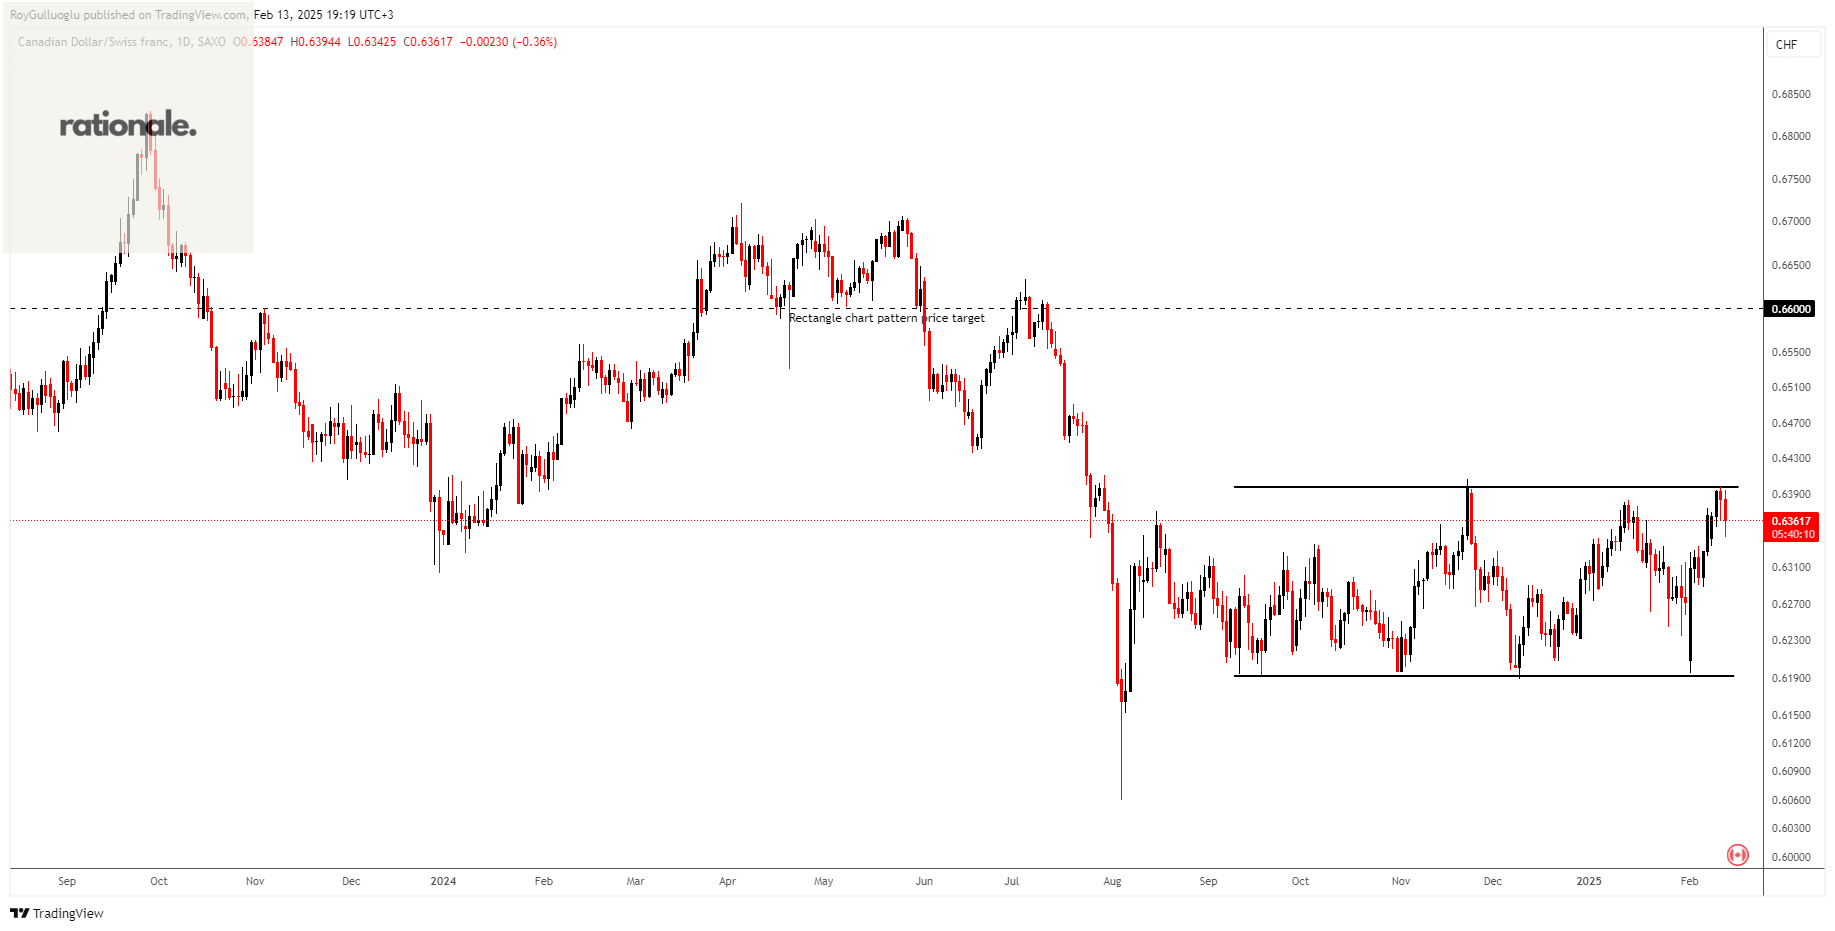
The above daily chart formed an approximately 4-month-long rectangle chart pattern as a bullish reversal after a downtrend.
The horizontal boundary at 0.6398 levels acts as a support within this pattern.
A daily close above 0.646 levels would validate the breakdown from the 4-month-long rectangle chart pattern.
Based on this chart pattern, the potential price target is approximately 0.66 levels.