


CADJPY-Short Idea
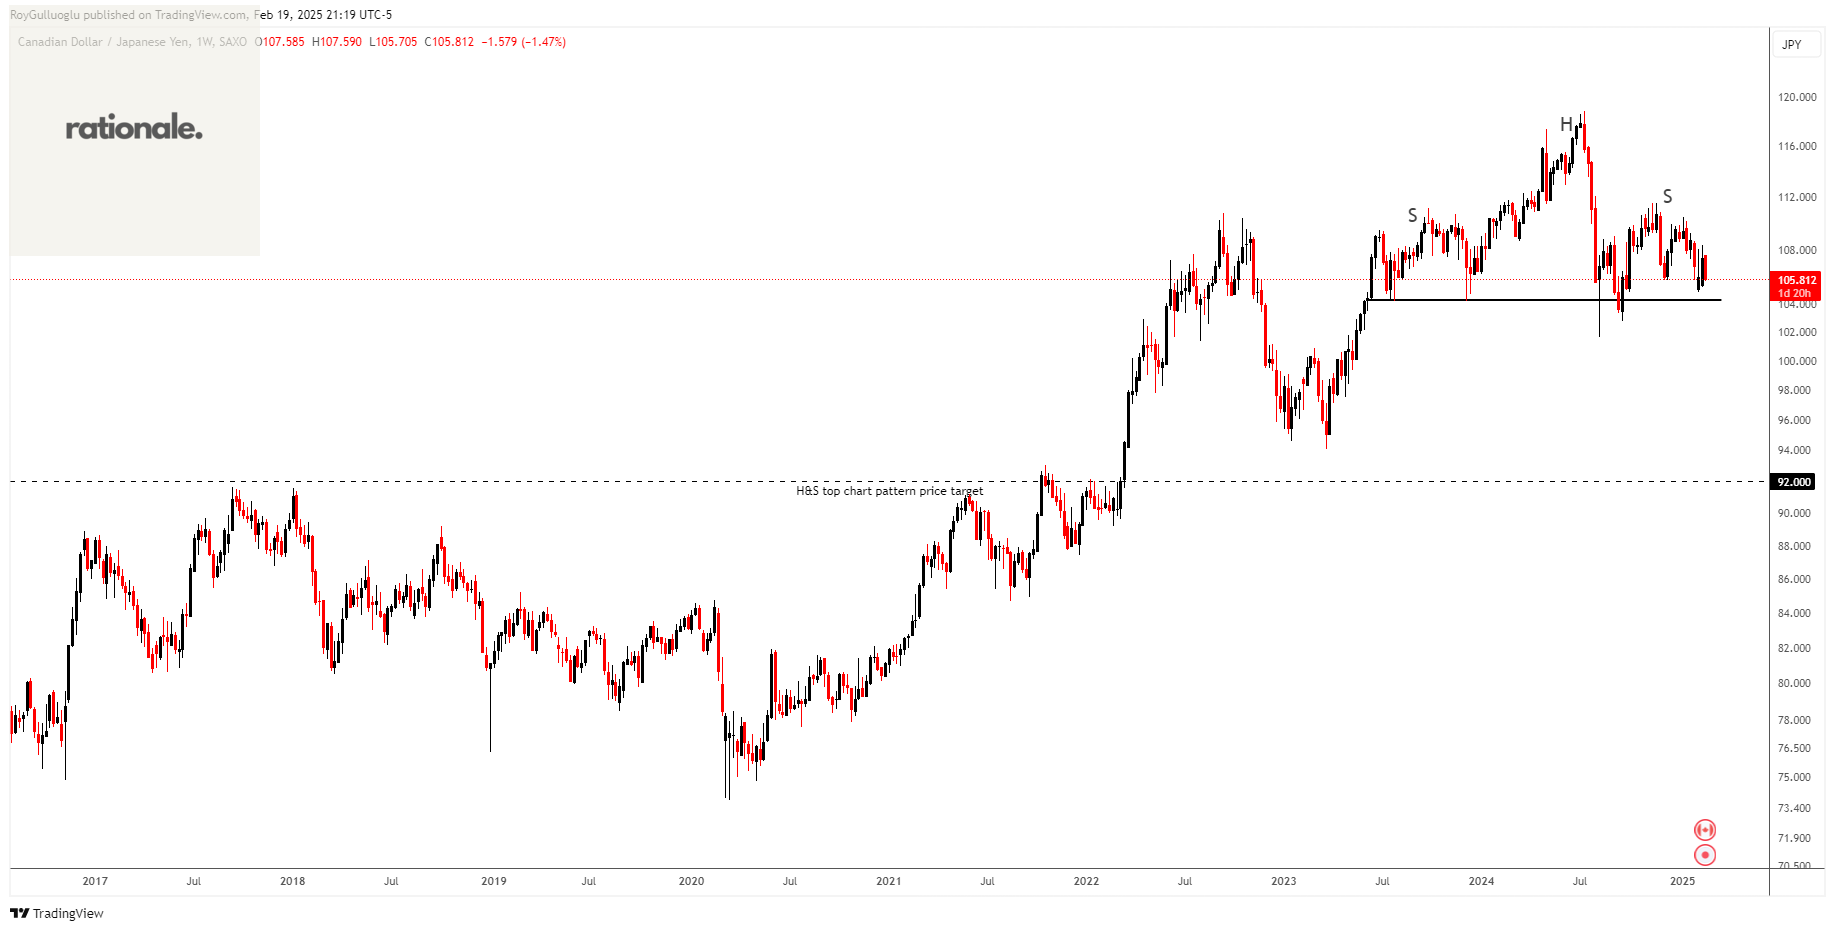
Despite January’s inflation spike potentially delaying rate cuts, CAD remains vulnerable due to tariff sensitivity and expectations of declining oil prices. Rate cuts are still likely as uncertainty persists. Meanwhile, JPY is supported by its ongoing hiking path and stronger-than-expected growth, reinforcing a bearish outlook for CADJPY.
The above weekly chart formed an approximately 22-month-long H&S top chart pattern as a bearish reversal after an uptrend.
The horizontal boundary at 104.3 levels acts as a support within this pattern.
A daily close below 103.25 levels would validate the breakdown from the 22-month-long H&S top chart pattern.
Based on this chart pattern, the potential price target is approximately 92 levels.
United States Oil Fund-(USO/ARCA)-Long/Short Idea
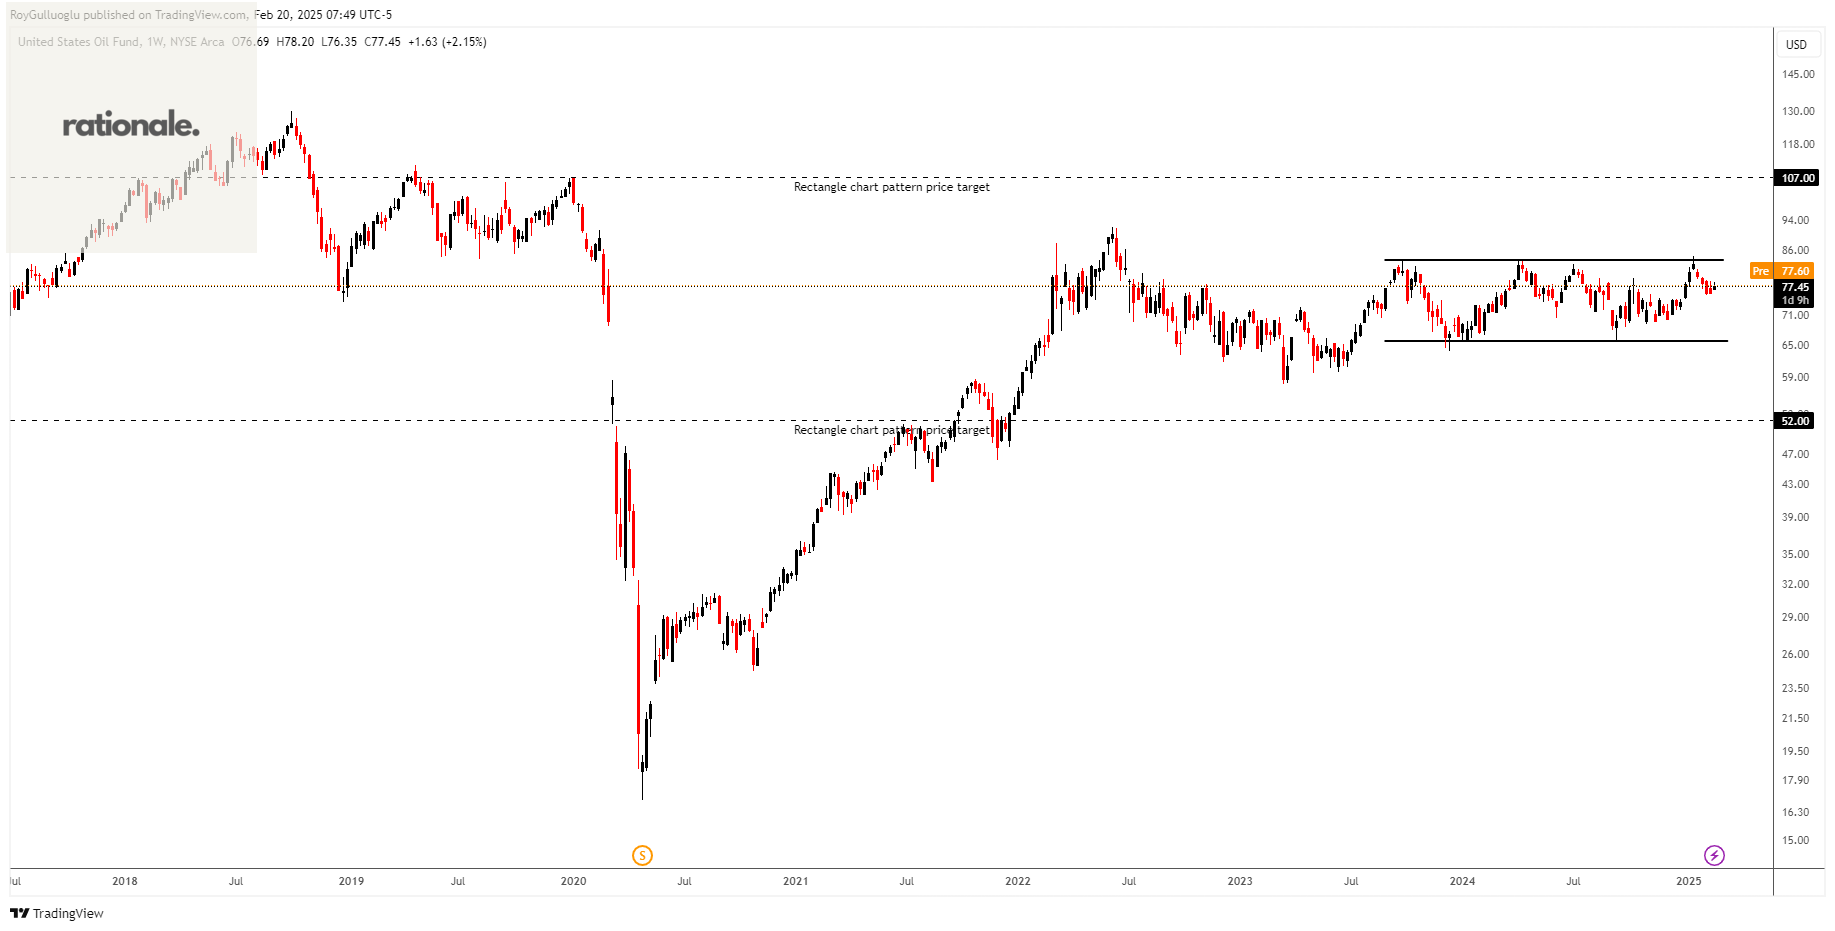
The above daily USO chart formed an approximately 3-month-long rectangle chart pattern as a bearish reversal or bullish continuation after an uptrend.
The horizontal boundary at 65.73 levels acts as a support within this pattern while 83.57 levels act as a resistance.
A daily close below 63.75 levels would validate the breakdown and a daily close above 86 would validate the breakout from the 3-month-long rectangle chart pattern.
Based on the chart patterns, the potential price targets are 52 and 107 levels respectively.
NKNUSDT-Short Idea
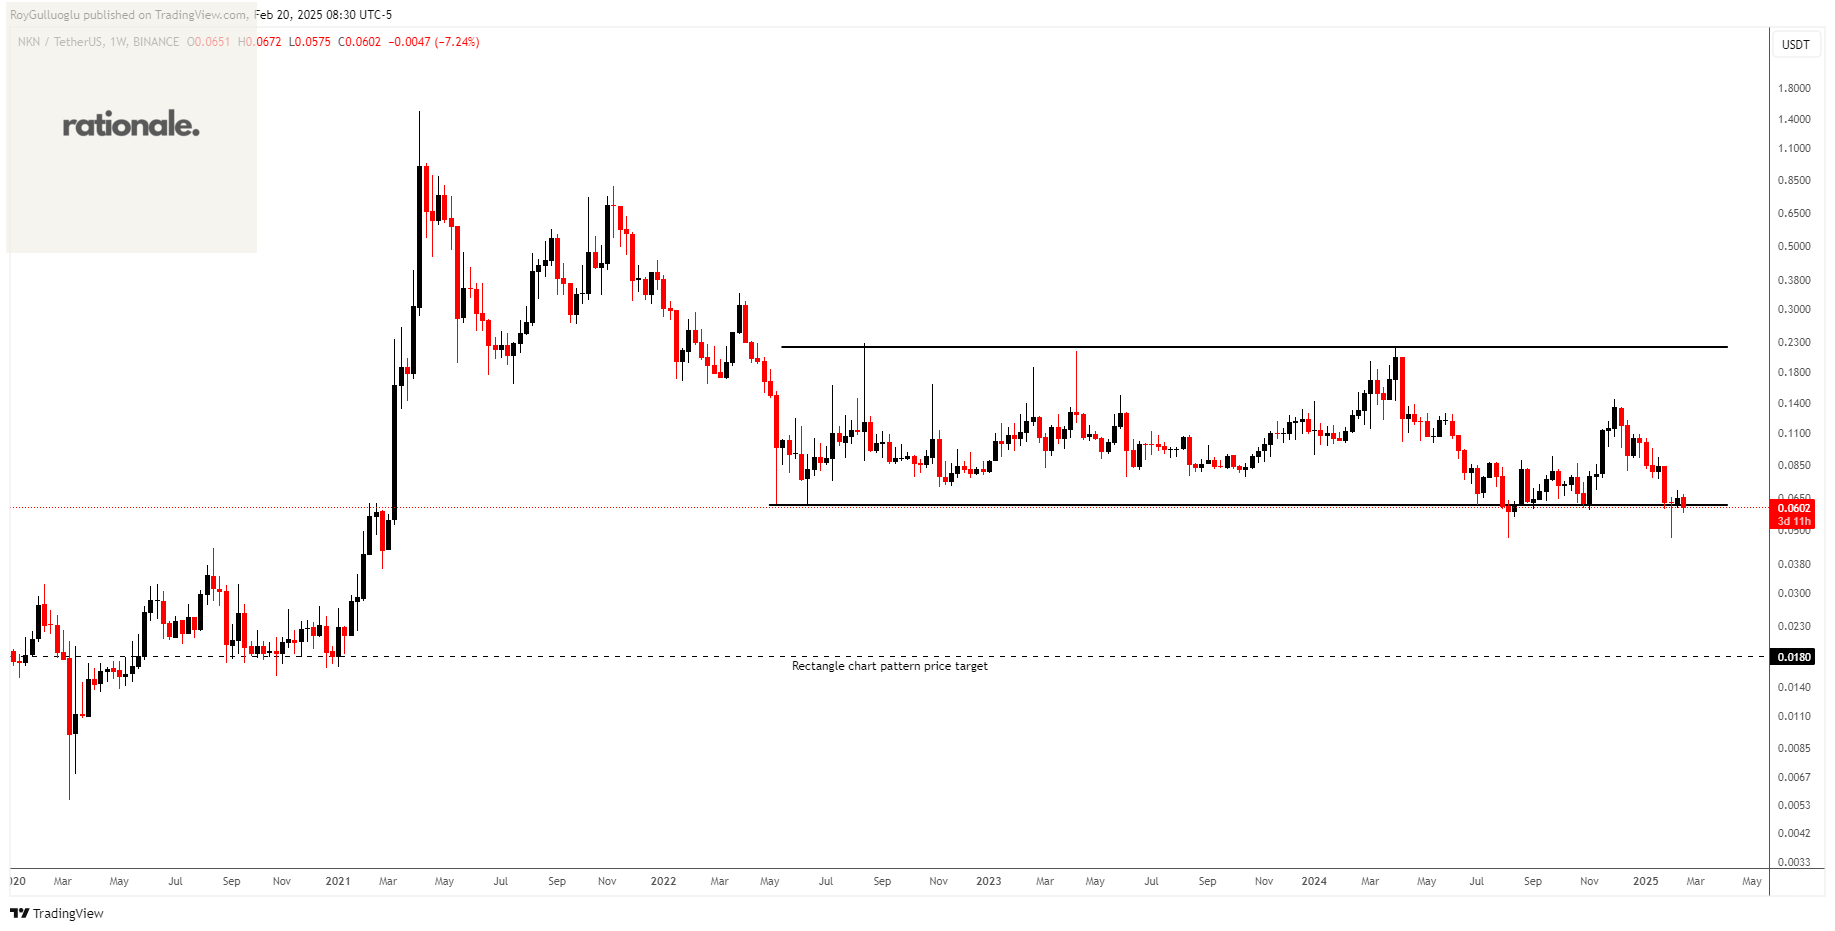
The above weekly chart formed an approximately 36-month-long rectangle chart pattern as a bearish continuation after a downtrend.
The horizontal boundary at 0.06 levels acts as a resistance within this pattern.
A daily close below 0.058 levels would validate the breakdown from the 36-month-long rectangle chart pattern.
Based on this chart pattern, the potential price target is approximately 0.018 levels
XLMUSDT-Short Idea
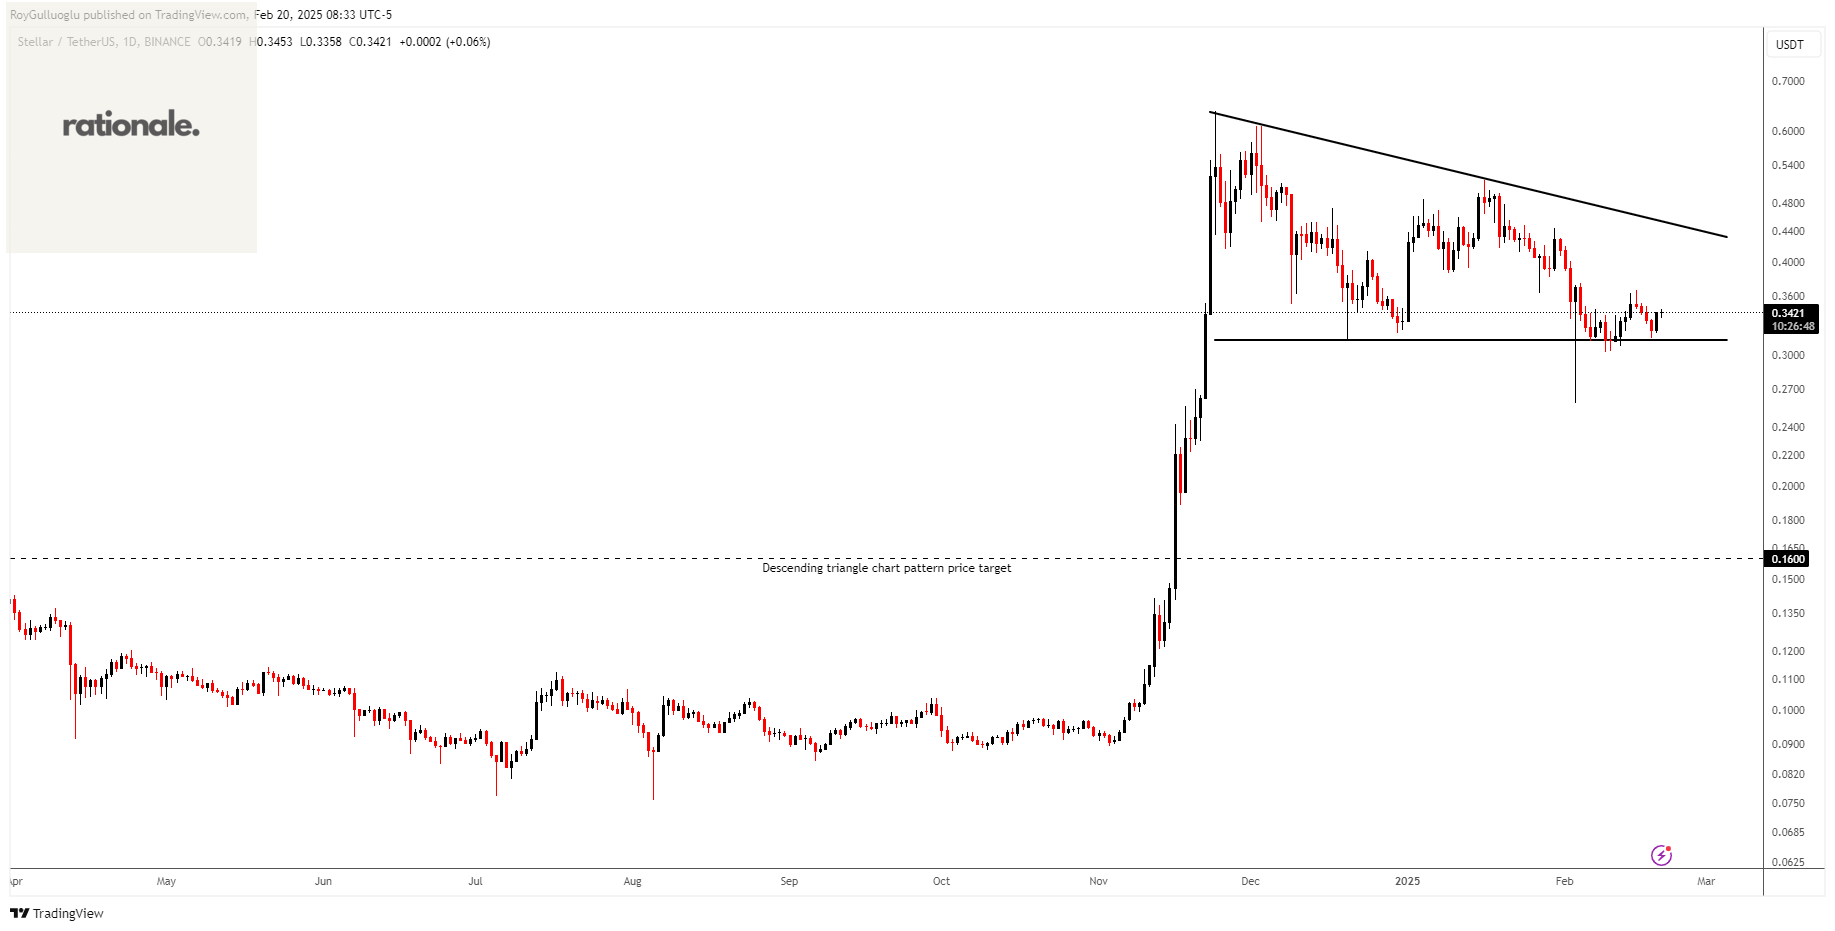
The above daily chart formed an approximately 3-month-long descending triangle chart pattern as a bearish reversal after an uptrend.
The horizontal boundary at 0.314 levels acts as a resistance within this pattern.
A daily close below 0.3045 levels would validate the breakout from the 3-month-long descending triangle chart pattern.
Based on this chart pattern, the potential price target is approximately 0.16 levels