

Trade Ideas Equities
DY(NYSE), ITT(NYSE), CNH(NYSE), JYSK(OMXCOP), DIXON(NSE), TRP(TSX)

Dycom Industries, Inc.-(DY/NYSE)-Short Idea
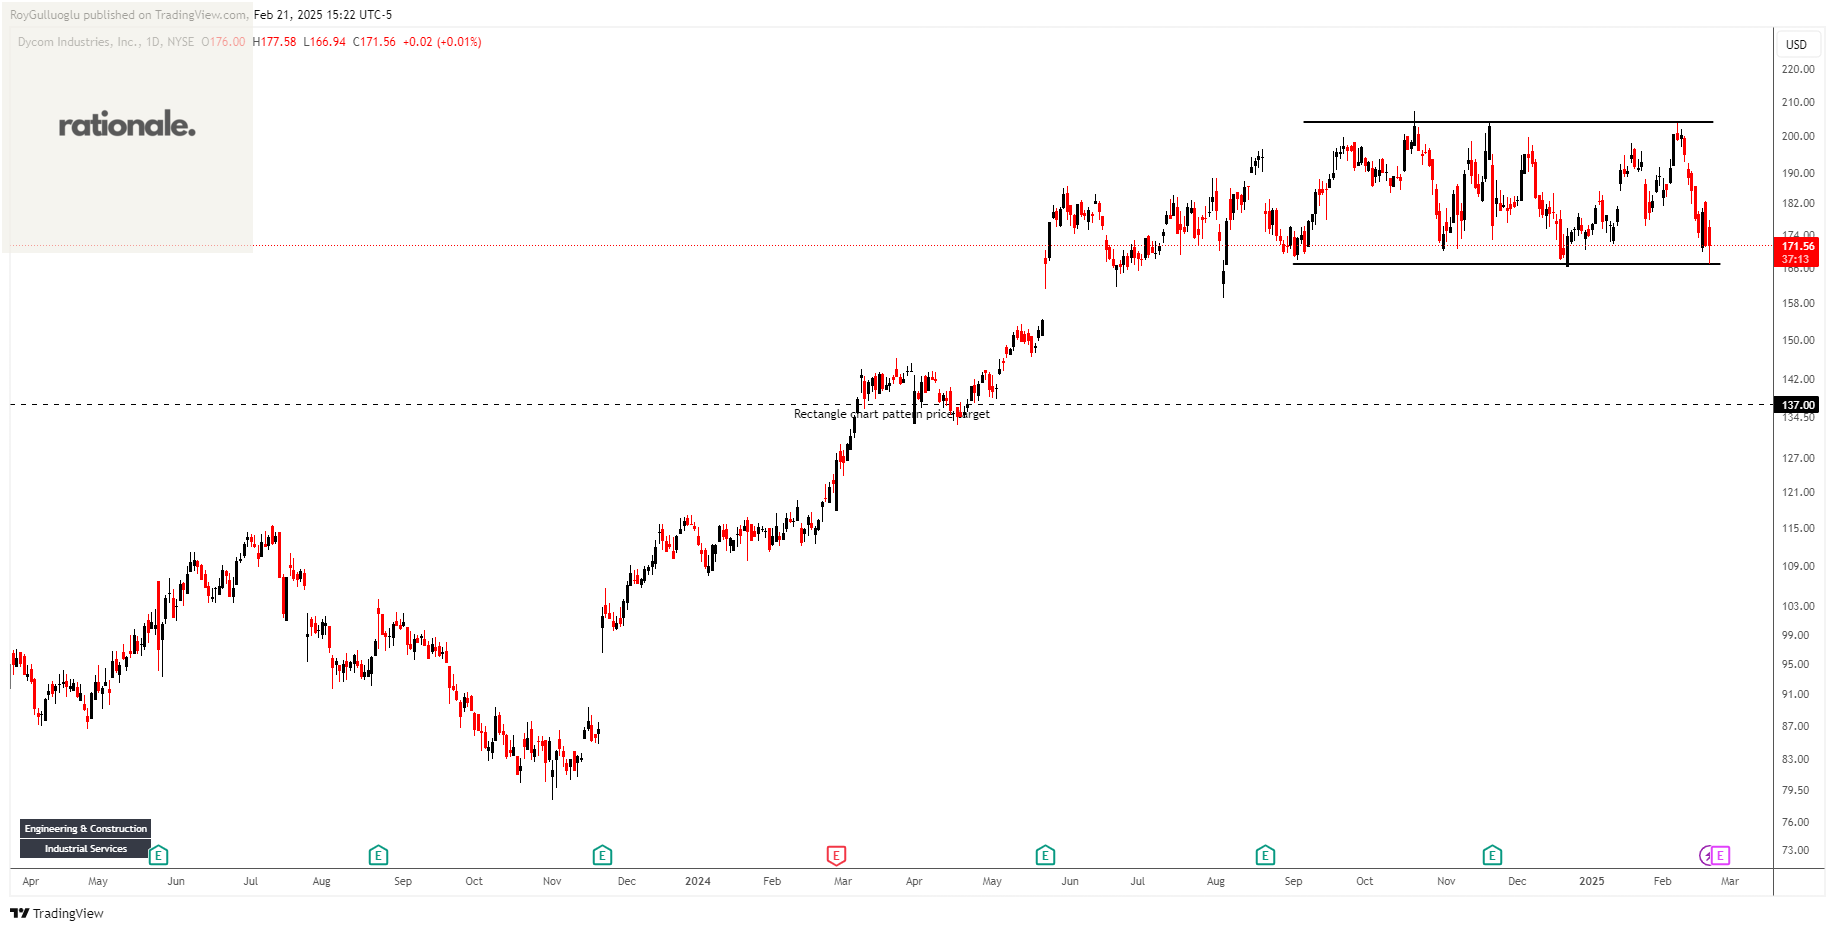
Dycom Industries, Inc. provides specialty contracting services to the telecommunications infrastructure and utility industries in the United States.
The above daily chart formed an approximately 4-month-long rectangle chart pattern as a bearish reversal after an uptrend.
The horizontal boundary at 167 levels acts as a support within this pattern.
A daily close below 162 levels would validate the breakdown from the 4-month-long rectangle chart pattern.
Based on this chart pattern, the potential price target is 137 levels.
DY, classified under the "industrials" sector, falls under the “Mid Cap - Value” stock category.
ITT Inc.-(ITT/NYSE)-Short Idea
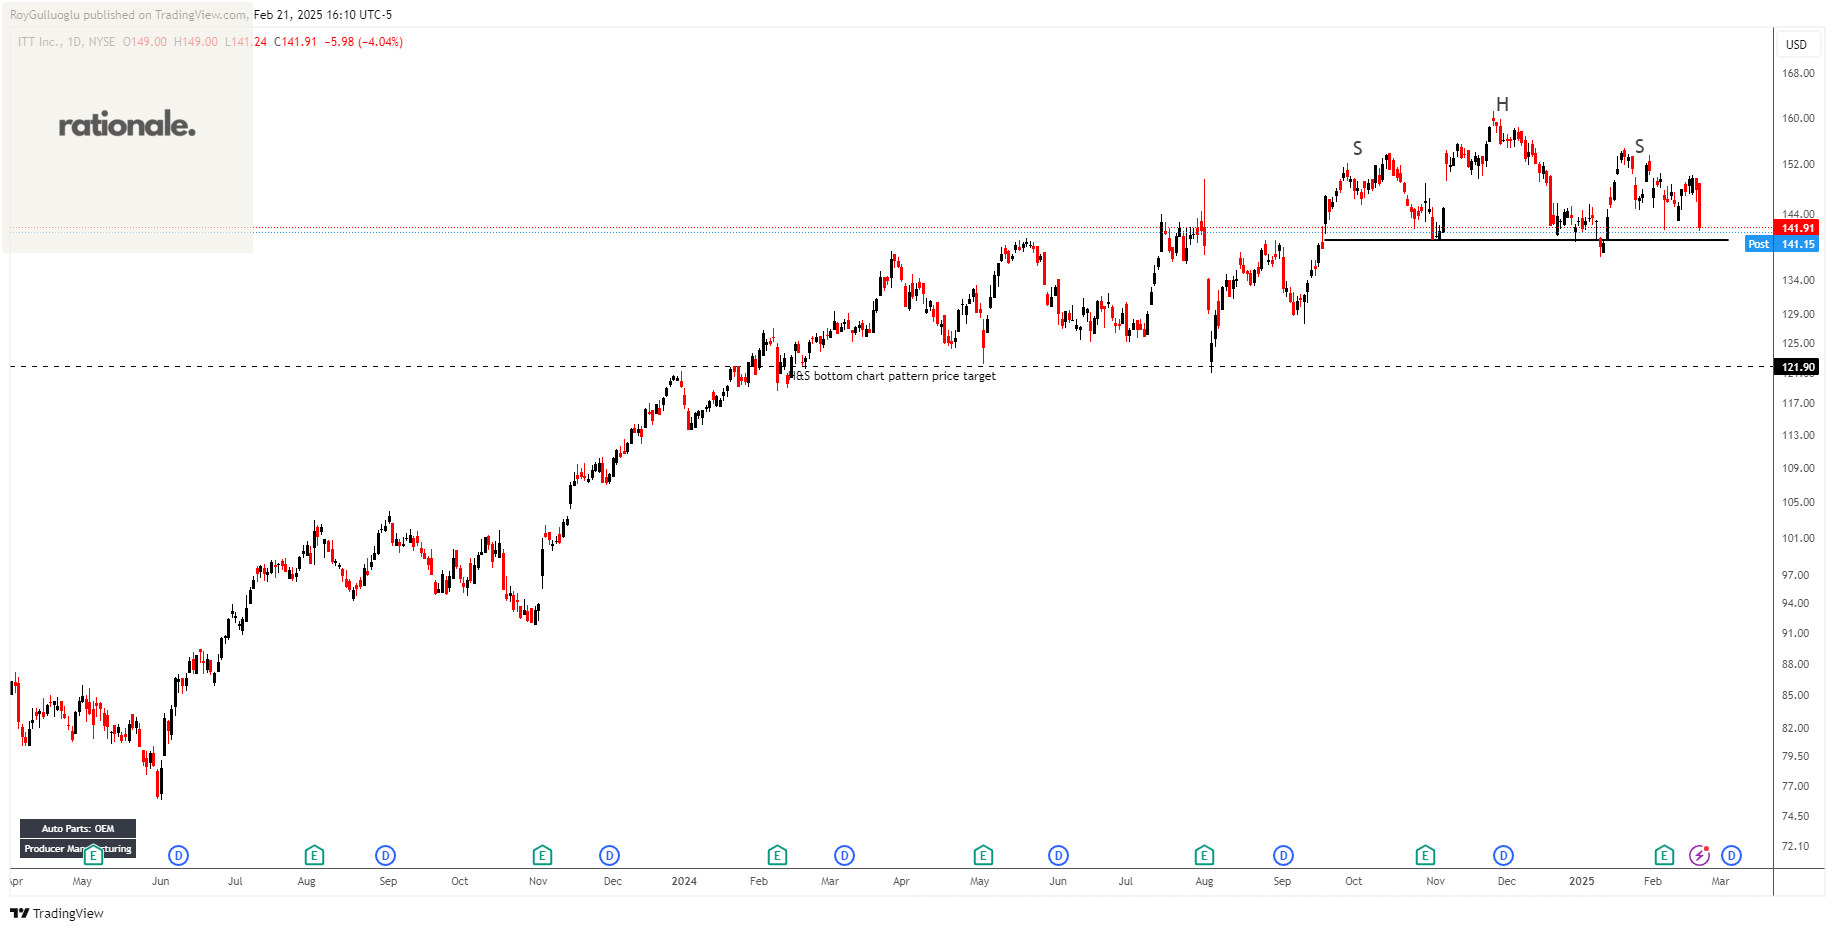
ITT Inc., together with its subsidiaries, manufactures and sells engineered critical components and customized technology solutions for the transportation, industrial, and energy markets in North America, Europe, Asia, the Middle East, Africa, and South America.
The above daily chart formed an approximately 3-month-long H&S top chart pattern as a bearish reversal after an uptrend.
The horizontal boundary at 139.9 levels acts as a support within this pattern.
A daily close below 135.7 levels would validate the breakdown from the 3-month-long H&S top chart pattern.
Based on this chart pattern, the potential price target is 121.9 levels.
ITT, classified under the "industrials" sector, falls under the “Large Cap - Value” stock category.
CNH Industrial N.V.-(CNH/NYSE)-Long Idea
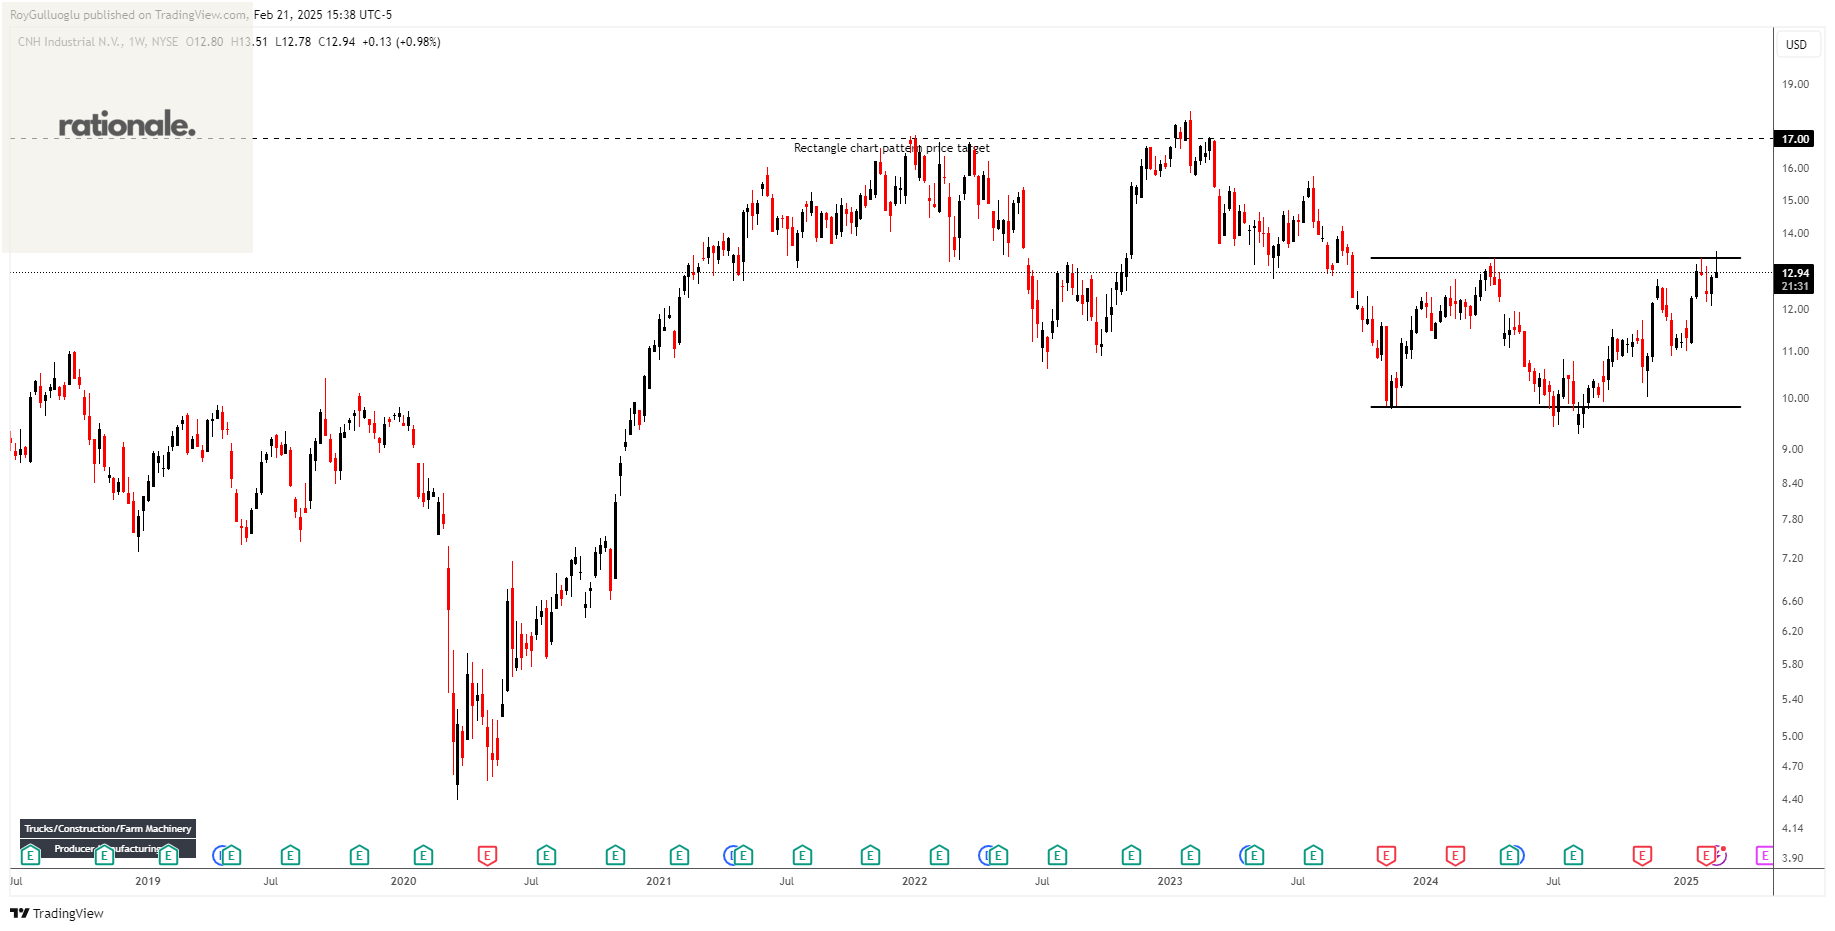
CNH Industrial N.V., an equipment and services company, engages in the design, production, marketing, sale, and financing of agricultural and construction equipment in North America, Europe, the Middle East, Africa, South America, and the Asia Pacific.
The above weekly chart formed an approximately 15-month-long rectangle chart pattern as a bullish reversal after a downtrend.
The horizontal boundary at 13.3 levels acts as a resistance within this pattern.
A daily close above 13.7 levels would validate the breakout from the 15-month-long rectangle chart pattern.
Based on this chart pattern, the potential price target is 17 levels.
CNH, classified under the "industrials" sector, falls under the “Large Cap - Value” stock category.
Jyske Bank A/S-(JYSK/OMXCOP)-Long Idea
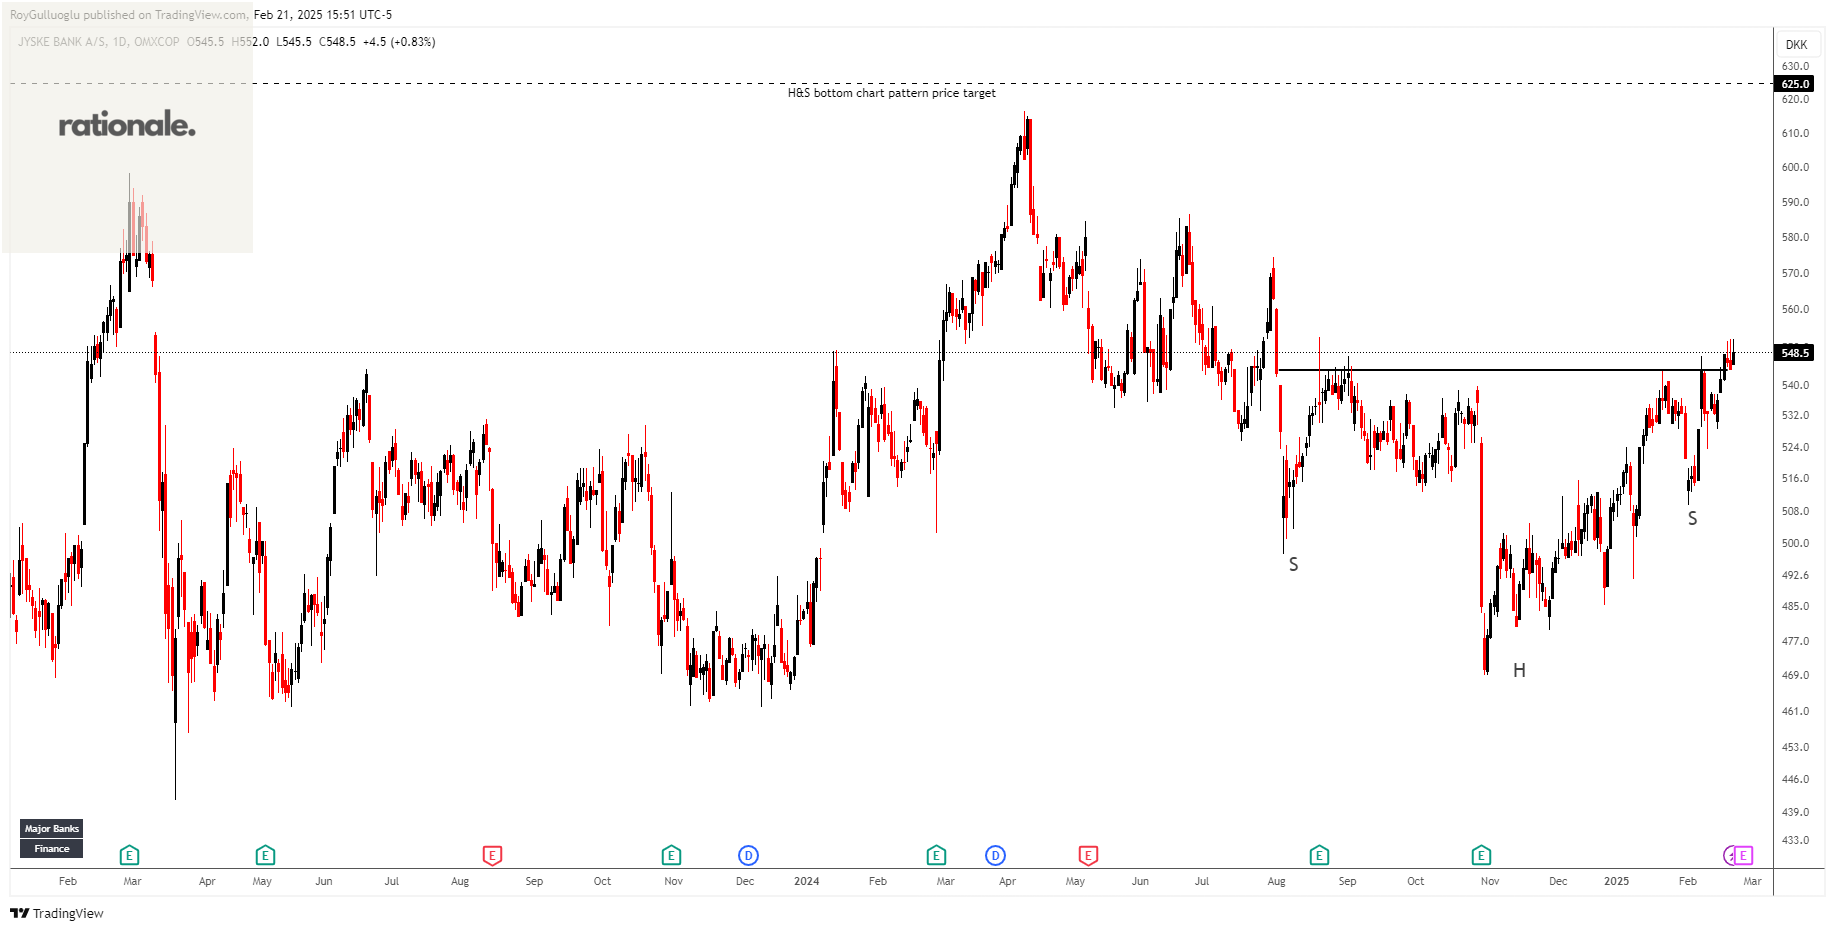
Jyske Bank A/S provides various financial solutions in Denmark and Germany. The company operates through Banking Activities, Mortgage Activities, and Leasing Activities segments.
The above daily chart formed an approximately 4-month-long H&S bottom chart pattern as a bullish reversal after a downtrend.
The horizontal boundary at 544 levels acts as a resistance within this pattern.
A daily close above 560 levels would validate the breakout from the 4-month-long H&S bottom chart pattern.
Based on this chart pattern, the potential price target is 625 levels.
JYSK, classified under the "financial services" sector, falls under the “Mid Cap - Income” stock category.
Dixon Technologies (India) Limited-(DIXON/NSE)-Short Idea
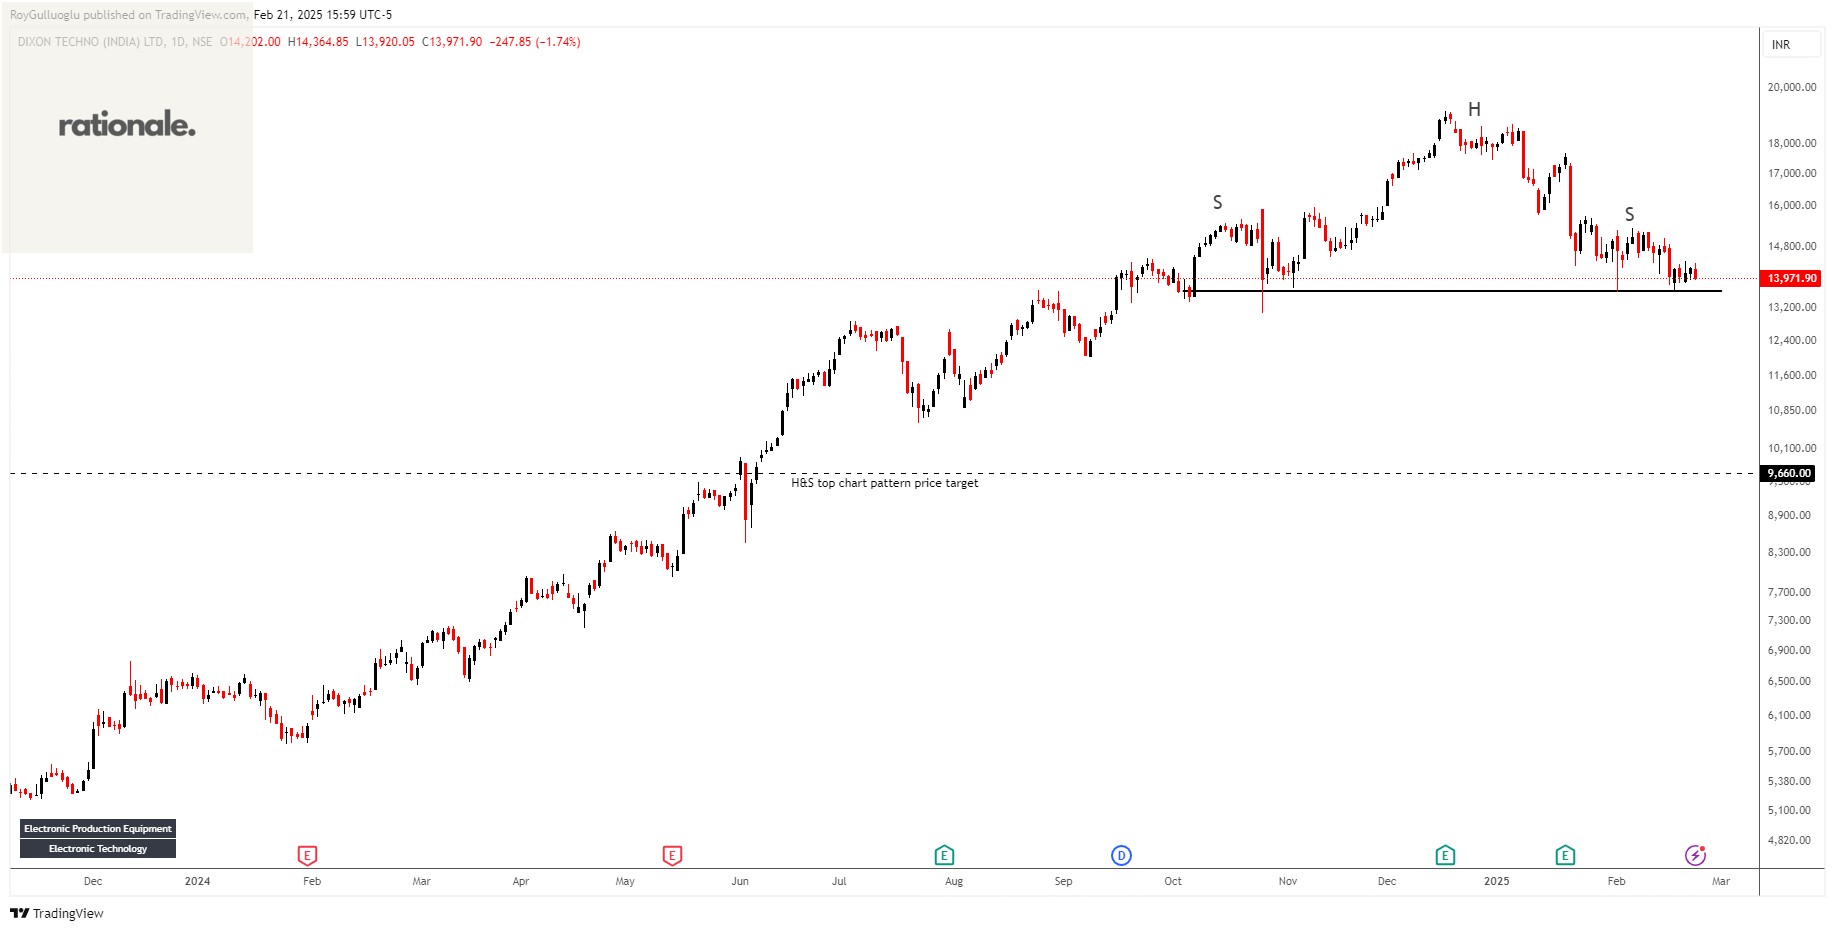
Dixon Technologies (India) Limited engages in the provision of electronic manufacturing services in India and internationally.
The above weekly chart formed an approximately 3-month-long H&S top chart pattern as a bearish reversal after an uptrend.
The horizontal boundary at 13613 levels acts as a support within this pattern.
A daily close below 13205 levels would validate the breakdown from the 3-month-long H&S top chart pattern.
Based on this chart pattern, the potential price target is 9660 levels.
DIXON, classified under the "technology" sector, falls under the “Mid Cap - Growth” stock category.
TC Energy Corporation-(TRP/TSX)-Short Idea
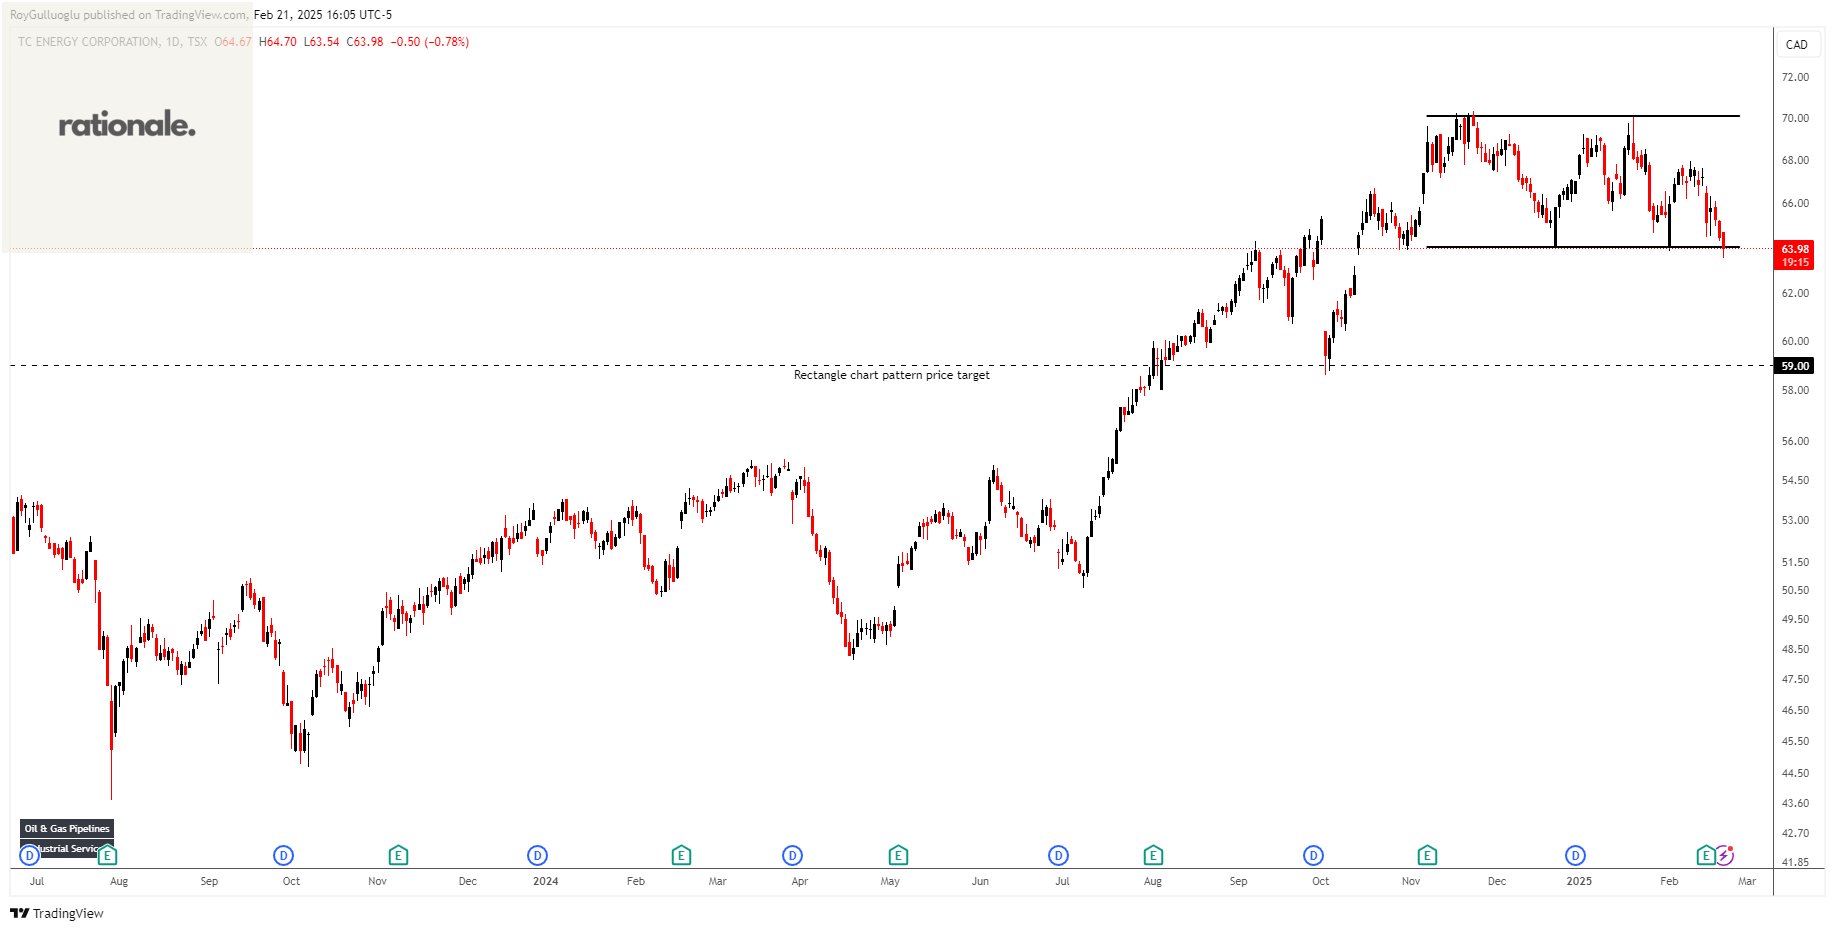
TC Energy Corporation operates as an energy infrastructure company in North America. It operates through four segments: Canadian Natural Gas Pipelines; U.S. Natural Gas Pipelines; Mexico Natural Gas Pipelines; and Power and Energy Solutions.
The above daily chart formed an approximately 3-month-long rectangle chart pattern as a bearish reversal after an uptrend.
The horizontal boundary at 64 levels acts as a support within this pattern.
A daily close below 62.08 levels would validate the breakdown from the 4-month-long rectangle chart pattern.
Based on this chart pattern, the potential price target is 59 levels.
TRP, classified under the "energy" sector, falls under the “Large Cap - Income” stock category.
Teşekkürler Roy