

Trade Ideas Equities
NTNX(NASDAQ), BRC(NYSE), GBDC(NASDAQ), AKBNK(BIST), MAZDOCK(NSE), CAPLIPOINT(NSE), PRU(LSE)

Nutanix, Inc.-(NTNX/NASDAQ)-Long Idea
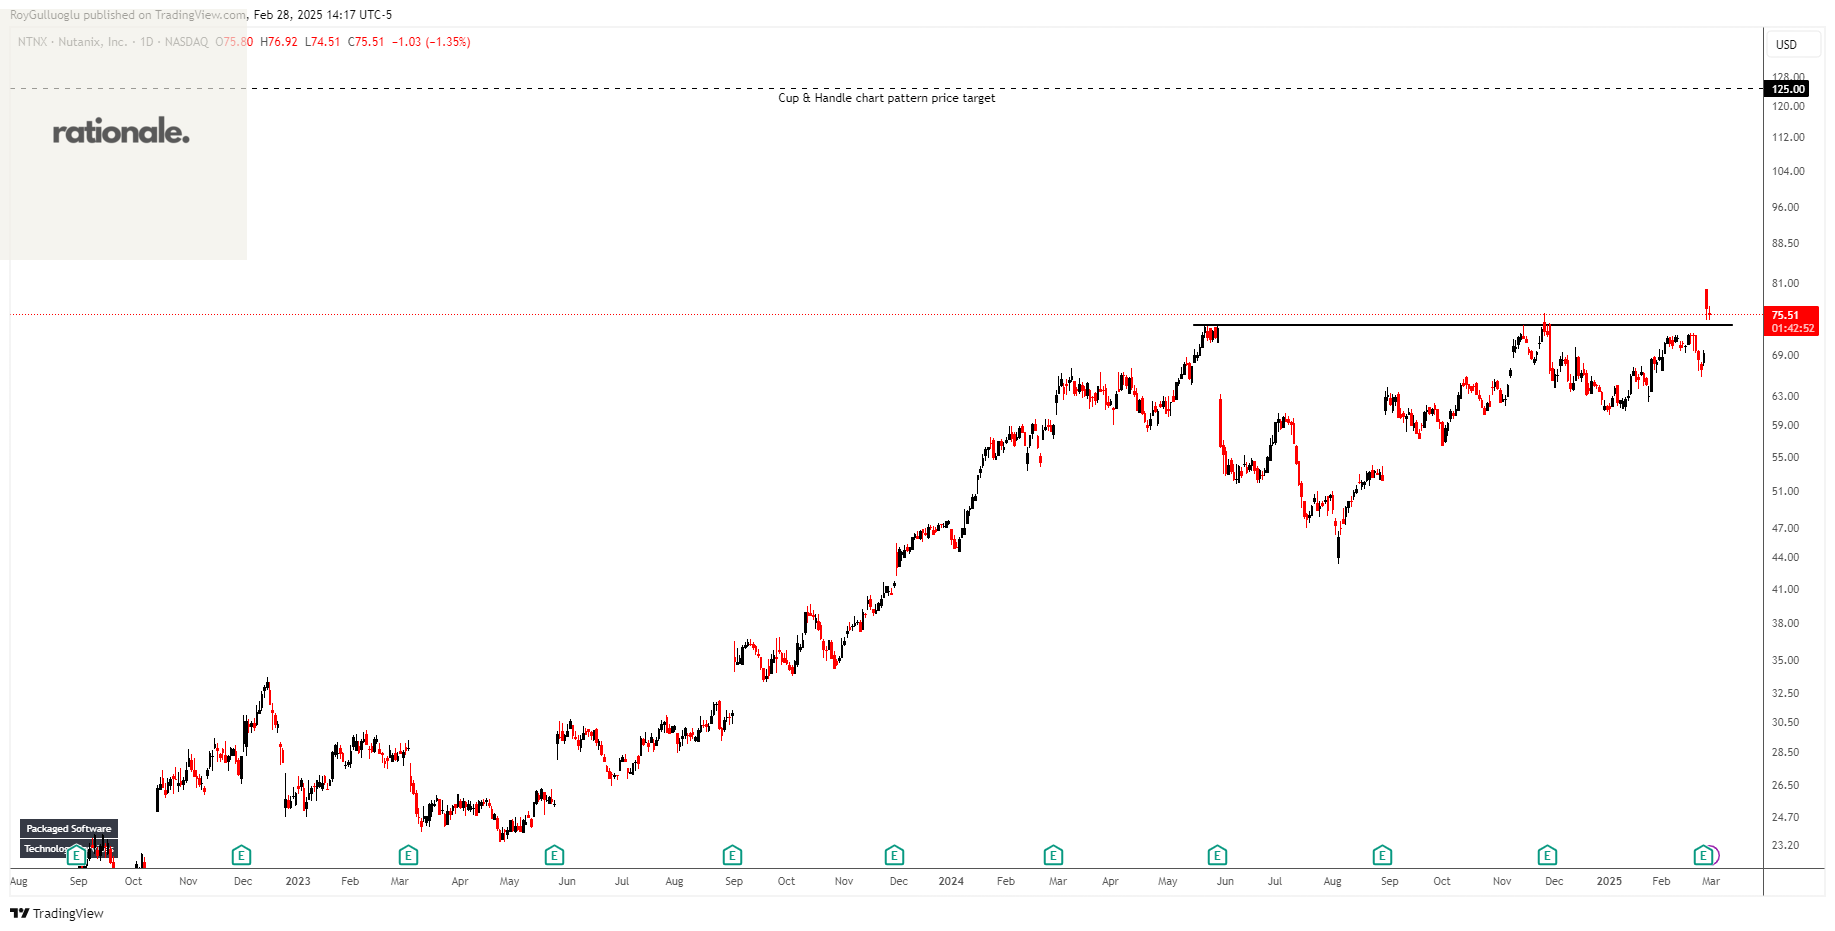
Nutanix, Inc. provides an enterprise cloud platform in North America, Europe, the Asia Pacific, the Middle East, Latin America, and Africa.
The above daily chart formed an approximately 6-month-long cup & handle chart pattern as a bullish continuation after an uptrend.
The horizontal boundary at 73.69 levels acted as a resistance within this pattern.
A daily close above 75.9 levels validated the breakout from the 6-month-long cup & handle chart pattern.
Based on this chart pattern, the potential price target is 125 levels.
NTNX, classified under the "technology" sector, falls under the “Large Cap - Growth” stock category.
Brady Corporation-(BRC/NYSE)-Short Idea
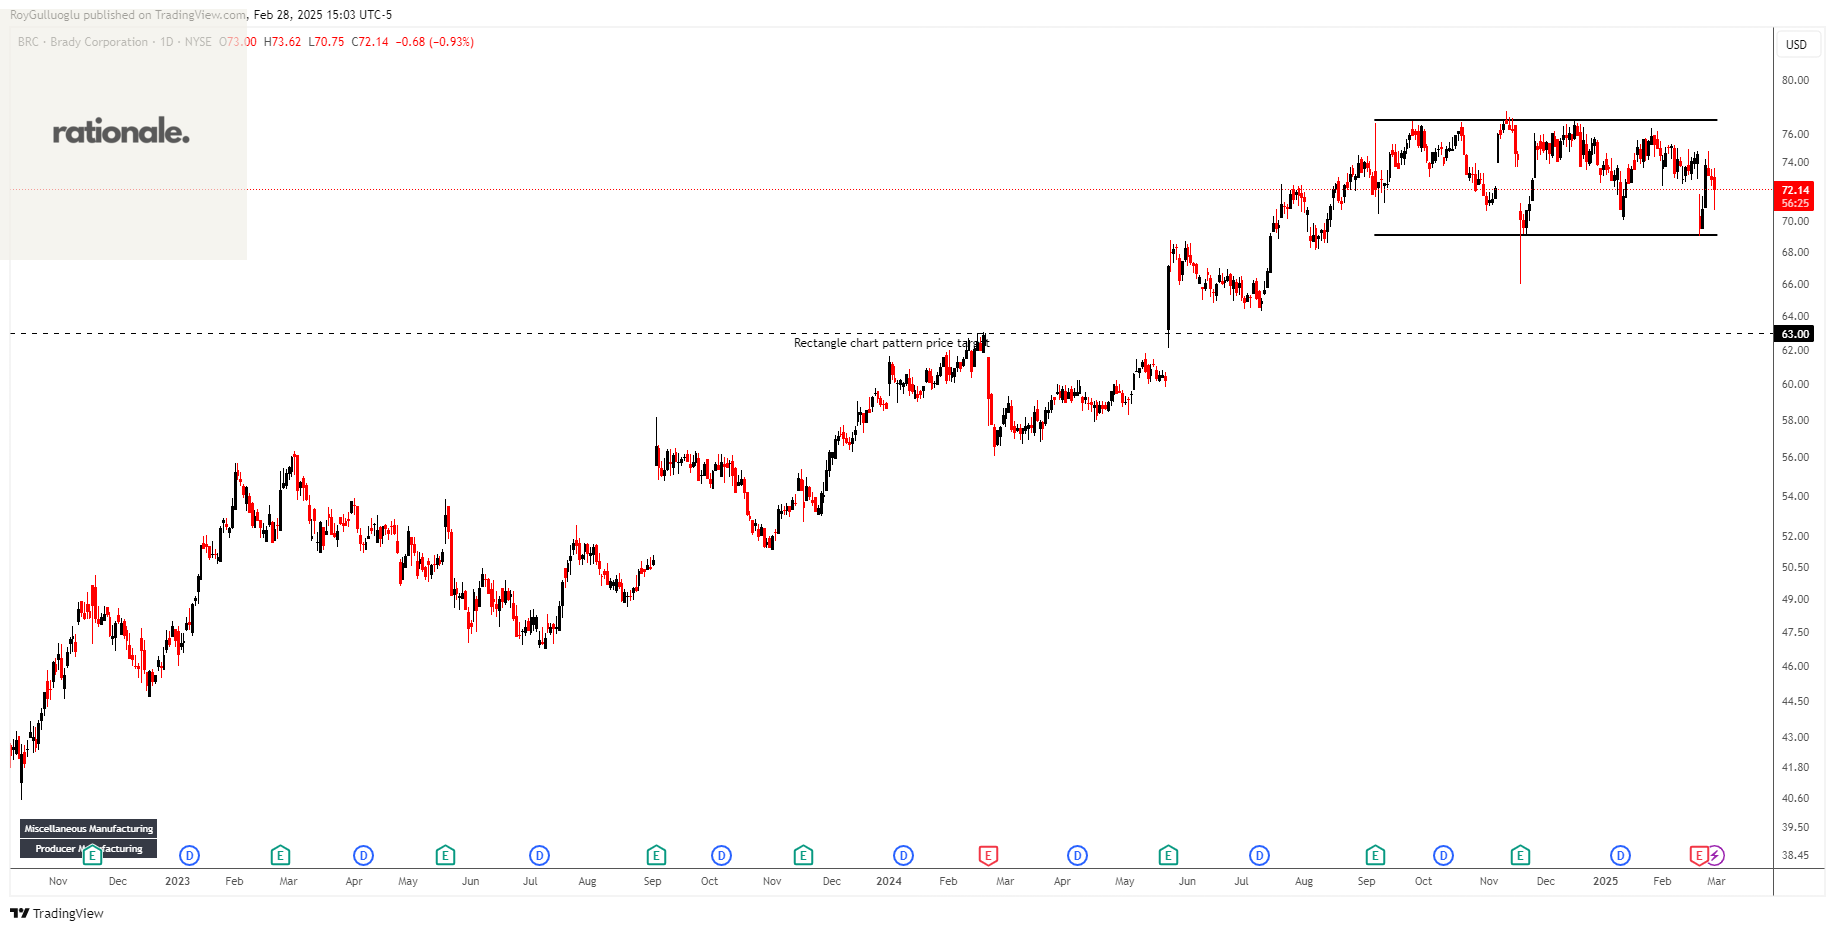
Brady Corporation manufactures and supplies identification solutions (IDS) and workplace safety (WPS) products to identify and protect premises, products, and people in the United States and internationally.
The above daily chart formed an approximately 4-month-long rectangle chart pattern as a bearish reversal after an uptrend.
The horizontal boundary at 69.08 levels acts as a support within this pattern.
A daily close below 67 levels would validate the breakdown from the 4-month-long rectangle chart pattern.
Based on this chart pattern, the potential price target is 63 levels.
BRC, classified under the "industrials" sector, falls under the “Mid Cap - Value” stock category.
Golub Capital BDC, Inc.-(GBDC/NASDAQ)-Long Idea
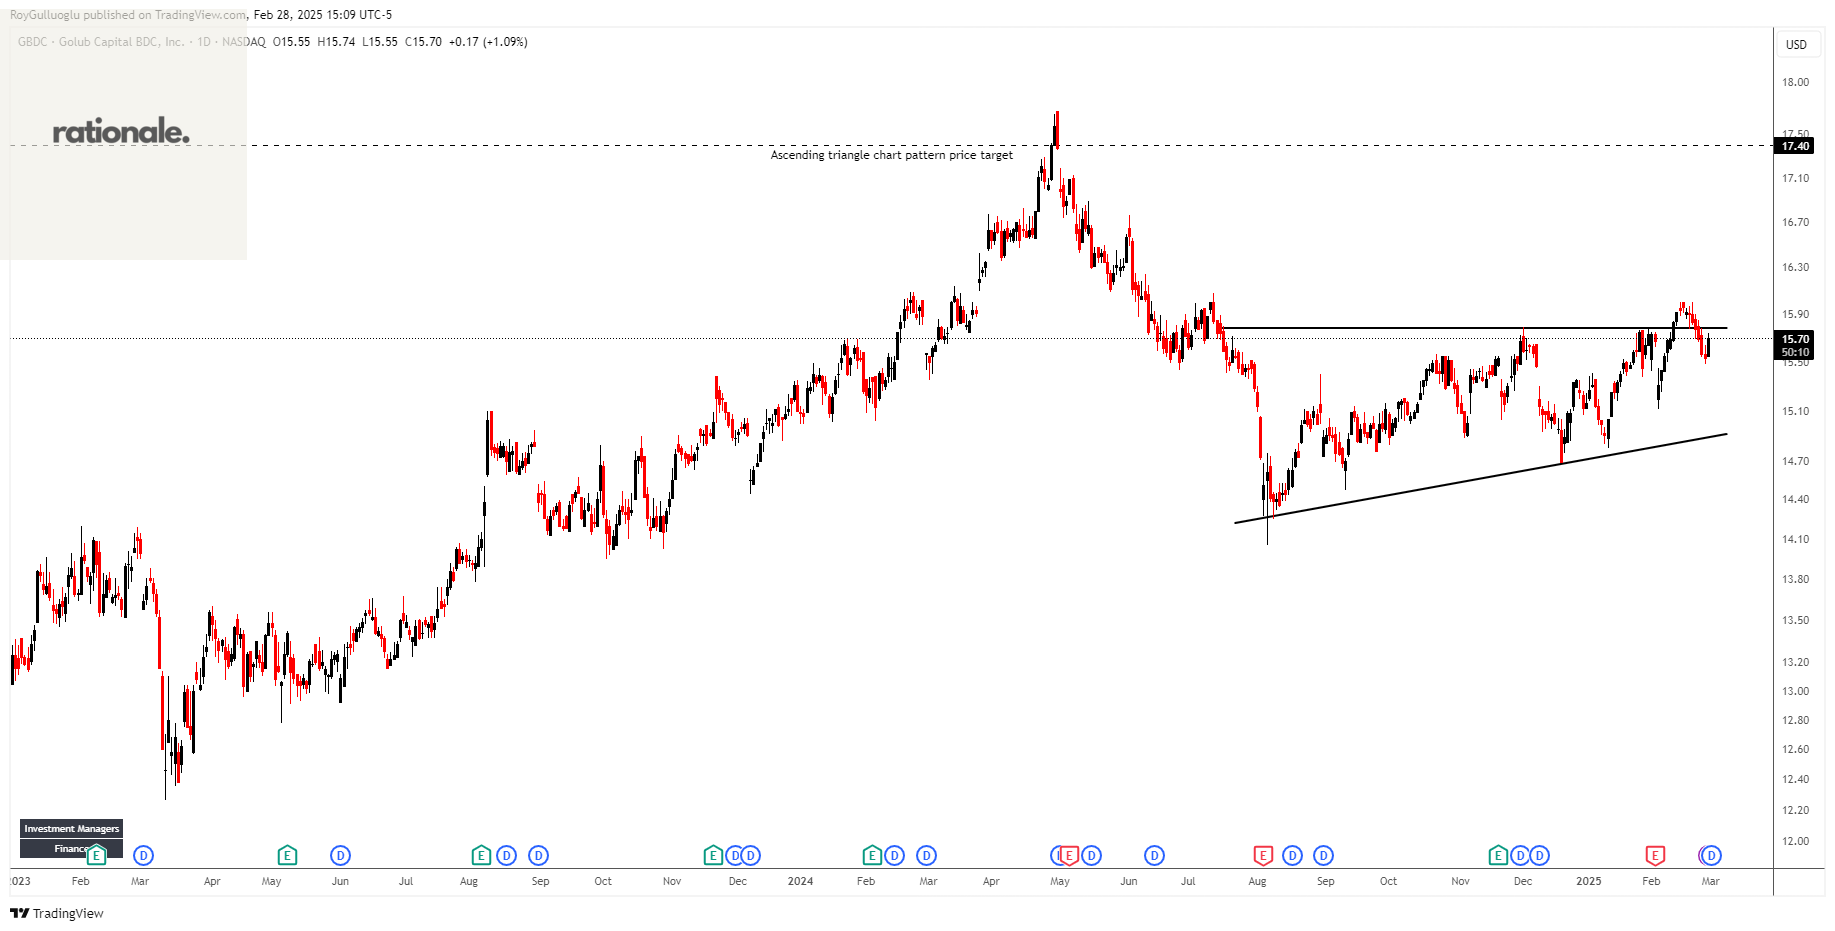
Golub Capital BDC, Inc. (GBDC) is a business development company and operates as an externally managed closed-end non-diversified management investment company.
The above weekly chart formed an approximately 5-month-long ascending triangle chart pattern as a bullish reversal after a downtrend.
The horizontal boundary at 15.78 levels acts as a resistance within this pattern.
A daily close above 16.25 levels would validate the breakout from the 5-month-long ascending triangle chart pattern.
Based on this chart pattern, the potential price target is 17.4 levels.
GBDC, classified under the "financial services" sector, falls under the “Mid Cap - Income” stock category.
Akbank T.A.S.-(AKBNK/BIST)-Long Idea
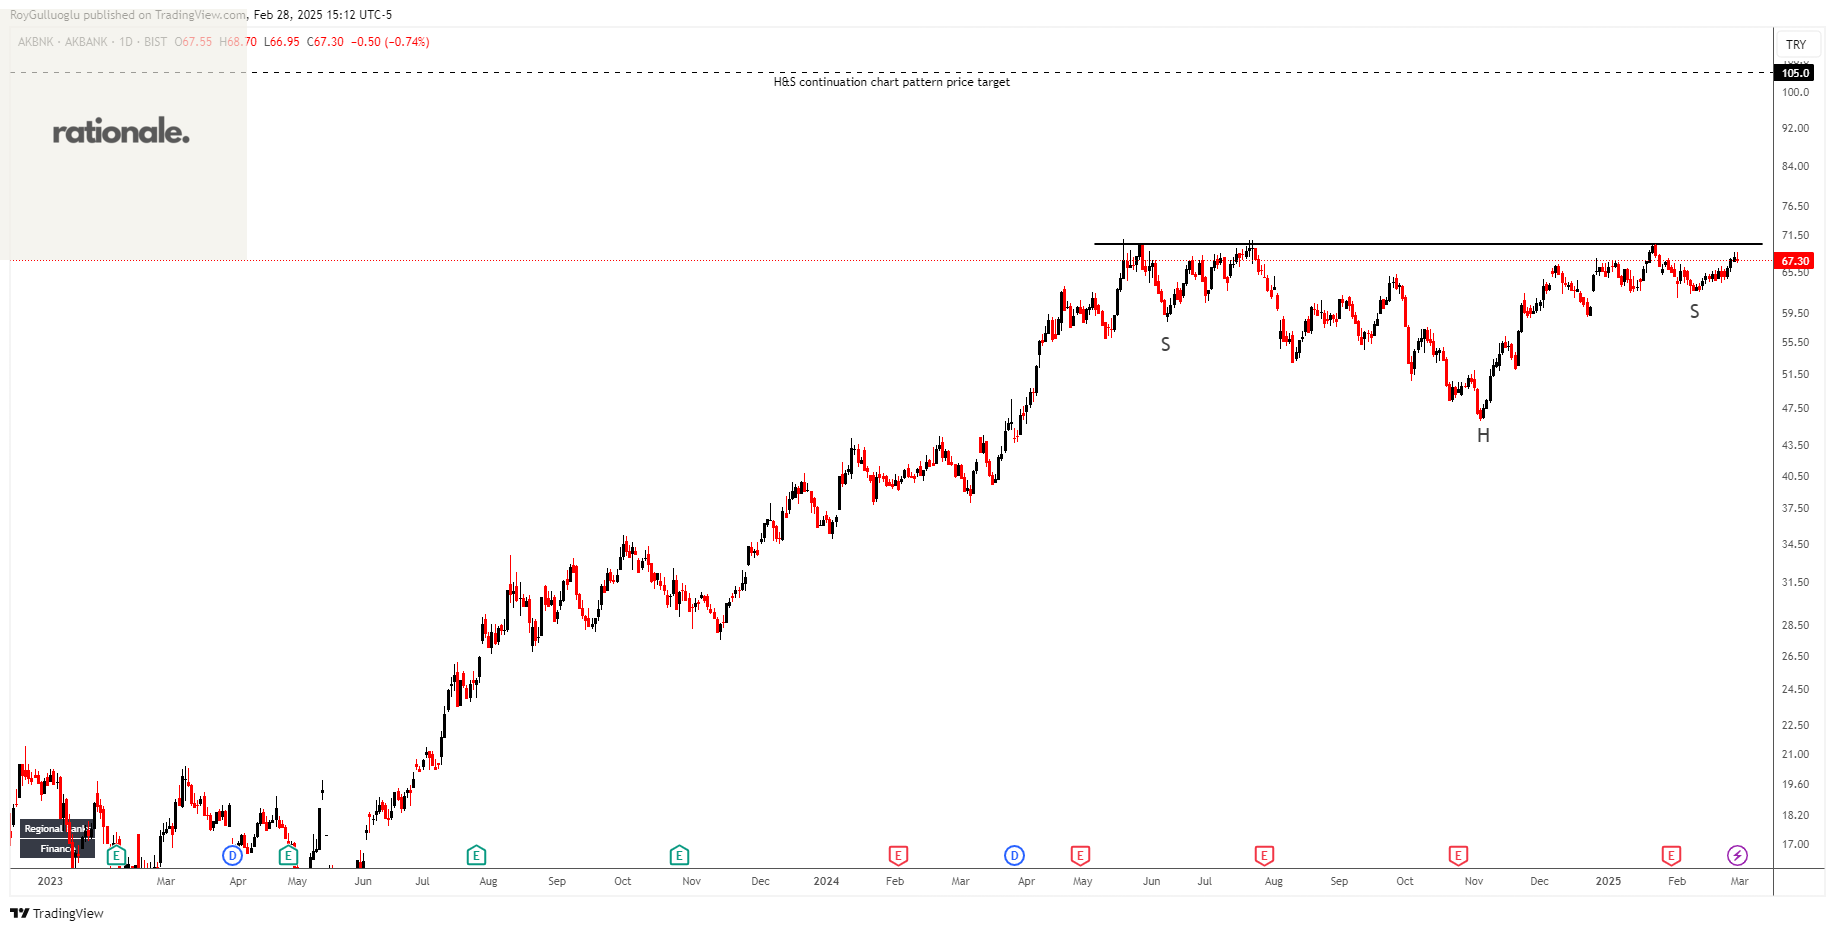
Akbank T.A.S., together with its subsidiaries, provides various banking products and services in Turkey and internationally.
The above daily chart formed an approximately 6-month-long H&S continuation chart pattern as a bullish continuation after an uptrend.
The horizontal boundary at 70 levels acts as a resistance within this pattern.
A daily close above 72.1 levels would validate the breakout from the 6-month-long H&S continuation chart pattern.
Based on this chart pattern, the potential price target is 105 levels.
AKBNK, classified under the "financial services" sector, falls under the “Mid Cap - Income” stock category.
Mazagon Dock Shipbuilders Limited-(MAZDOCK/NSE)-Short Idea
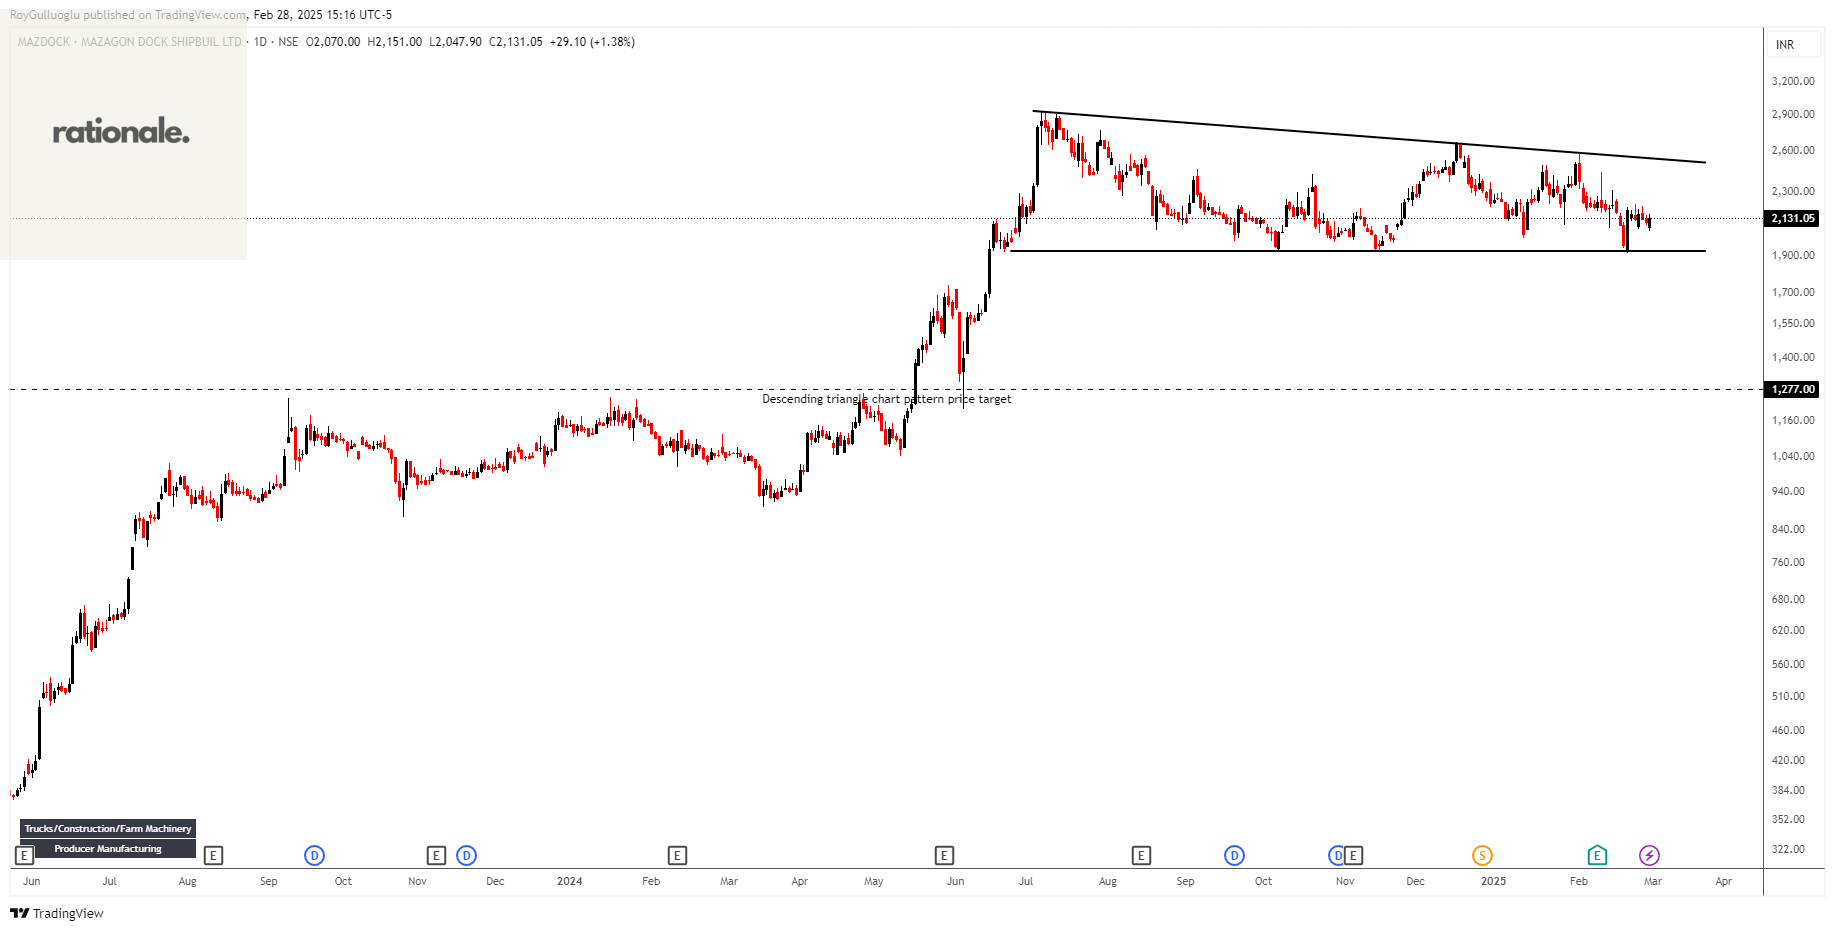
Mazagon Dock Shipbuilders Limited engages in building and repairing of ships, submarines, vessels, and related engineering products in India and internationally.
The above daily chart formed an approximately 5-month-long descending triangle chart pattern as a bearish reversal after an uptrend.
The horizontal boundary at 1925.9 levels acts as a support within this pattern.
A daily close below 1870 levels would validate the breakdown from the 5-month-long descending triangle chart pattern.
Based on this chart pattern, the potential price target is 1277 levels.
MAZDOCK, classified under the "industrials" sector, falls under the “Mid Cap - Value” stock category.
Caplin Point Laboratories Limited-(CAPLIPOINT/NSE)-Short Idea
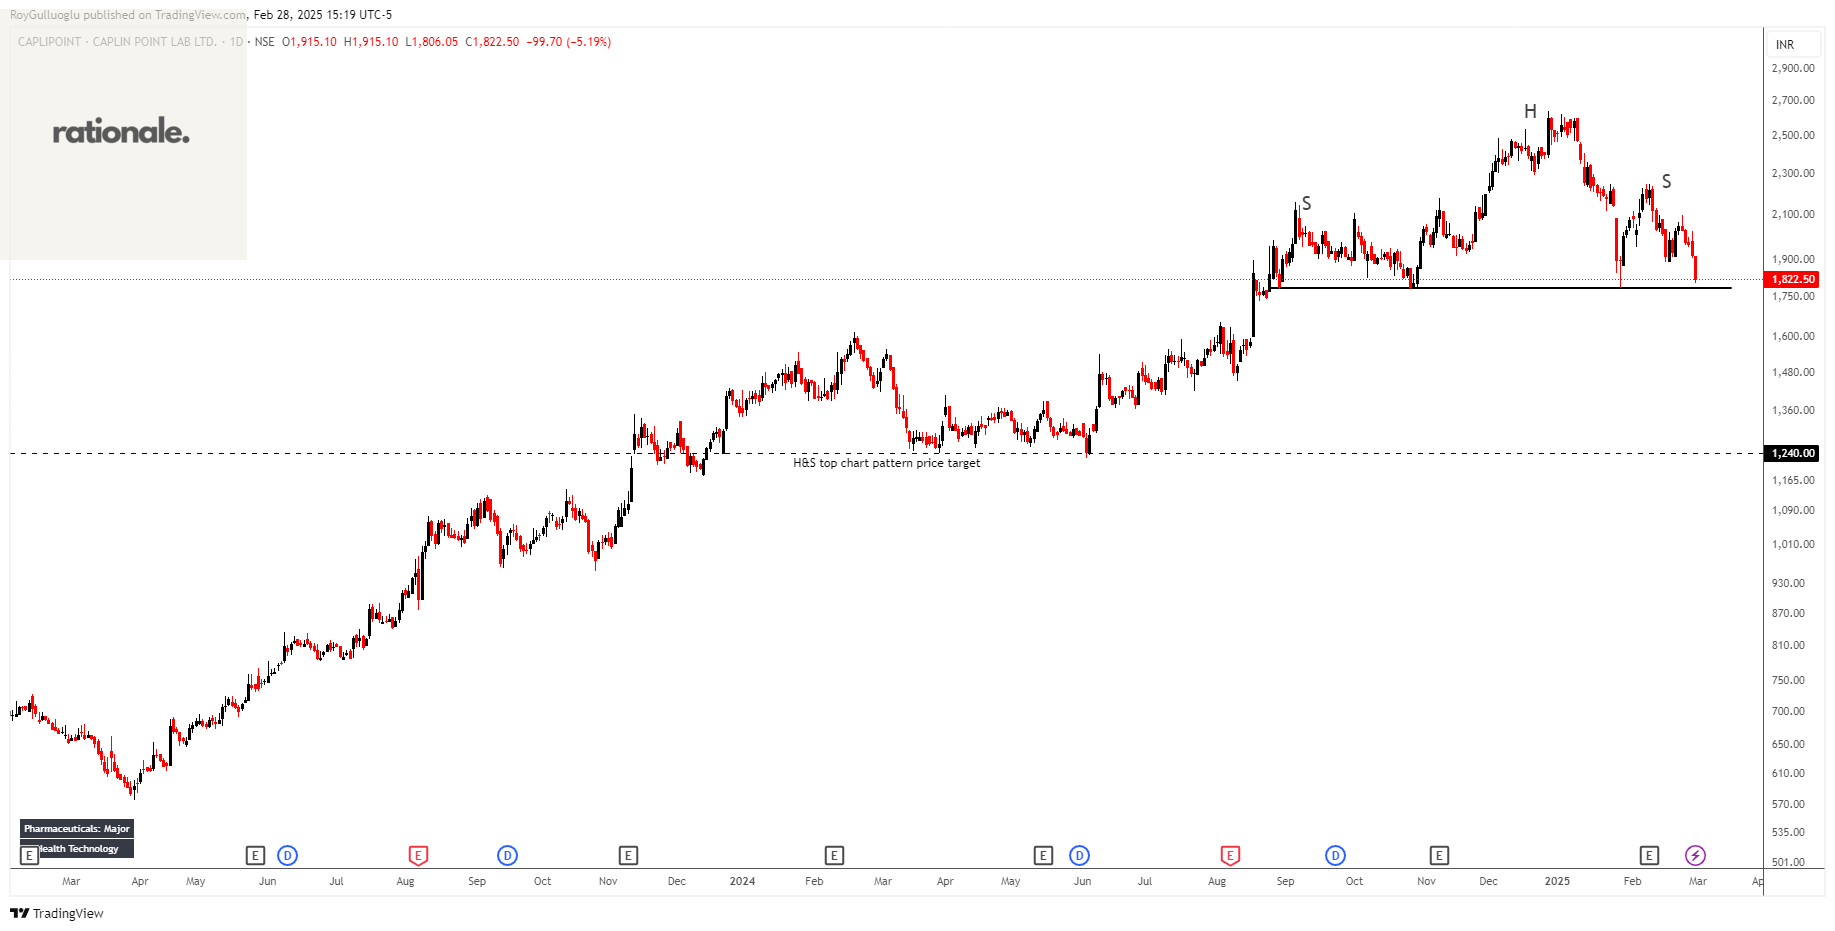
Caplin Point Laboratories Limited, together with its subsidiaries, engages in the development, production, marketing, and export of generic pharmaceutical formulations and branded products in India.
The above daily chart formed an approximately 4-month-long H&S top chart pattern as a bearish reversal after an uptrend.
The horizontal boundary at 1785.2 levels acts as a support within this pattern.
A daily close below 1732 levels would validate the breakdown from the 4-month-long H&S top chart pattern.
Based on this chart pattern, the potential price target is 1204 levels.
CAPLIPOINT, classified under the "healthcare" sector, falls under the “Small Cap - Value” stock category.
Prudential Financial, Inc.-(PRU/LSE)-Long Idea
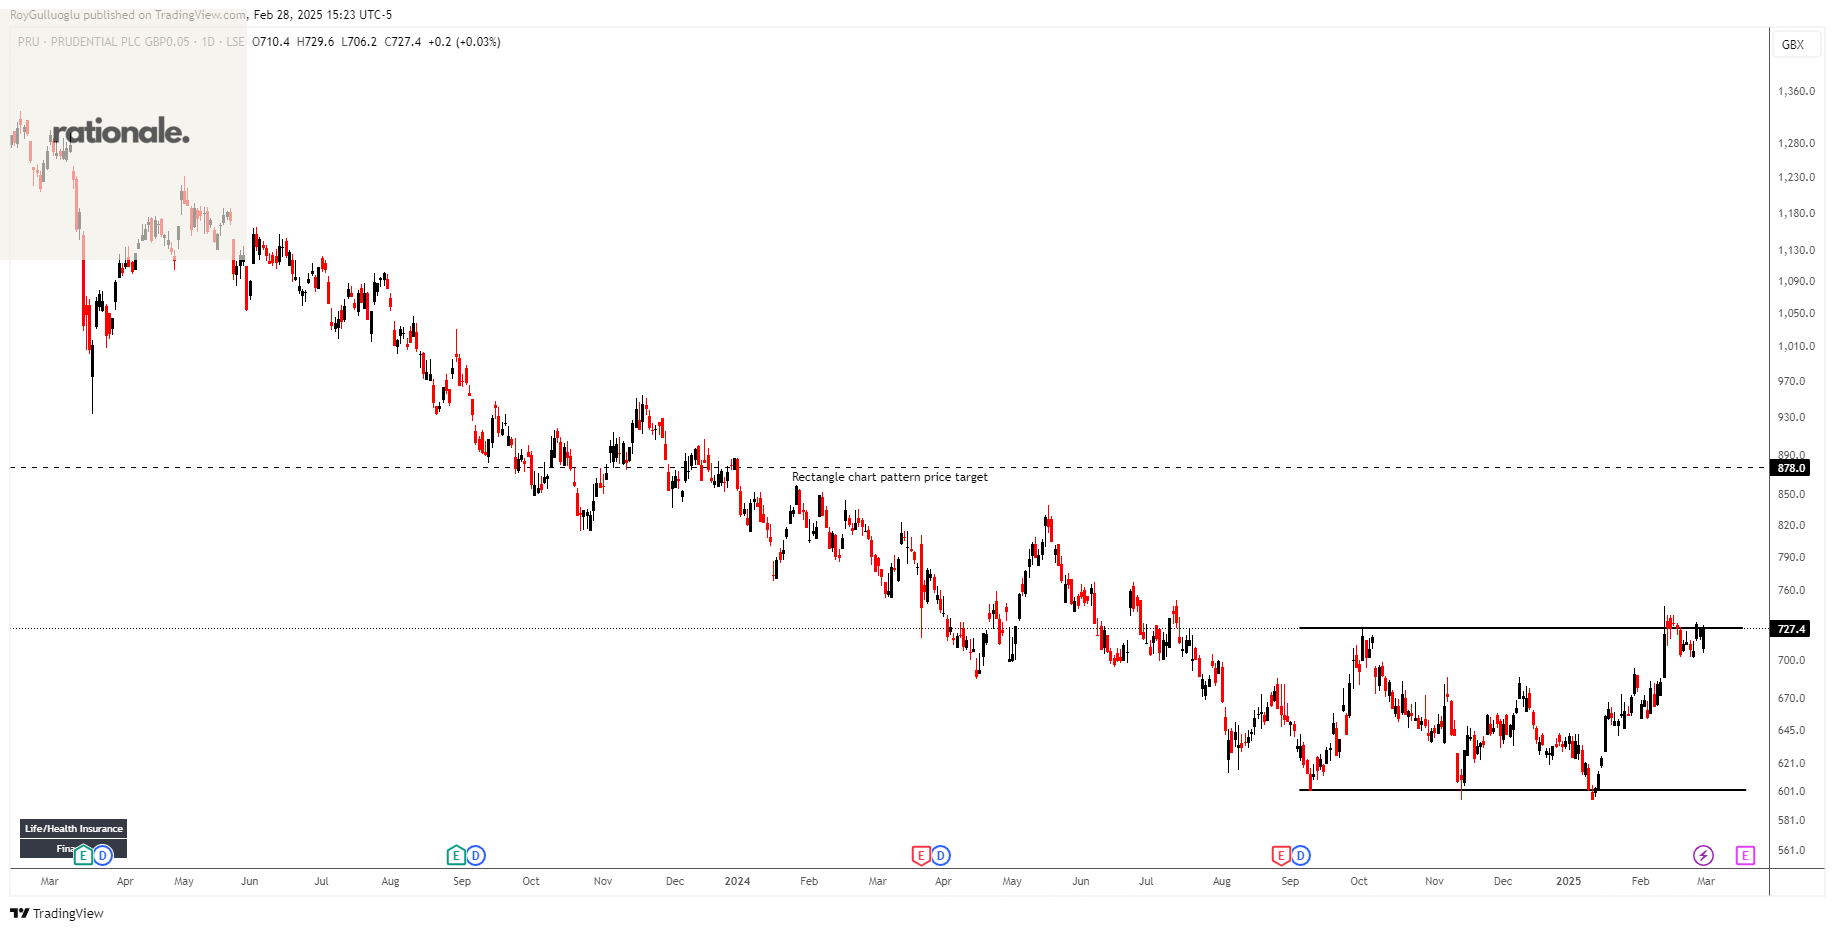
Prudential Financial, Inc., together with its subsidiaries, provides insurance, investment management, and other financial products and services in the United States, Japan and internationally.
The above daily chart formed an approximately 4-month-long rectangle chart pattern as a bullish reversal after a downtrend.
The horizontal boundary at 727.2 levels acts as a resistance within this pattern.
A daily close above 749 levels would validate the breakout from the 6-month-long cup & handle chart pattern.
Based on this chart pattern, the potential price target is 878 levels.
PRU, classified under the "technology" sector, falls under the “Large Cap - Growth” stock category.