

Trade Ideas Equities
UNP(NYSE), R(NYSE), HG(NYSE), SAN(EURONEXT), GODREJA(NSE), BDGI(TSX)

Union Pacific Corporation-(UNP/NYSE)-Long Idea
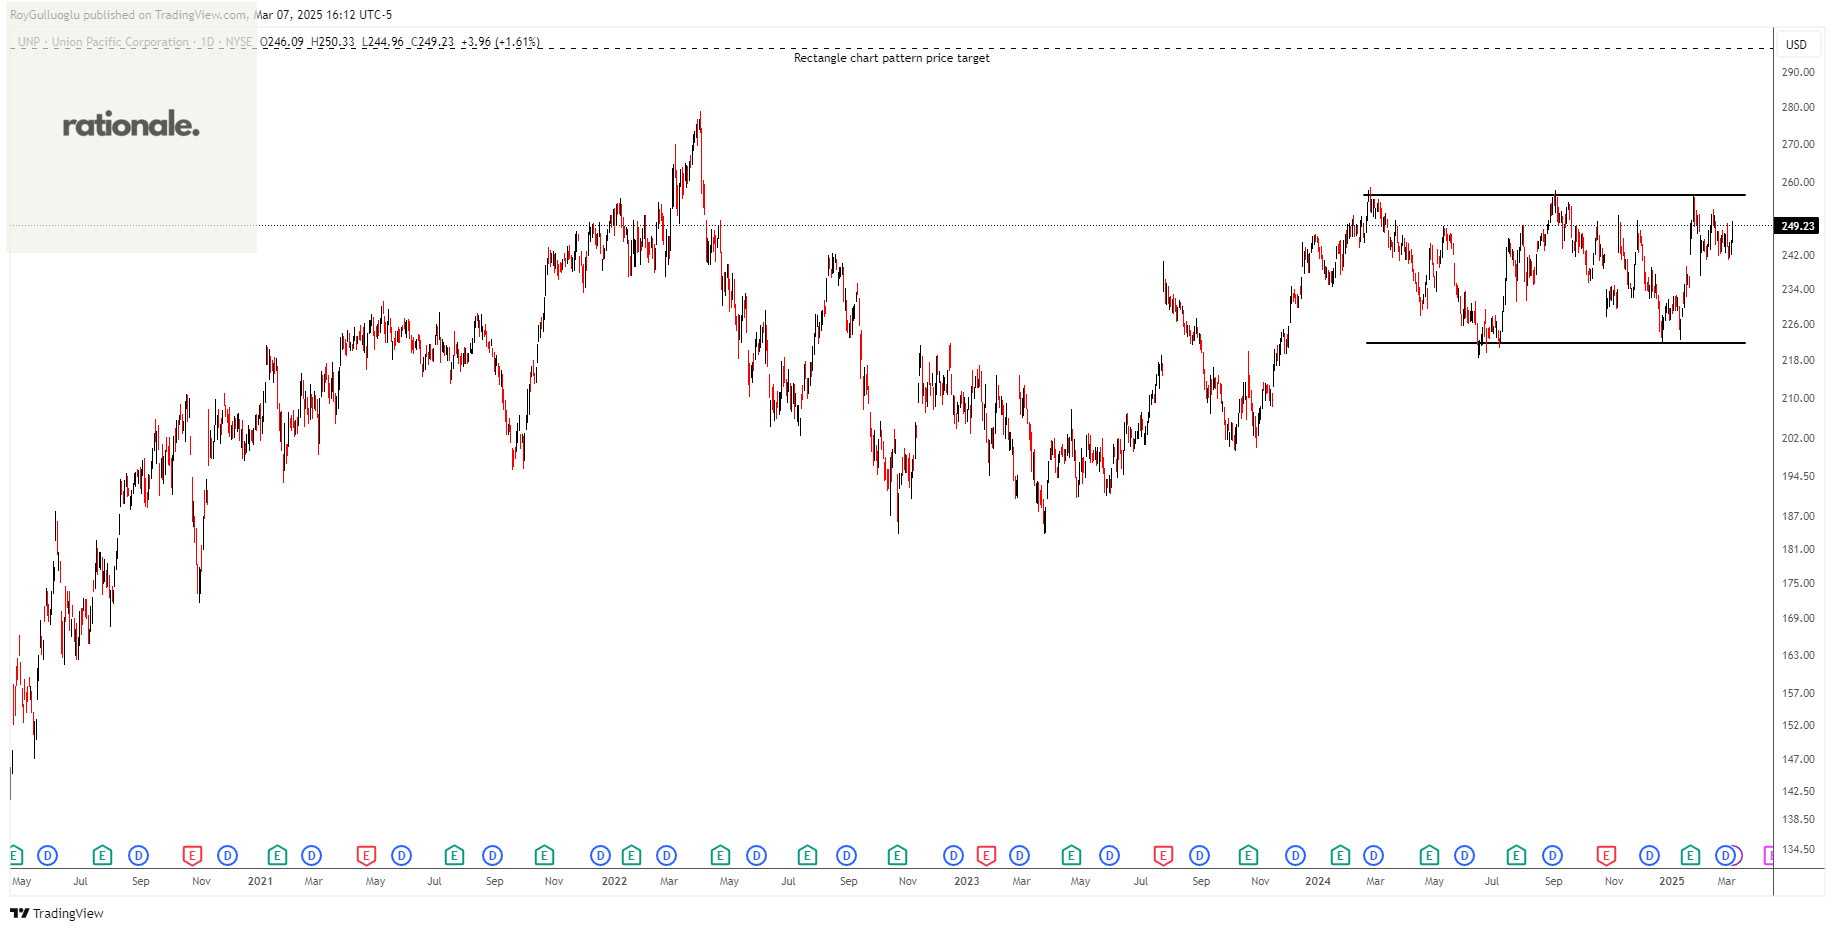
Union Pacific Corporation, through its subsidiary, Union Pacific Railroad Company, operates in the railroad business in the United States.
The above daily chart formed an approximately 8-month-long rectangle chart pattern as a bullish continuation after an uptrend.
The horizontal boundary at 256.85 levels acted as a resistance within this pattern.
A daily close above 264.5 levels would validate the breakout from the 8-month-long rectangle chart pattern.
Based on this chart pattern, the potential price target is 297 levels.
UNP, classified under the "industrials" sector, falls under the “Large Cap - Value” stock category.
Ryder System, Inc.-(R/NYSE)-Short Idea
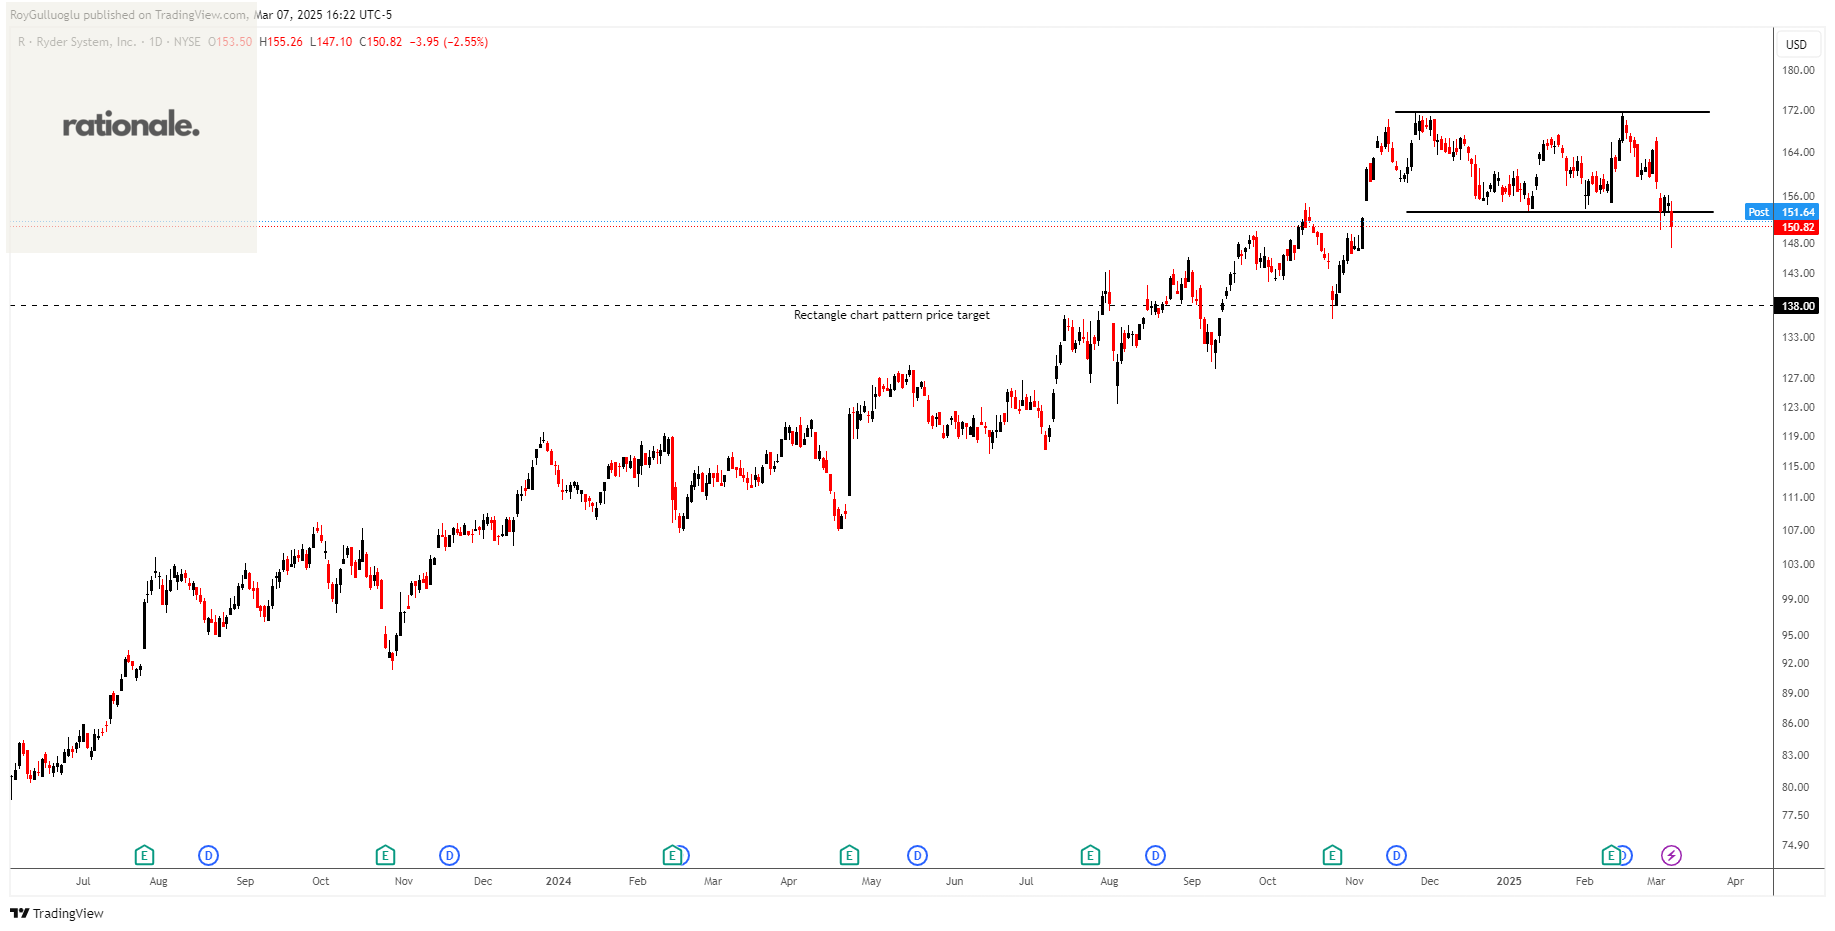
Ryder System, Inc. operates as a logistics and transportation company worldwide. It operates through three segments: Fleet Management Solutions (FMS), Supply Chain Solutions (SCS), and Dedicated Transportation Solutions (DTS).
The above daily chart formed an approximately 2-month-long rectangle chart pattern as a bearish reversal after an uptrend.
The horizontal boundary at 153.33 levels acts as a support within this pattern.
A daily close below 148.73 levels would validate the breakdown from the 2-month-long rectangle chart pattern.
Based on this chart pattern, the potential price target is 138 levels.
R, classified under the "industrials" sector, falls under the “Mid Cap - Value” stock category.
Hamilton Insurance Group, Ltd.-(HG/NYSE)-Long Idea
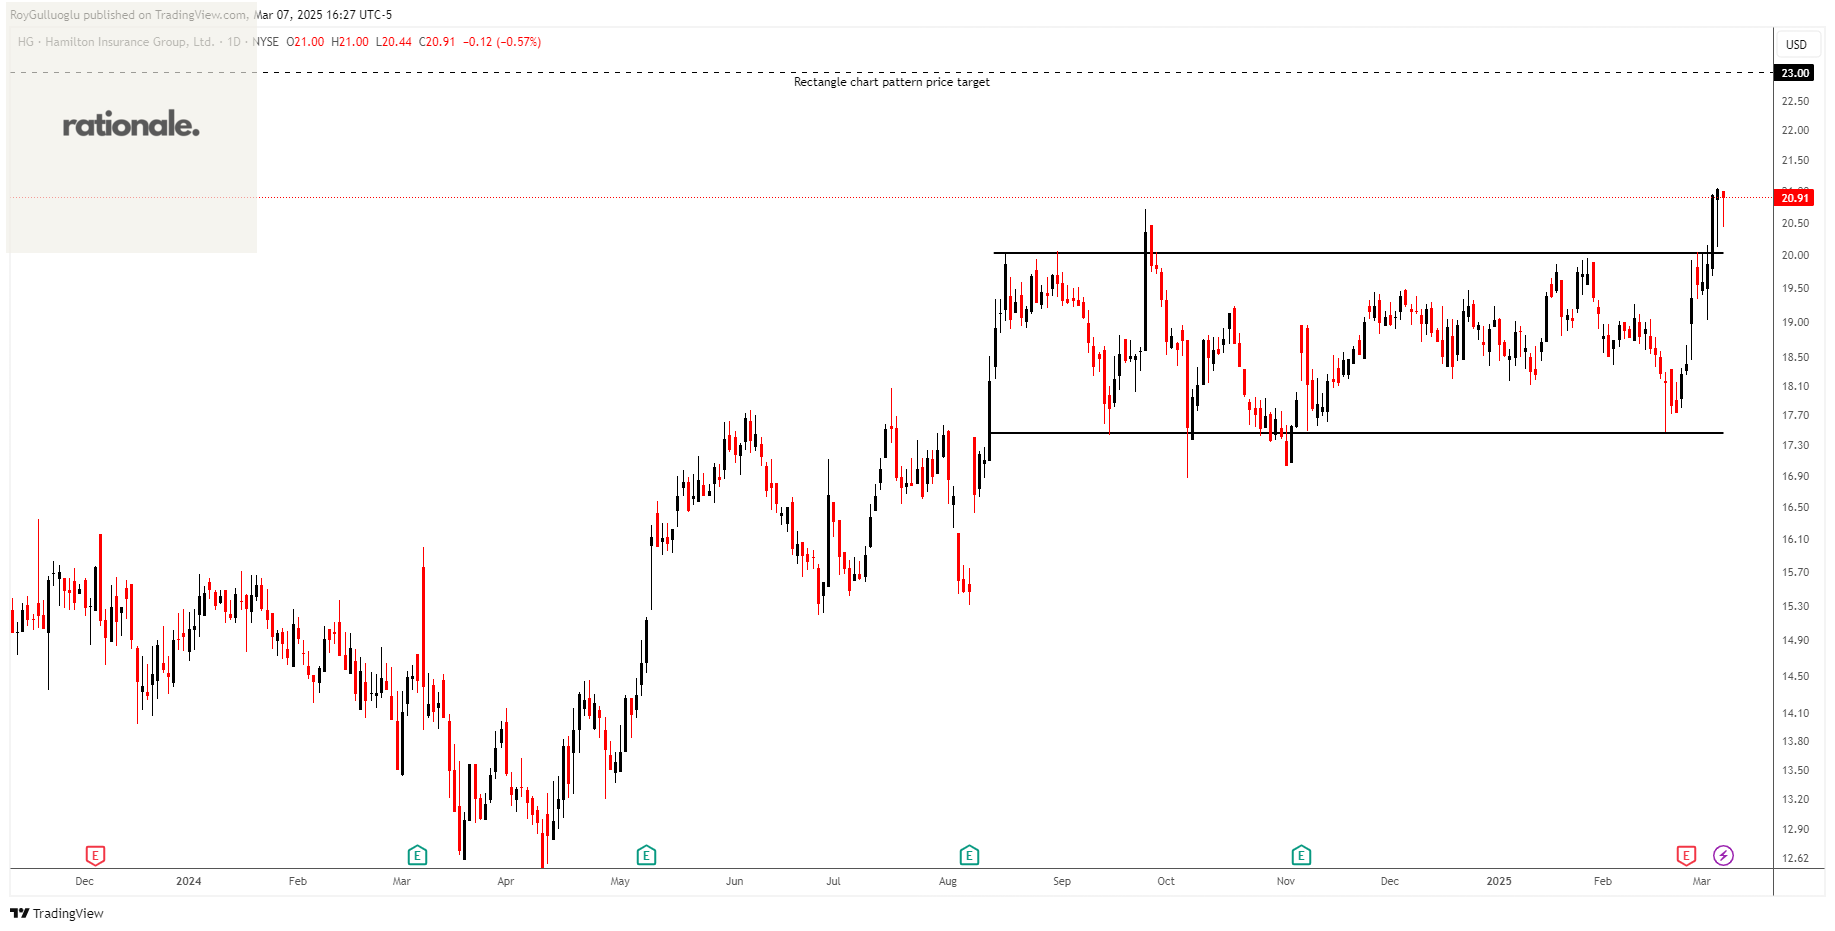
Hamilton Insurance Group, Ltd., through its subsidiaries, operates as specialty insurance and reinsurance company in Bermuda and internationally.
The above daily chart formed an approximately 4-month-long rectangle chart pattern as a bullish continuation after an uptrend.
The horizontal boundary at 20.04 levels acted as a resistance within this pattern.
A daily close above 20.64 levels validated the breakout from the 4-month-long rectangle chart pattern.
Based on this chart pattern, the potential price target is 23 levels.
HG, classified under the "financial services" sector, falls under the “Mid Cap - Income” stock category.
Sanofi-(SAN/EURONEXT)-Long Idea
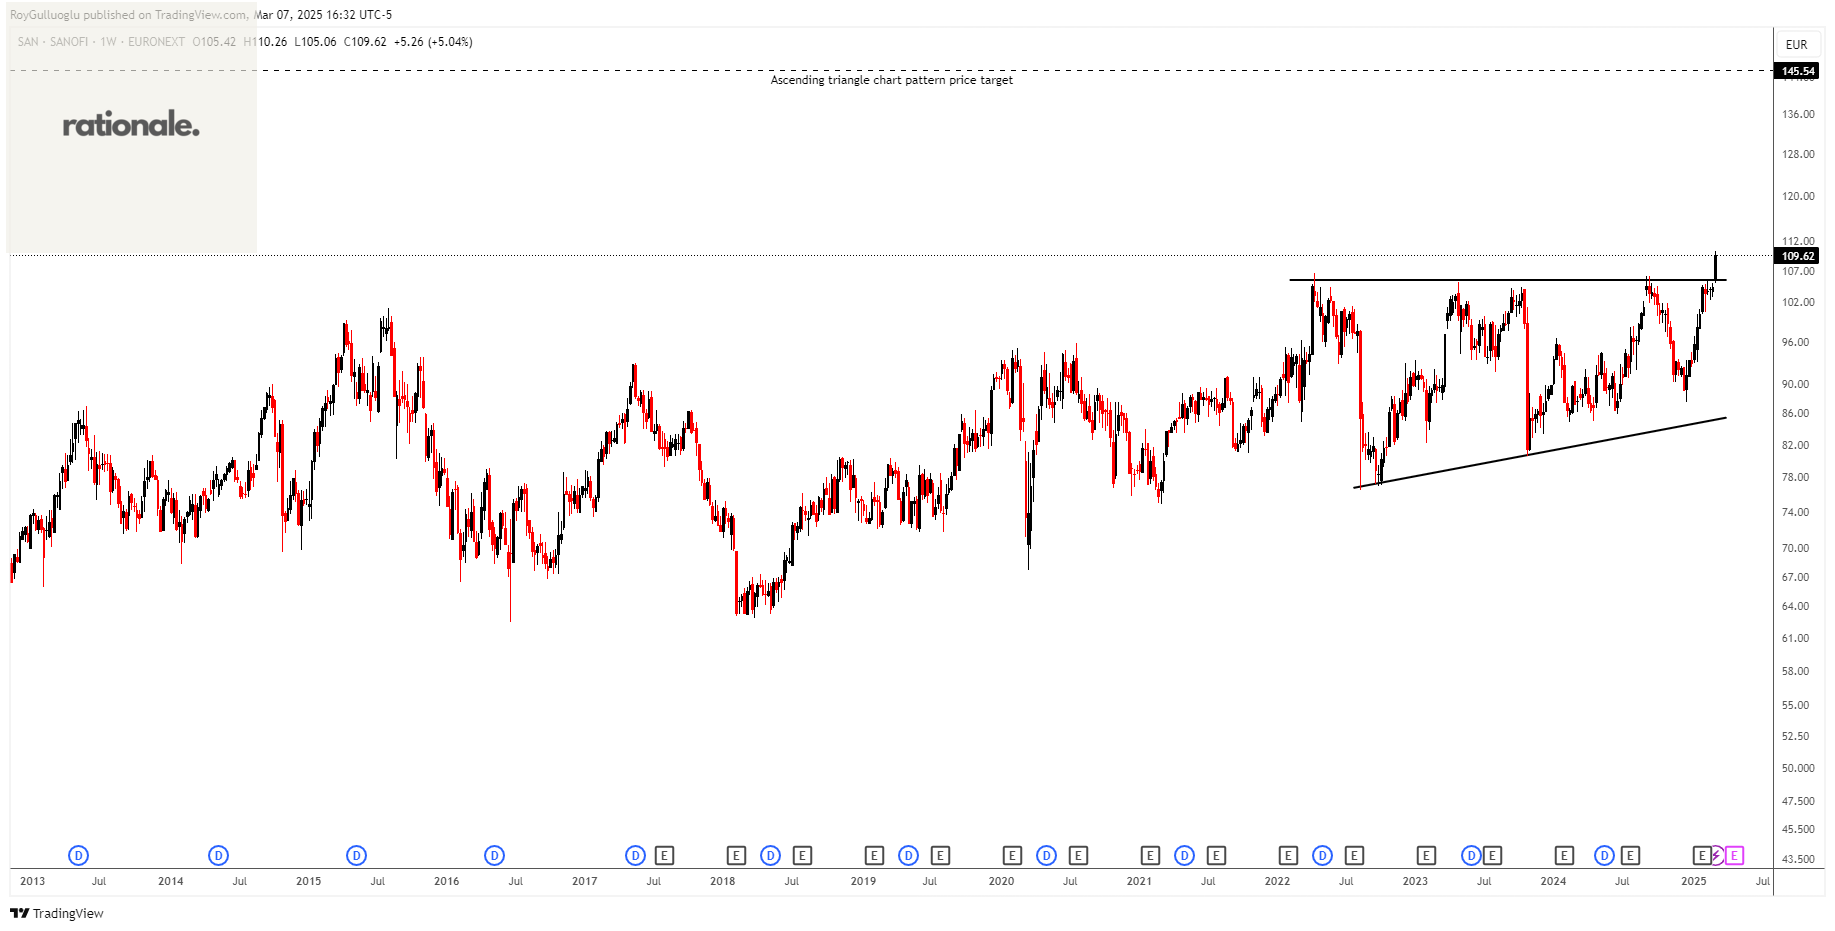
Sanofi, a healthcare company, engages in the research, development, manufacture, and marketing of therapeutic solutions in the United States, Europe, and internationally.
The above daily chart formed an approximately 38-month-long ascending triangle chart pattern as a bullish continuation after an uptrend.
The horizontal boundary at 105.54 levels acted as a resistance within this pattern.
A daily close above 108.7 levels validated the breakout from the 38-month-long ascending triangle chart pattern.
Based on this chart pattern, the potential price target is 145.54 levels.
SAN, classified under the "healthcare" sector, falls under the “Large Cap - Value” stock category.
Godrej Agrovet Limited-(GODREJA/NSE)-Long Idea
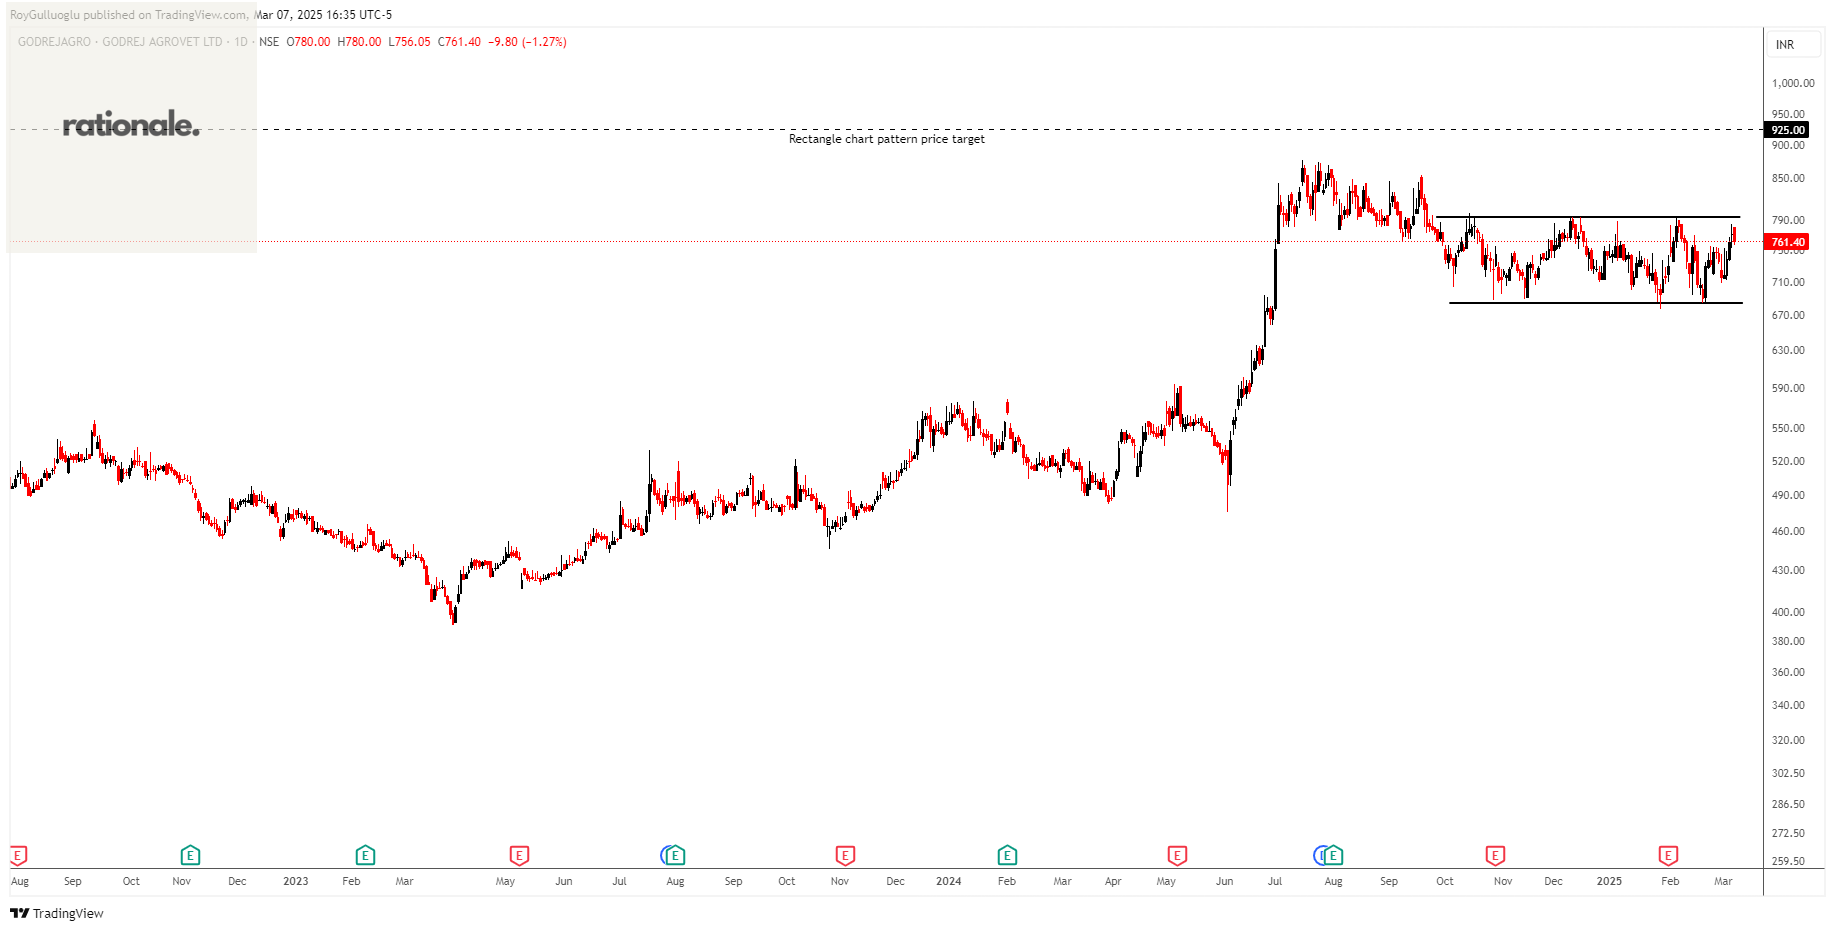
Godrej Agrovet Limited, an agri-business company, provides products and services that enhance crop and livestock yields in India and internationally.
The above daily chart formed an approximately 3-month-long rectangle chart pattern as a bullish reversal after a downtrend.
The horizontal boundary at 793.6 levels acted as a resistance within this pattern.
A daily close above 817.4 levels would validate the breakout from the 3-month-long rectangle chart pattern.
Based on this chart pattern, the potential price target is 925 levels.
GODREJA, classified under the "consumer defensive" sector, falls under the “Small Cap - Value” stock category.
Badger Infrastructure Solutions Ltd.-(BDGI/TSX)-Long Idea
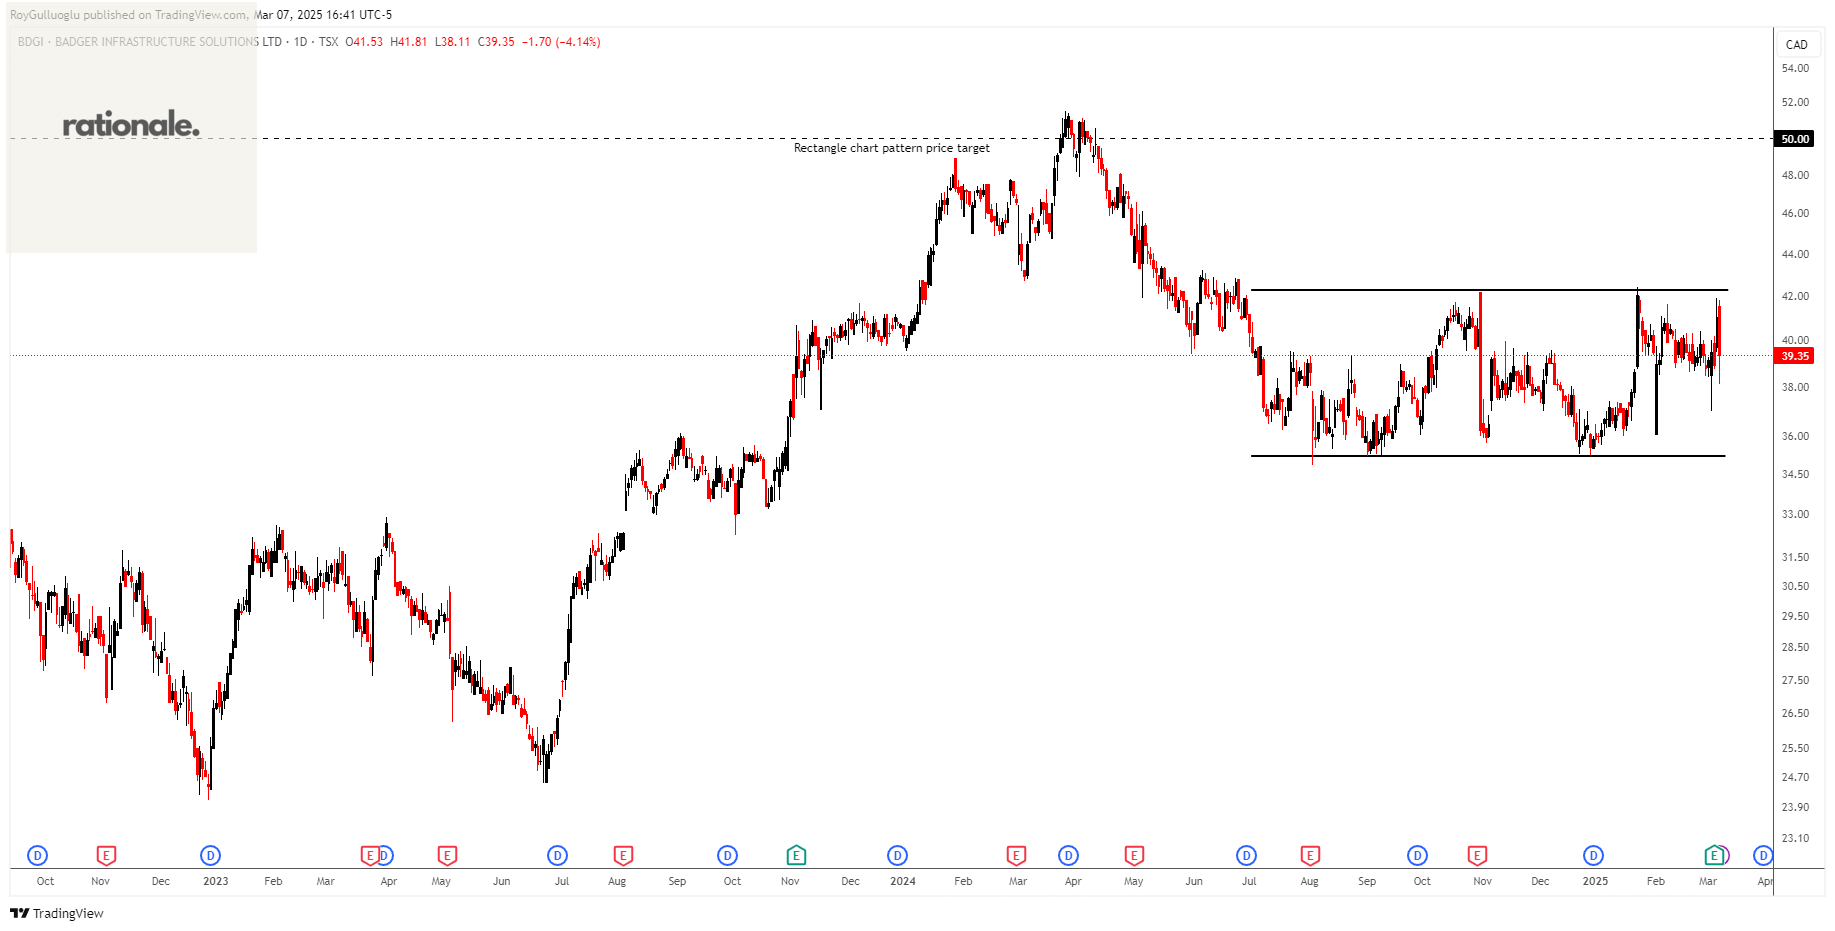
Badger Infrastructure Solutions Ltd. provides non-destructive excavating and related services in Canada and the United States.
The above daily chart formed an approximately 5-month-long rectangle chart pattern as a bullish reversal after a downtrend.
The horizontal boundary at 42.26 levels acts as a resistance within this pattern.
A daily close above 43.52 levels would validate the breakout from the 5-month-long rectangle chart pattern.
Based on this chart pattern, the potential price target is 50 levels.
BDGI, classified under the "industrials" sector, falls under the “Small Cap - Value” stock category.
Teşekkürler Roy