


EURAUD-Long Idea
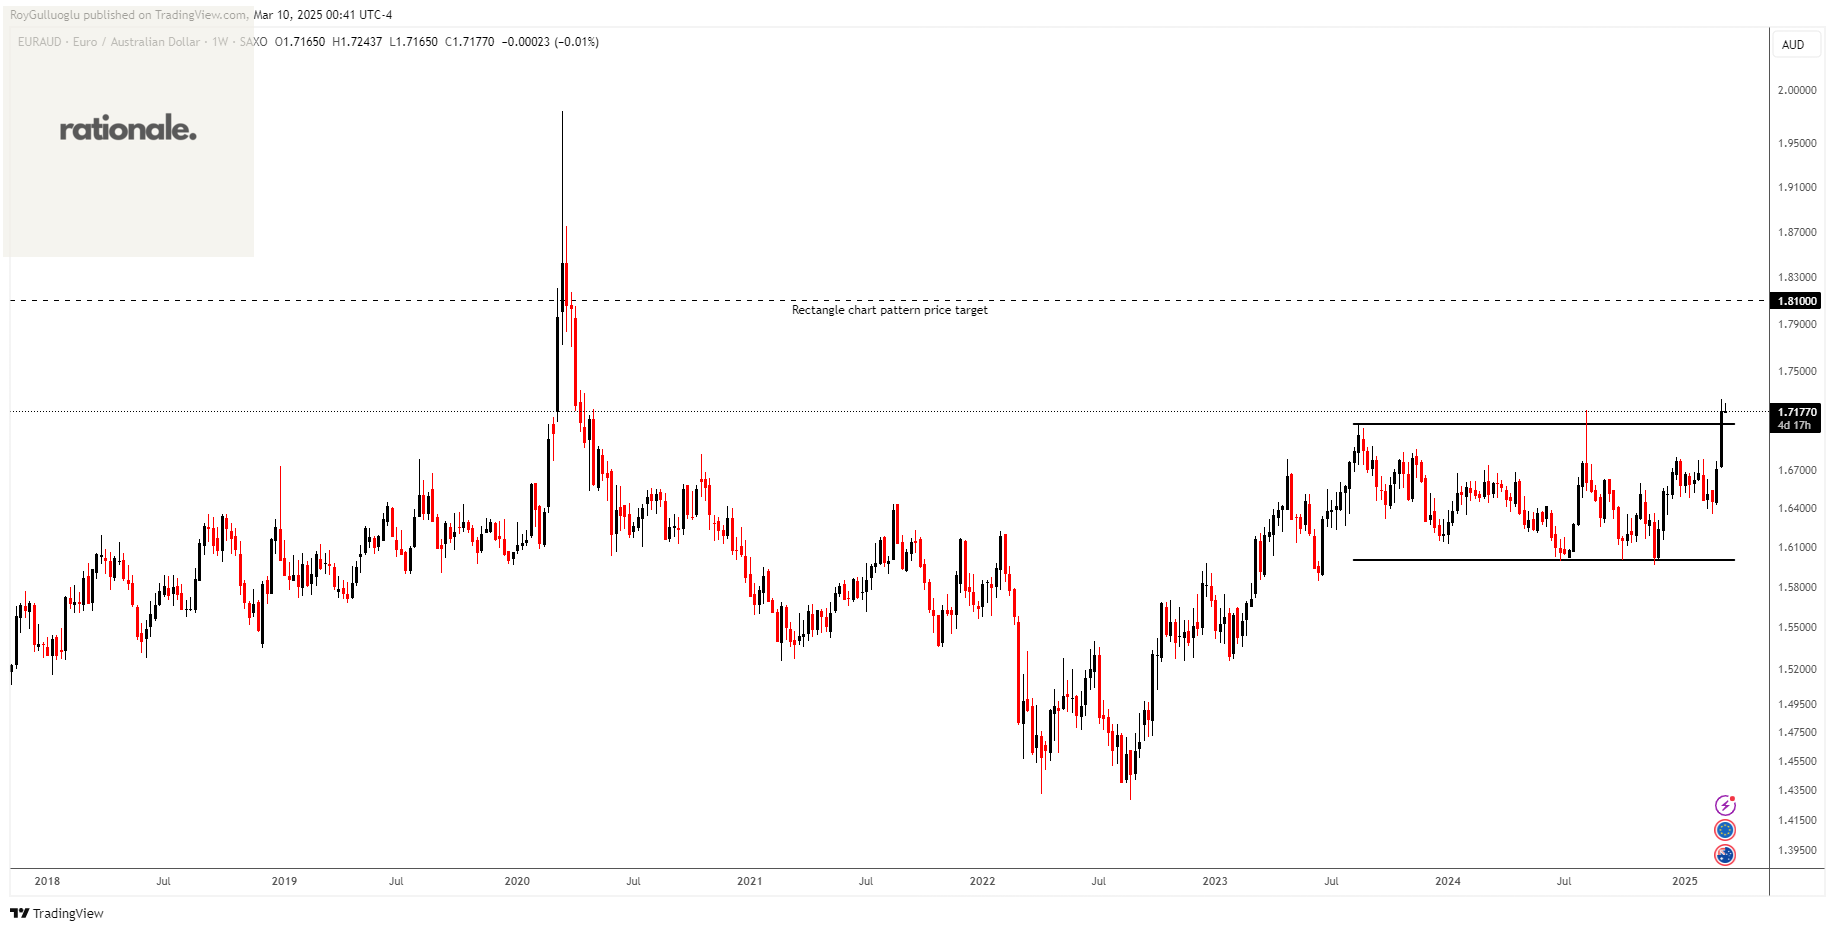
The above weekly chart formed an approximately 20-month-long rectangle chart pattern as a bullish continuation after an uptrend.
The horizontal boundary at 1.7066 levels acts as a resistance within this pattern.
A daily close above 1.7236 levels would validate the breakout from the 20-month-long rectangle chart pattern.
Based on this chart pattern, the potential price target is approximately 1.81 levels.
EURNOK-Long Idea
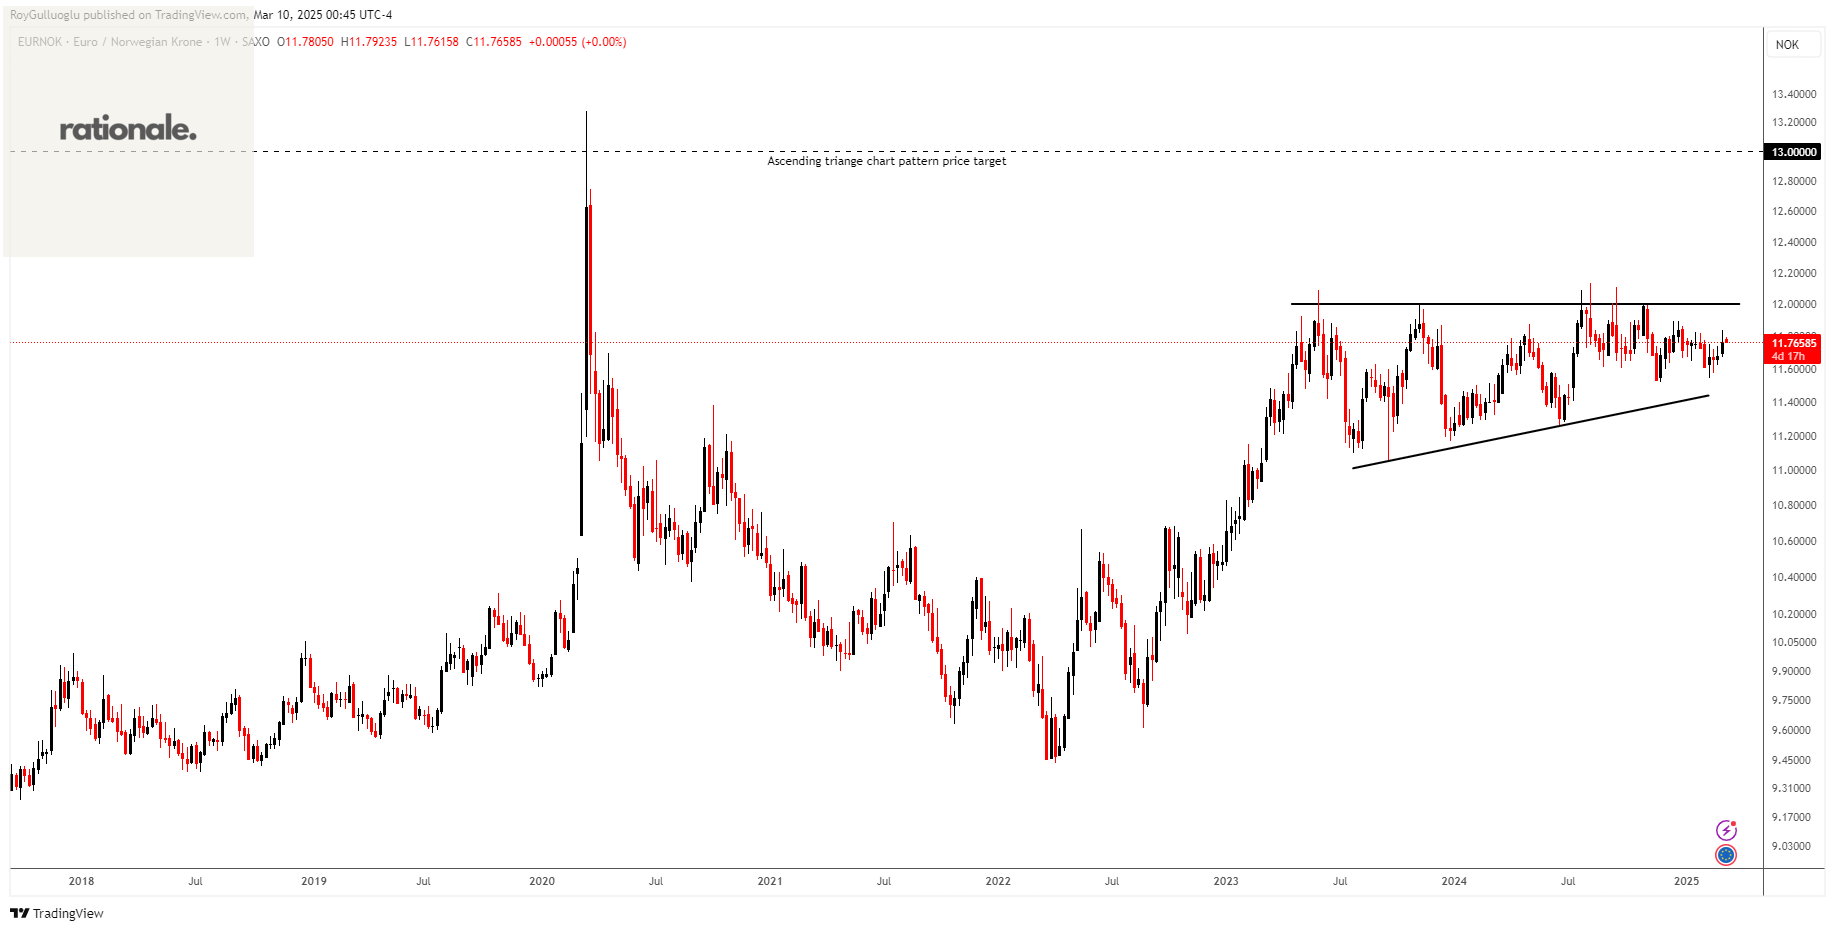
The above weekly chart formed an approximately 22-month-long ascending triangle chart pattern as a bullish continuation after an uptrend.
The horizontal boundary at 12 levels acts as a resistance within this pattern.
A daily close above 12.12 levels would validate the breakout from the 22-month-long ascending triangle chart pattern.
Based on this chart pattern, the potential price target is approximately 13 levels.
AUDCAD-Long Idea
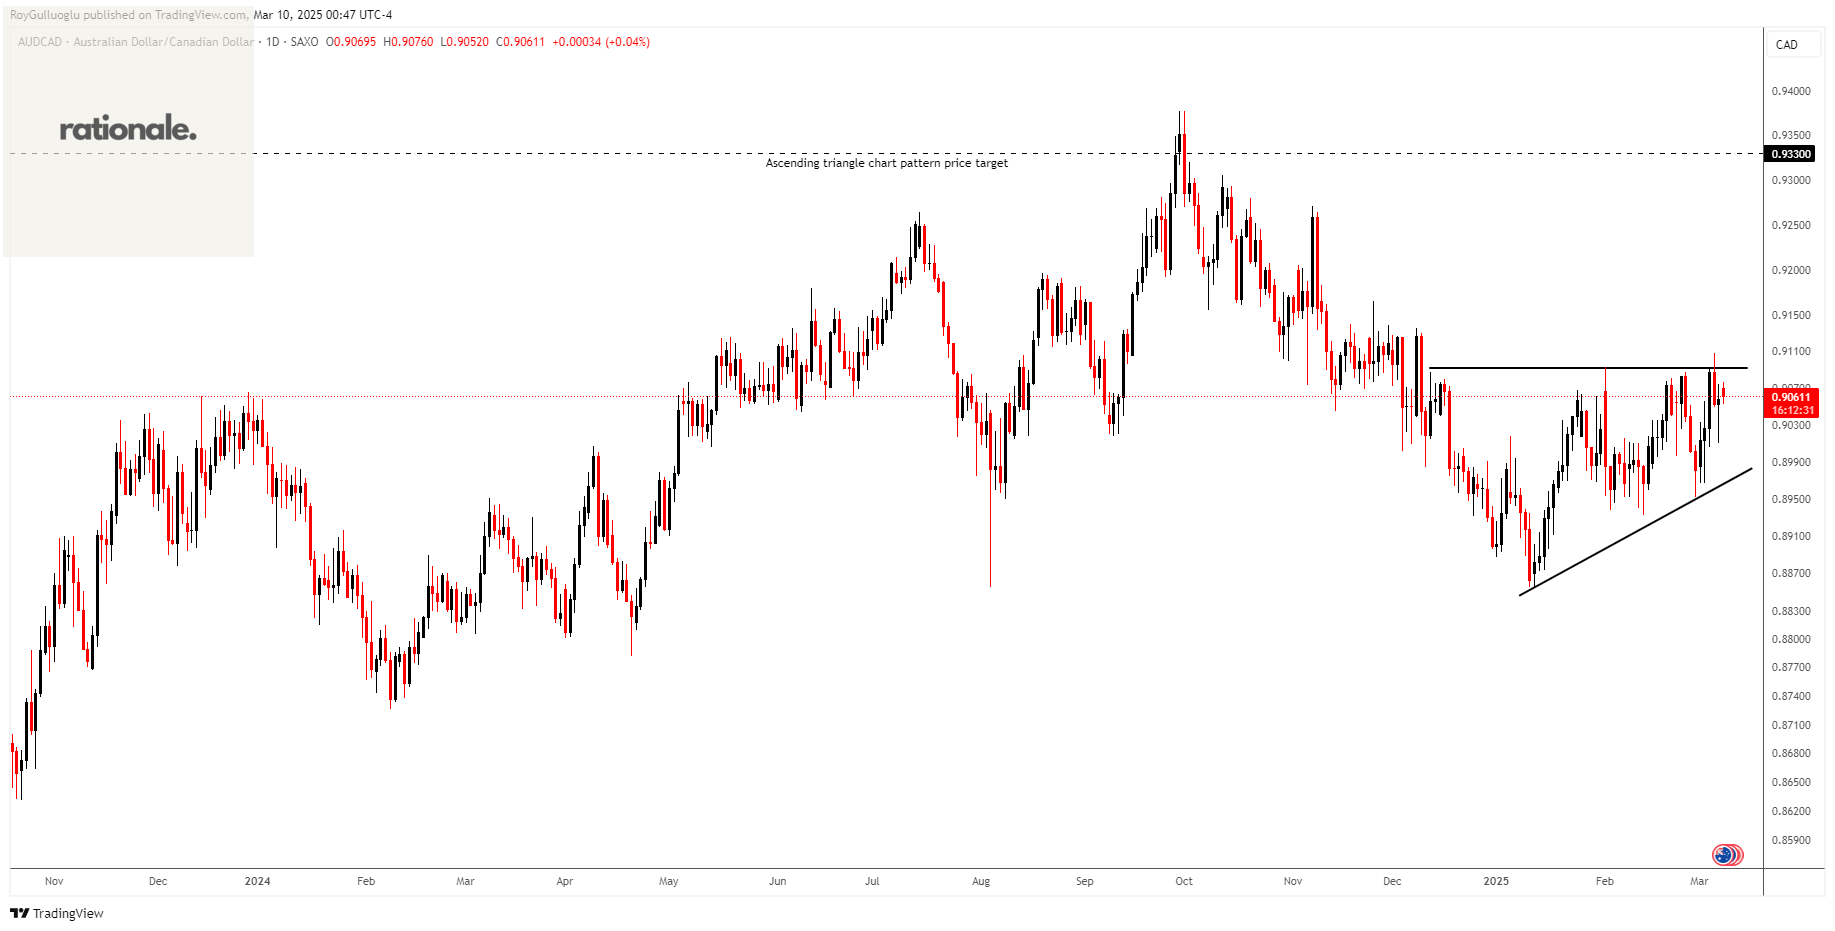
The above daily chart formed an approximately 2-month-long ascending triangle chart pattern as a bullish continuation after an uptrend.
The horizontal boundary at 0.90918 levels acts as a resistance within this pattern.
A daily close above 0.912(ATR(10/30)/2+boundary) levels would validate the breakout from the 2-month-long ascending triangle chart pattern.
Based on this chart pattern, the potential price target is approximately 0.9330 levels.
CELRUSDT-Short Idea
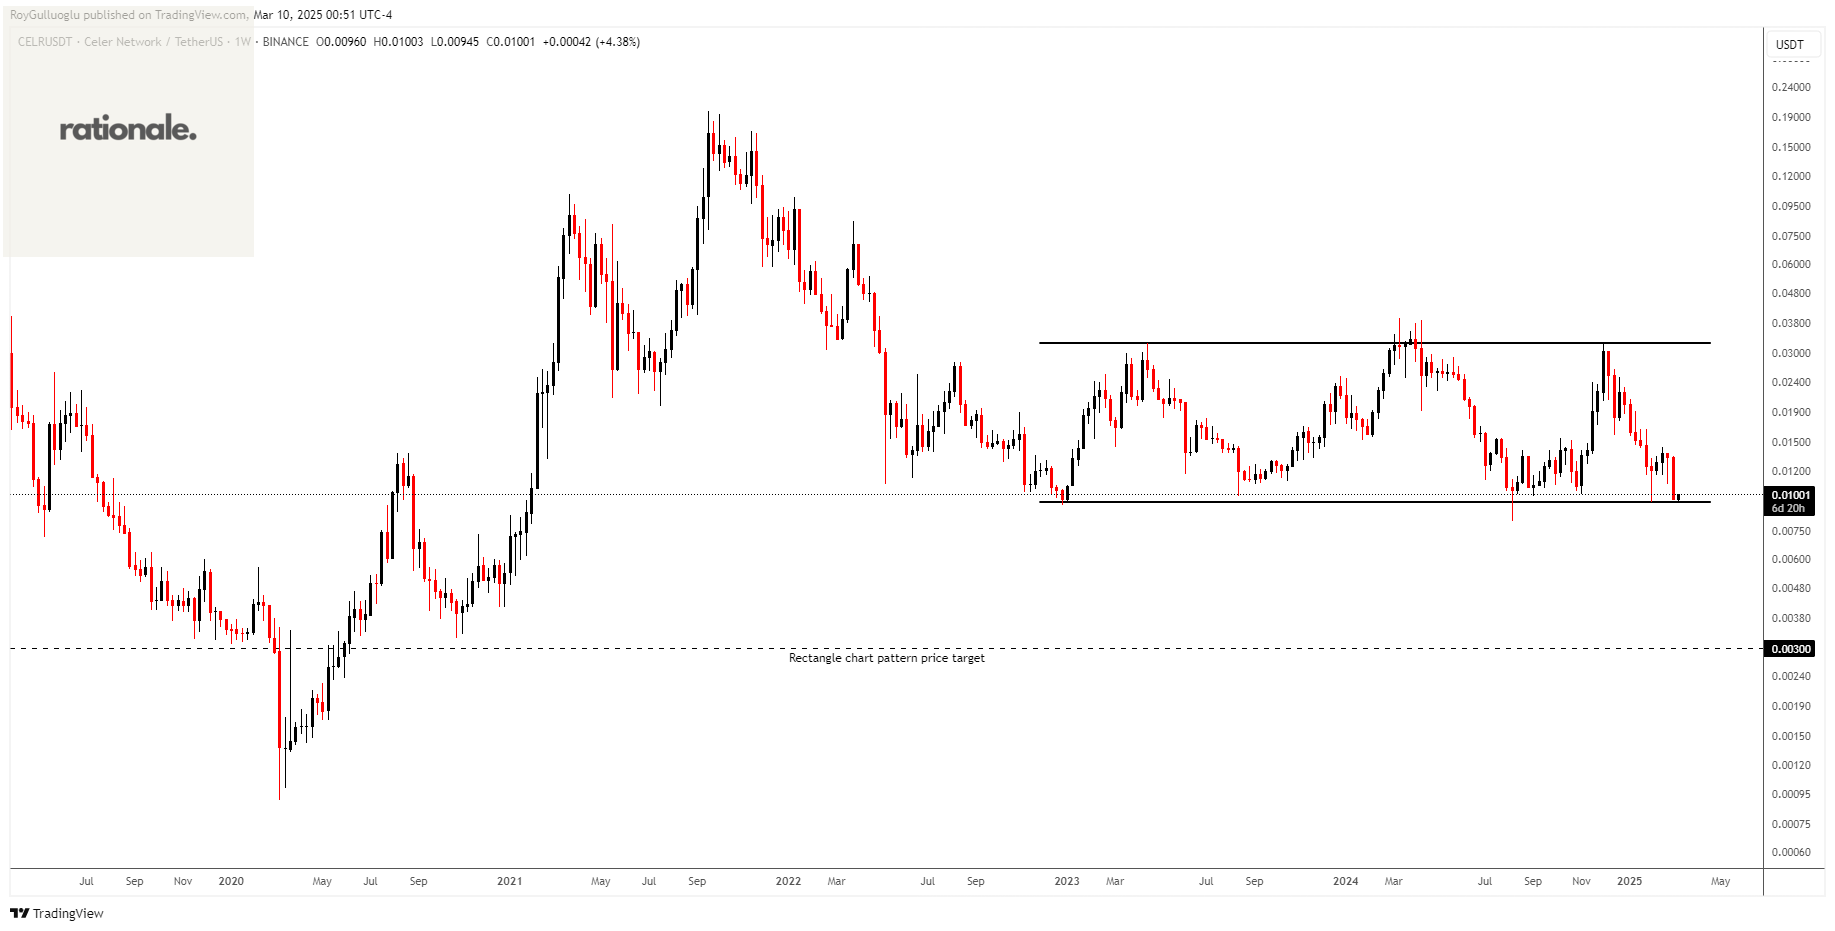
The above weekly chart formed an approximately 29-month-long rectangle chart pattern as a bearish continuation after a downtrend.
The horizontal boundary at 0.00937 levels acts as a support within this pattern.
A daily close below 0.00908 levels would validate the breakdown from the 29-month-long rectangle chart pattern.
Based on this chart pattern, the potential price target is approximately 0.003 levels.
Teşekkürler Roy