

Trade Ideas Equities
OKTA(NASDAQ), SUN(NYSE), GAP(NYSE), L(NYSE), MAERSK(OMXCOP), VWS(OMXCOP), 6586(TSE), 5830(TSE), 4114(TSE)

Okta, Inc.-(OKTA/NASDAQ)-Long Idea
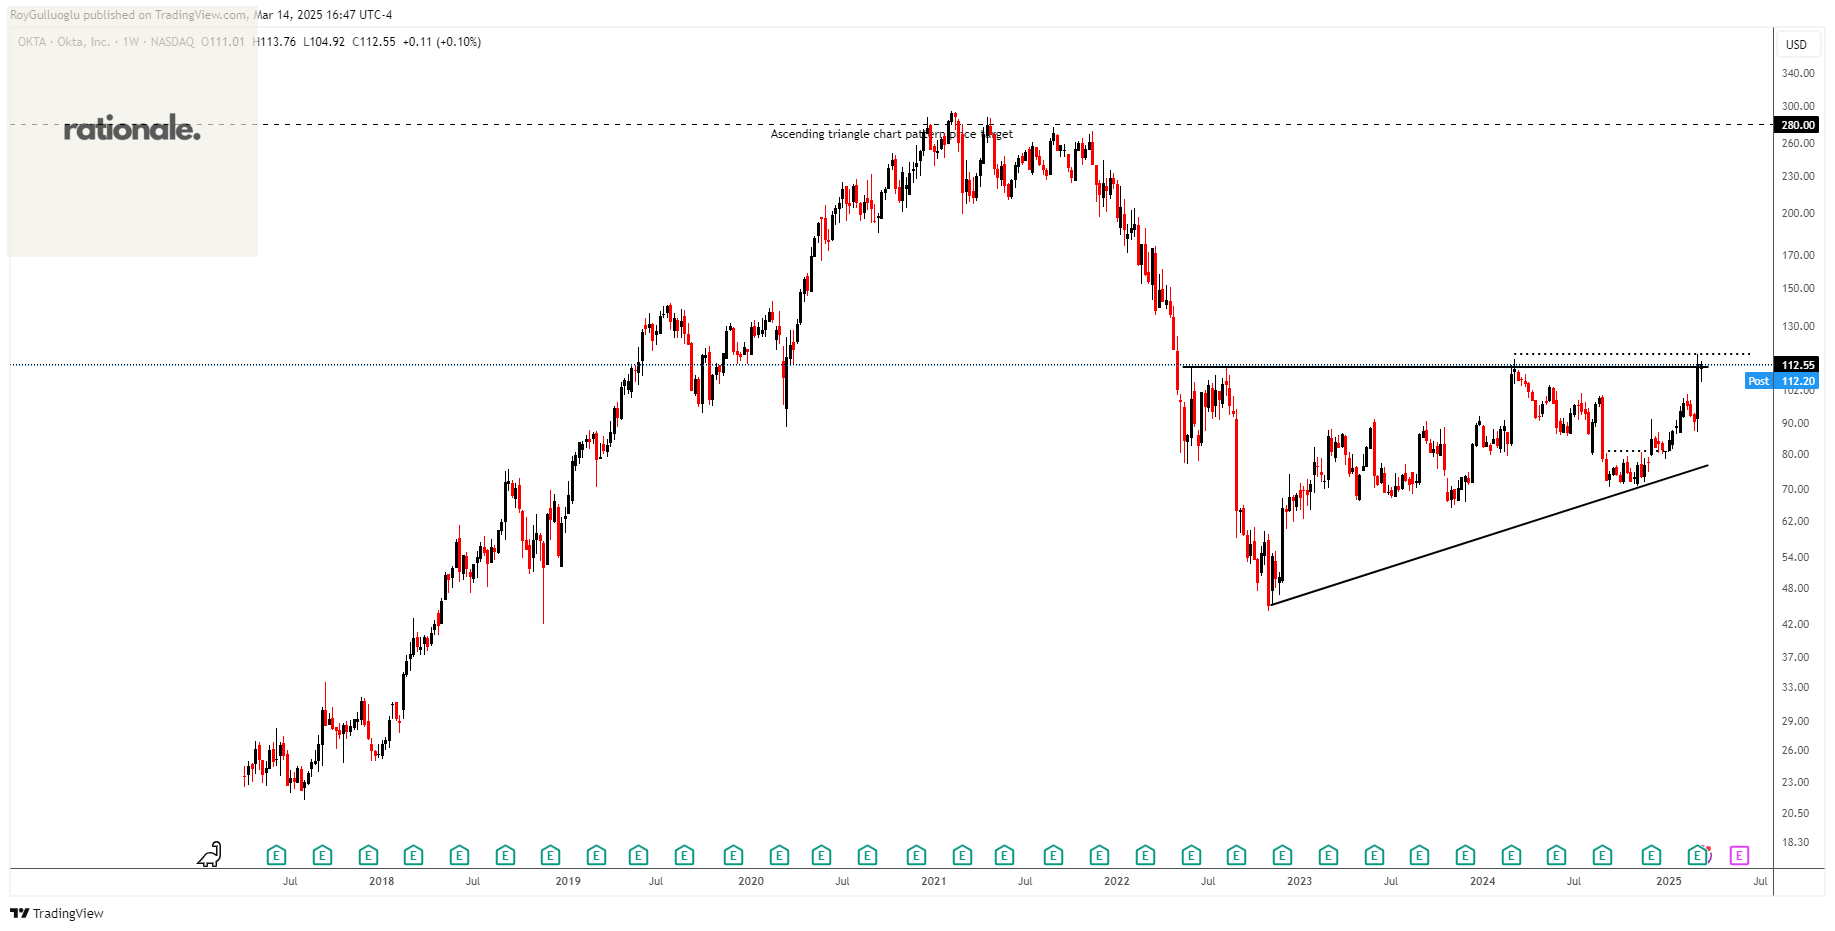
Okta, Inc. is a cybersecurity company specializing in identity management solutions for businesses globally.
The above weekly chart formed an approximately 30-month-long ascending triangle chart pattern as a bullish reversal after a downtrend.
The horizontal boundary at 111 levels acted as a resistance within this pattern.
A daily close above 114.33 levels would validate the breakout from the 30-month-long ascending triangle chart pattern.
Based on this chart pattern, the potential price target is 280 levels.
OKTA, classified under the "technology" sector, falls under the “Large Cap - Growth” stock category.
Sunoco LP-(SUN/NYSE)-Long Idea
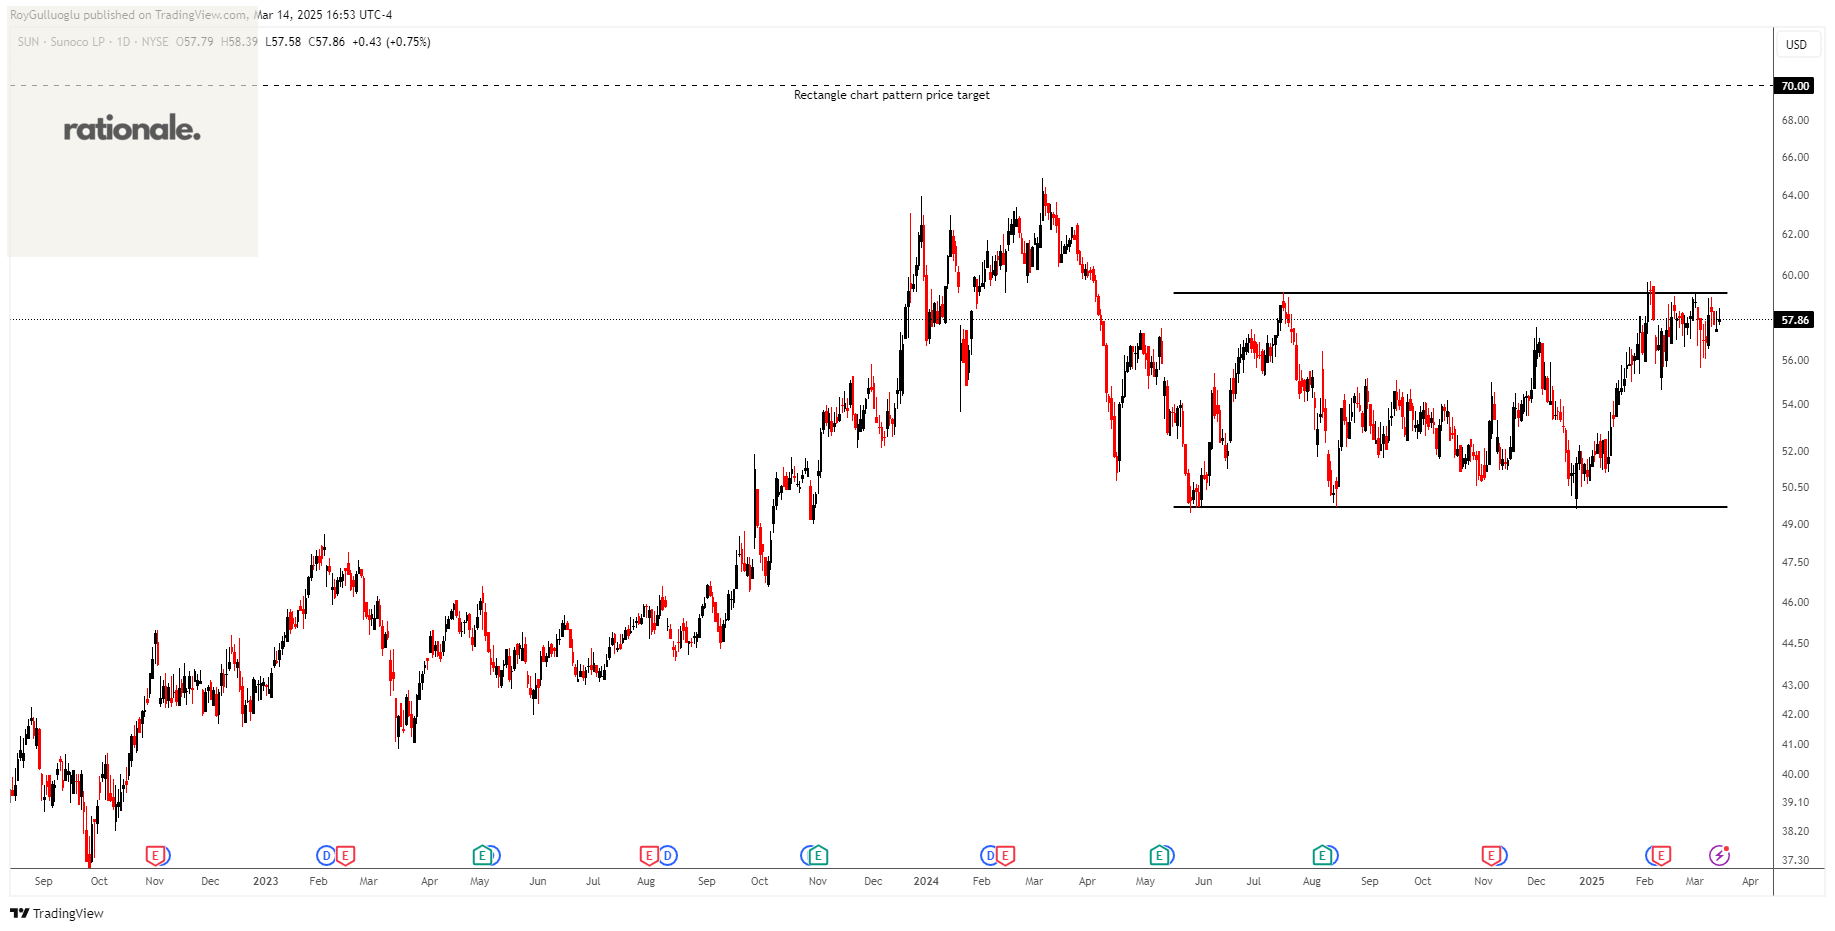
Sunoco LP, together with its subsidiaries, engages in the energy infrastructure and distribution of motor fuels in the United States. It operates in three segments: Fuel Distribution, Pipeline Systems, and Terminals.
The above daily chart formed an approximately 7-month-long rectangle chart pattern as a bullish reversal after a downtrend.
The horizontal boundary at 59.1 levels acts as a resistance within this pattern.
A daily close above 60.87 levels would validate the breakout from the 7-month-long rectangle chart pattern.
Based on this chart pattern, the potential price target is 70 levels.
SUN, classified under the "energy" sector, falls under the “Mid Cap - Income” stock category.
The Gap, Inc.-(GAP/NYSE)-Short Idea
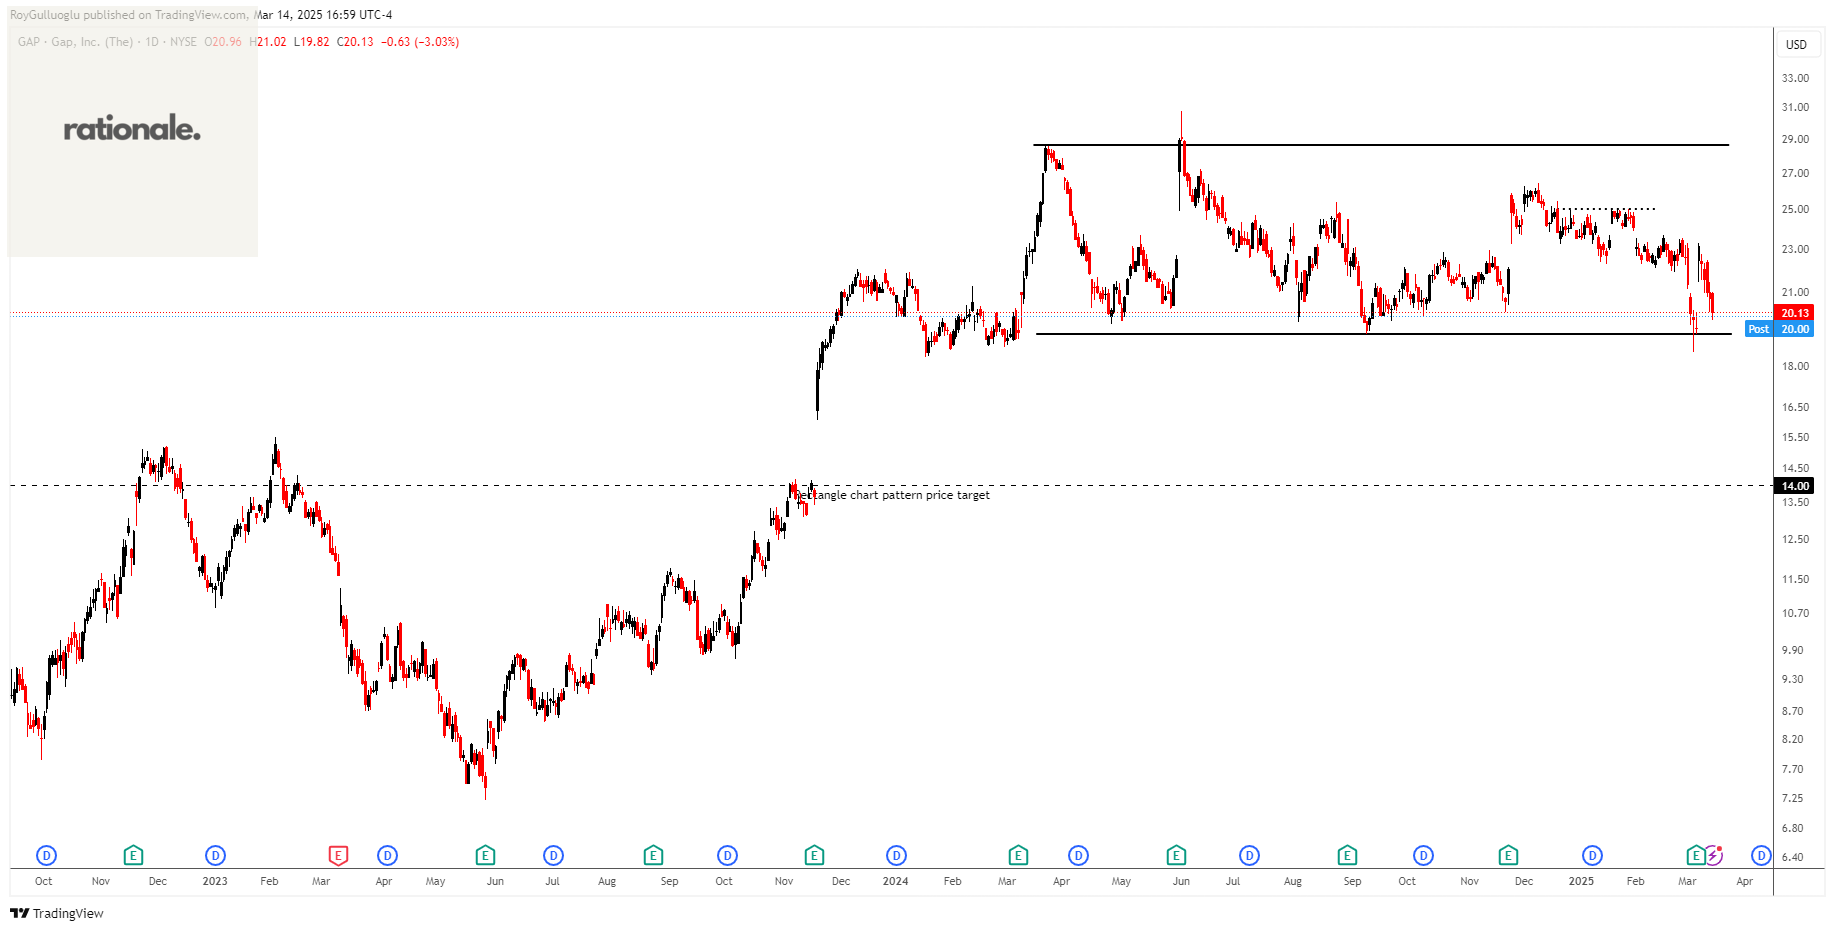
The Gap, Inc. operates as an apparel retail company. The company offers apparel, accessories, and personal care products for men, women, and children under the Old Navy, Gap, Banana Republic, and Athleta brands.
The above daily chart formed an approximately 8-month-long rectangle chart pattern as a bullish reversal after an uptrend.
The horizontal boundary at 19.25 levels acts as a support within this pattern.
A daily close below 18.68 levels would validate the breakdown from the 8-month-long rectangle chart pattern.
Based on this chart pattern, the potential price target is 14 levels.
GAP, classified under the "consumer cyclical" sector, falls under the “Mid Cap - Growth” stock category.
Loews Corporation-(L/NYSE)-Long Idea
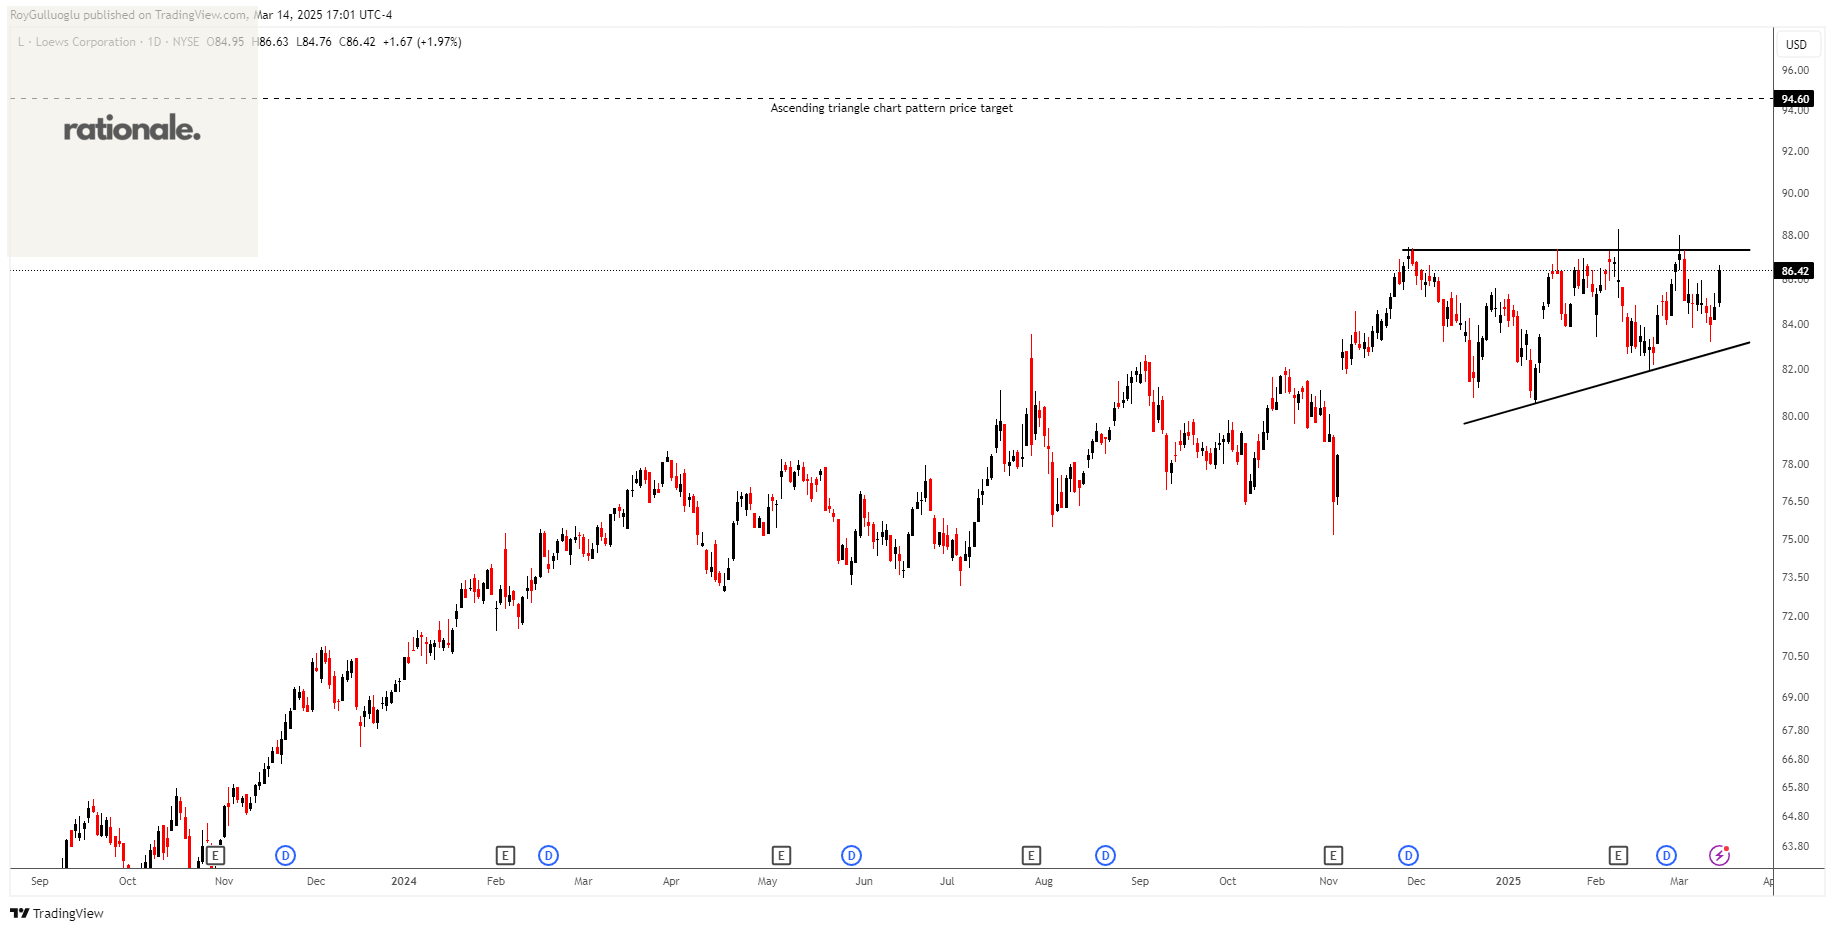
Loews Corporation, through its subsidiaries, provides commercial property and casualty insurance in the United States and internationally.
The above daily chart formed an approximately 3-month-long ascending triangle chart pattern as a bullish continuation after an uptrend.
The horizontal boundary at 87.31 levels acts as a resistance within this pattern.
A daily close above 89.91 levels would validate the breakout from the 3-month-long ascending triangle chart pattern.
Based on this chart pattern, the potential price target is 94.6 levels.
L, classified under the "financial services" sector, falls under the “Large Cap - Value” stock category.
A.P. Møller - Mærsk A/S-(MAERSK/OMXCOP)-Long Idea
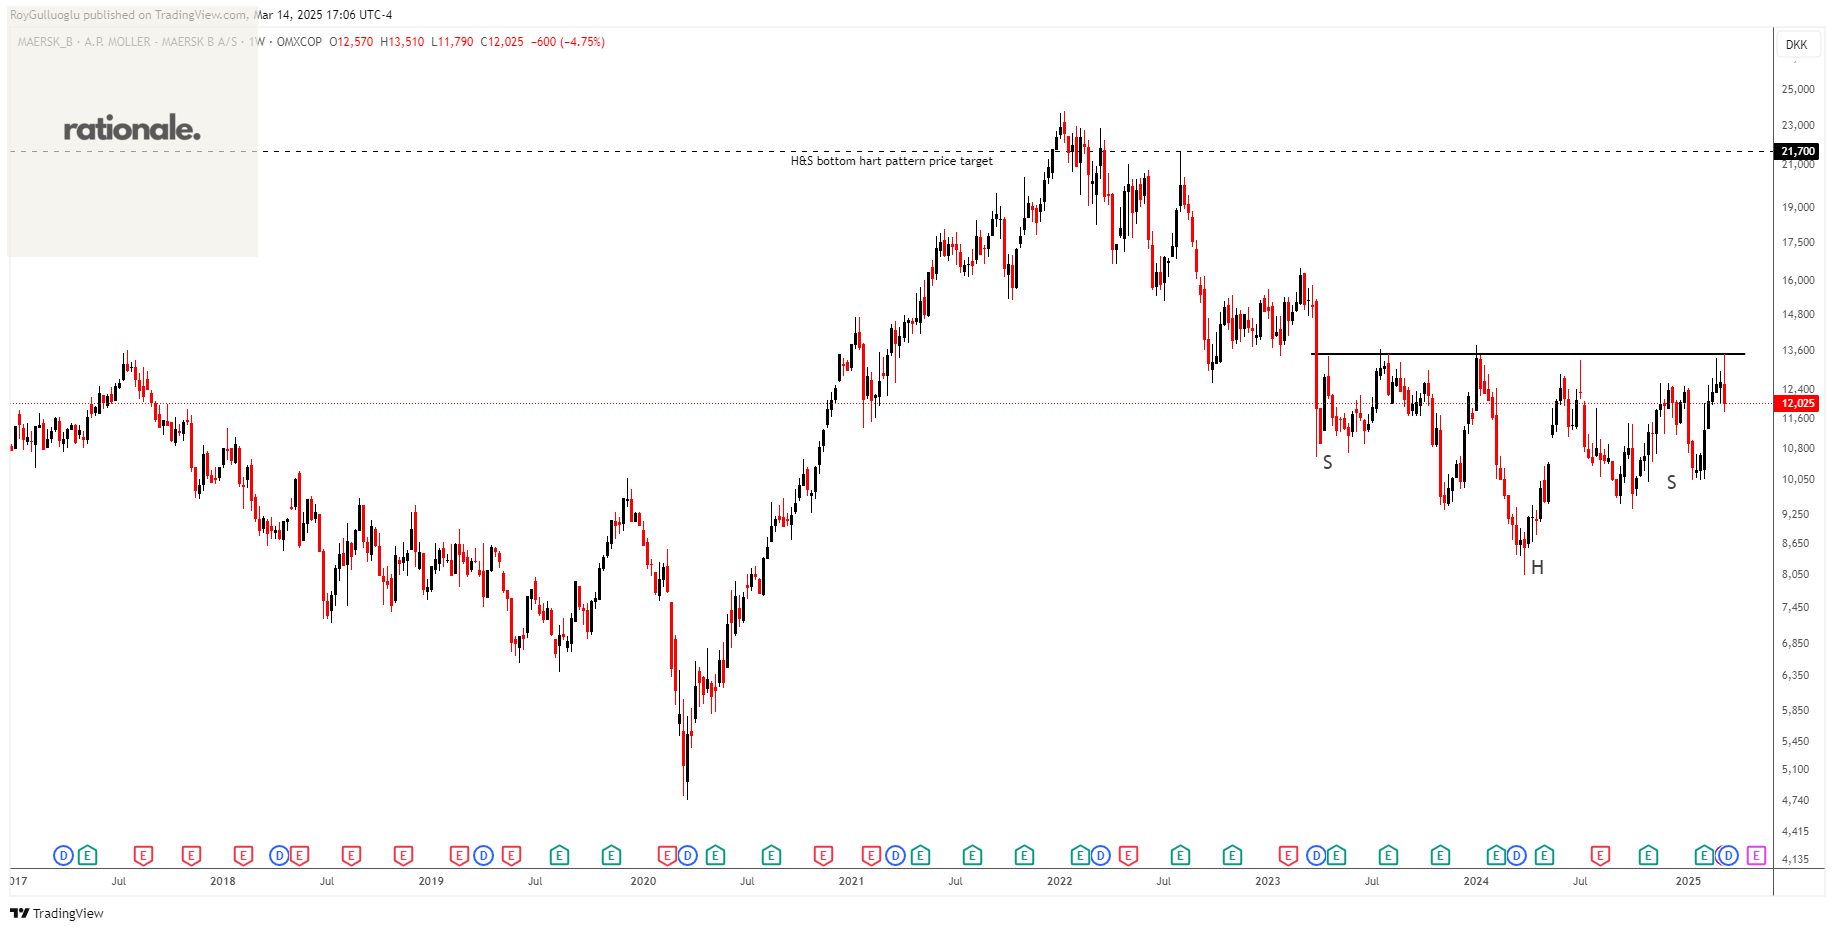
A.P. Møller - Mærsk A/S, together with its subsidiaries, operates as an integrated logistics company in Denmark and internationally.
The above weekly chart formed an approximately 25-month-long H&S bottom chart pattern as a bullish reversal after a downtrend.
The horizontal boundary at 13495 levels acted as a resistance within this pattern.
A daily close above 13900 levels would validate the breakout from the 3-month-long rectangle chart pattern.
Based on this chart pattern, the potential price target is 21700 levels.
MAERSK, classified under the "industrials" sector, falls under the “Large Cap - Value” stock category.
Vestas Wind Systems A/S-(VWS/OMXCOP)-Long Idea
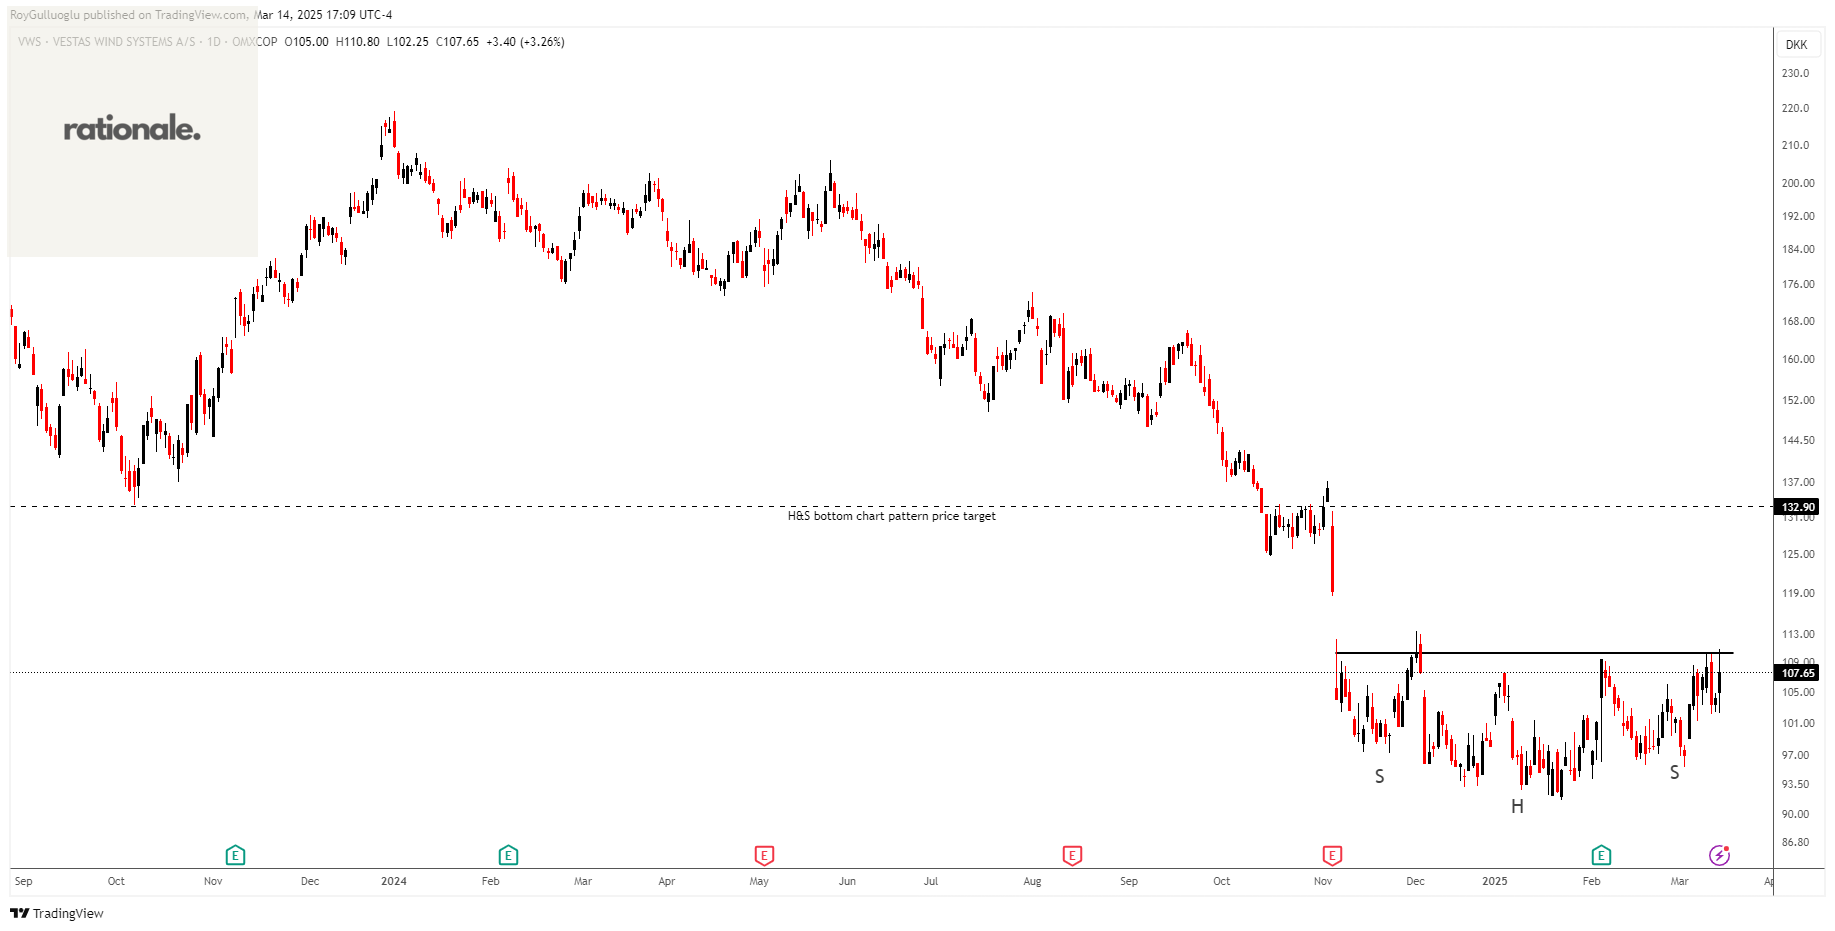
Vestas Wind Systems A/S engages in the design, manufacture, installation, and services of wind turbines the United States, Denmark, and internationally.
The above daily chart formed an approximately 3-month-long H&S bottom chart pattern as a bullish reversal after a downtrend.
The horizontal boundary at 110.35 levels acts as a resistance within this pattern.
A daily close above 113.66 levels would validate the breakout from the 3-month-long H&S bottom chart pattern.
Based on this chart pattern, the potential price target is 132.9 levels.
VWS, classified under the "industrials" sector, falls under the “Large Cap - Value” stock category.
Makita Corporation-(6586/TSE)-Long Idea
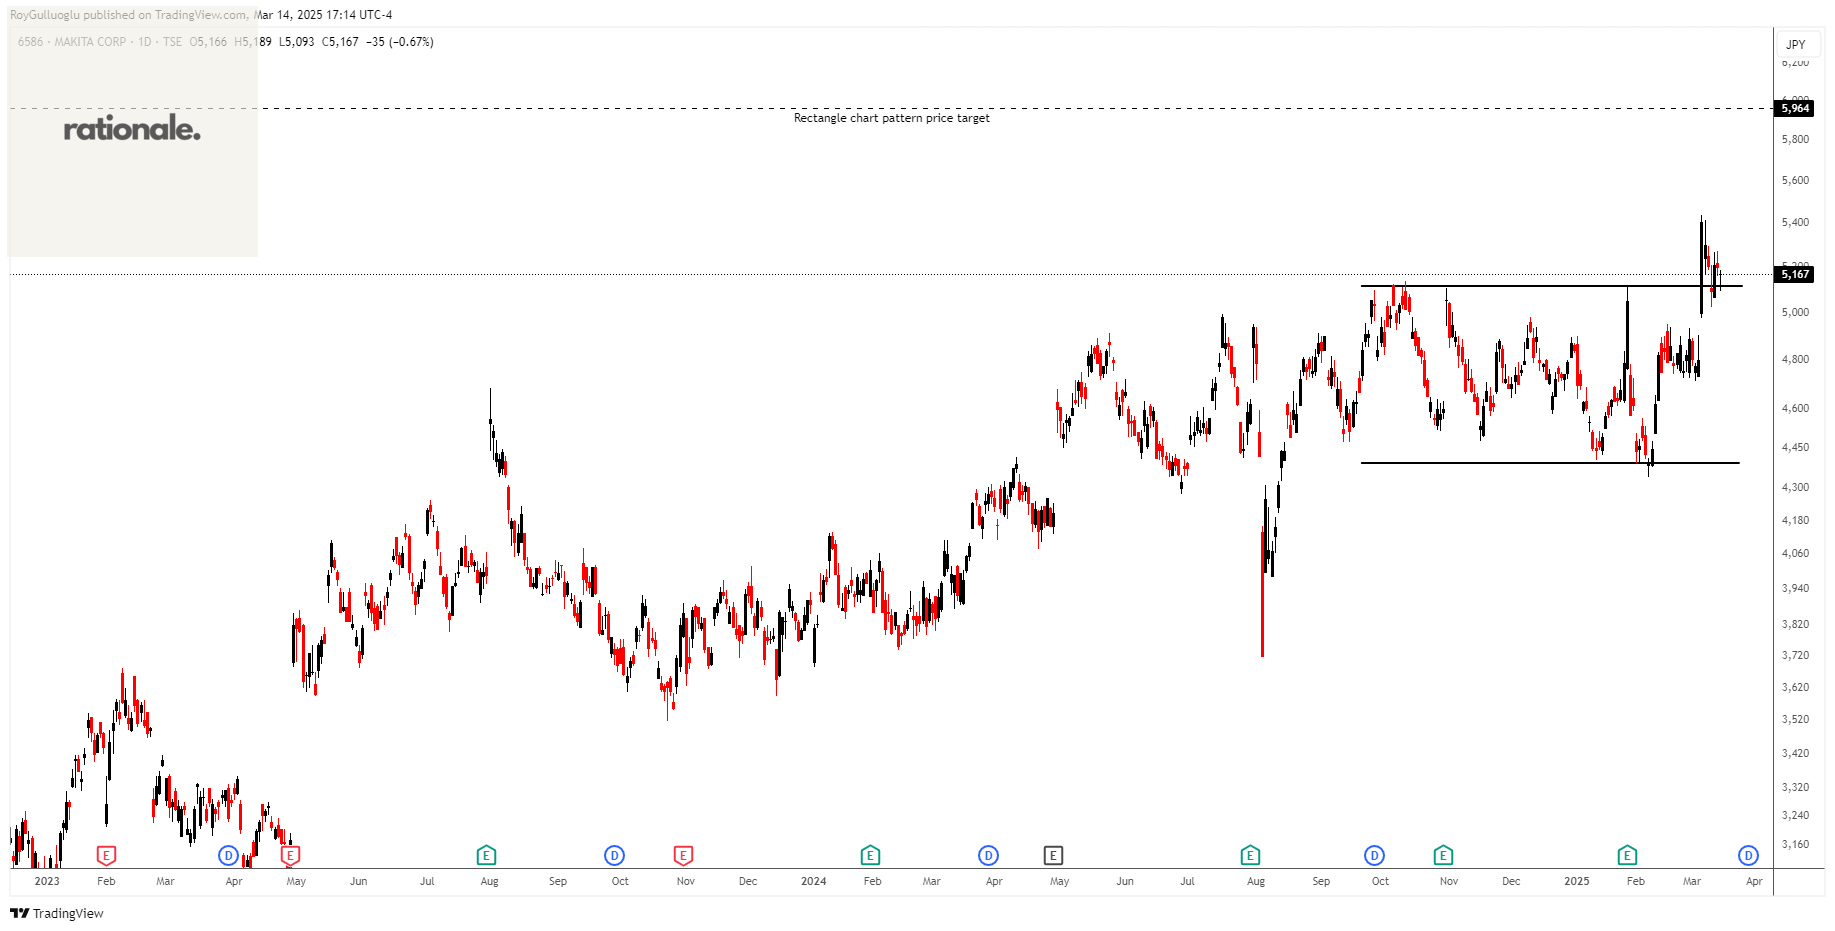
Makita Corporation engages in the manufacture and sale of electric power tools, pneumatic tools, and gardening and household equipment in Japan, Europe, North America, Asia, Australia, Brazil, and the United Arab Emirates.
The above daily chart formed an approximately 3-month-long rectangle chart pattern as a bullish continuation after an uptrend.
The horizontal boundary at 5118 levels acted as a resistance within this pattern.
A daily close above 5271.5 levels validated the breakout from the 3-month-long rectangle chart pattern.
Based on this chart pattern, the potential price target is 5964 levels.
6586, classified under the "industrials" sector, falls under the “Mid Cap - Value” stock category.
Iyogin Holdings,Inc-(5830/TSE)-Long Idea
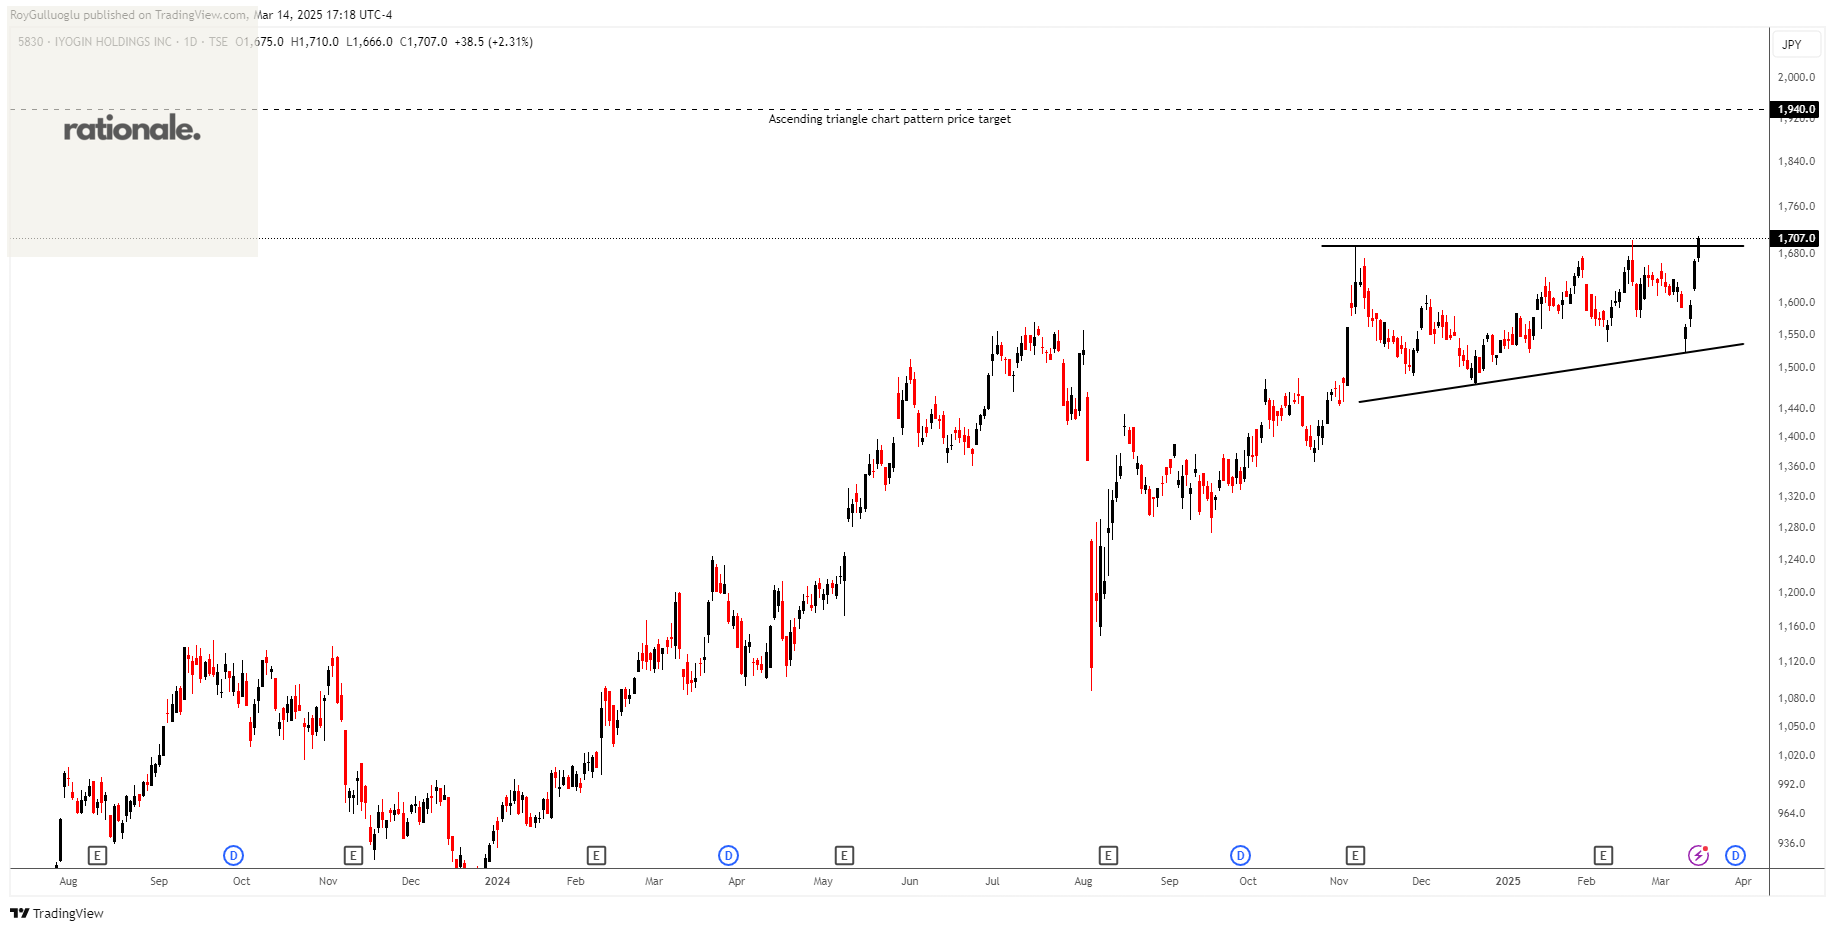
Iyogin Holdings,Inc., together with its subsidiaries, provides banking and financial services. The company's loan portfolio consists of business, syndicate, agricultural, forestry, fisheries, equipment, and working capital loan.
The above daily chart formed an approximately 3-month-long ascending triangle chart pattern as a bullish continuation after an uptrend.
The horizontal boundary at 1694 levels acts as a resistance within this pattern.
A daily close above 1744 levels would validate the breakout from the 3-month-long ascending triangle chart pattern.
Based on this chart pattern, the potential price target is 1940 levels.
5830, classified under the "financial services" sector, falls under the “Mid Cap - Income” stock category.
Nippon Shokubai Co., Ltd.-(4114/TSE)-Long/Short Idea
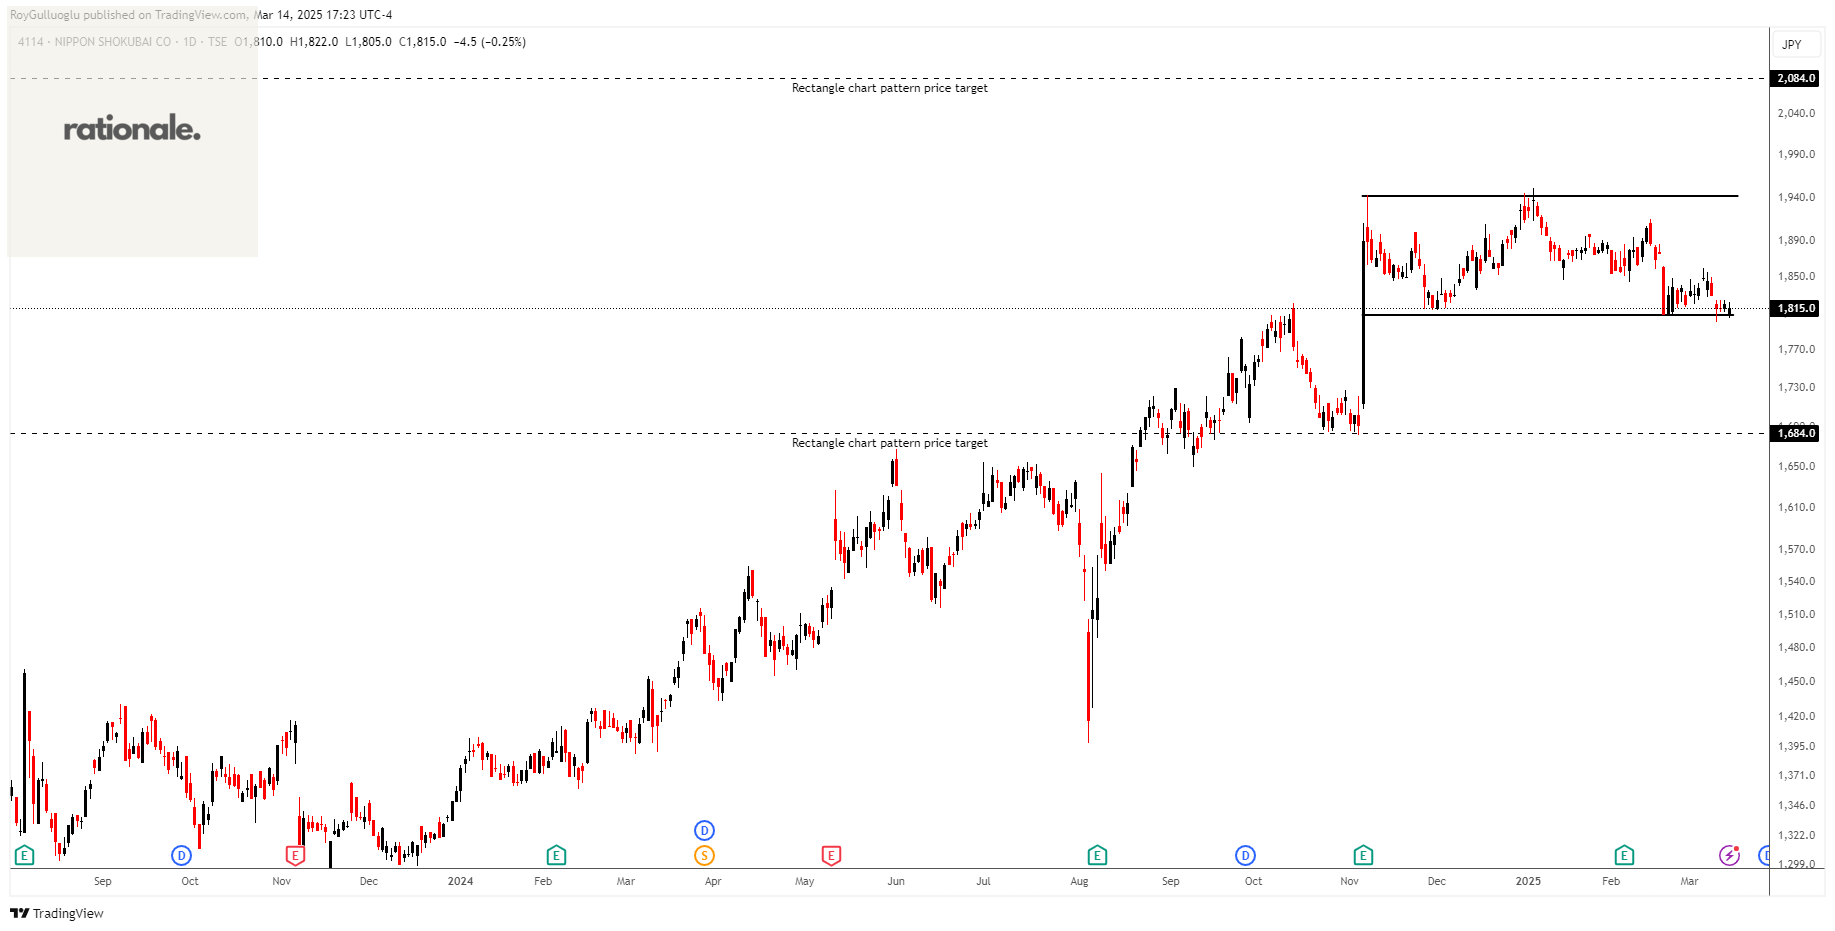
Nippon Shokubai Co., Ltd. engages in the manufacture and sale of various chemical products in Japan and internationally. It operates in two segments: Materials Business and Solutions Business.
The above daily chart formed an approximately 3-month-long rectangle chart pattern that might act as a bearish reversal after an uptrend or a bullish continuation after an uptrend.
The horizontal boundary at 1808 levels acts as a support within this pattern while 1942 levels act as a resistance.
A daily close below 1796 (Boundary-ATR(10/30)/2) levels would validate the breakdown and a daily close above 1954 (ATR(10/30)/2+Boundary) would validate the breakout from the 3-month-long rectangle chart pattern.
Based on the chart patterns, the potential price targets are 1684 and 2084 levels respectively.