


iShares MSCI Japan ETF-(EWJV/NASDAQ)-Long Idea
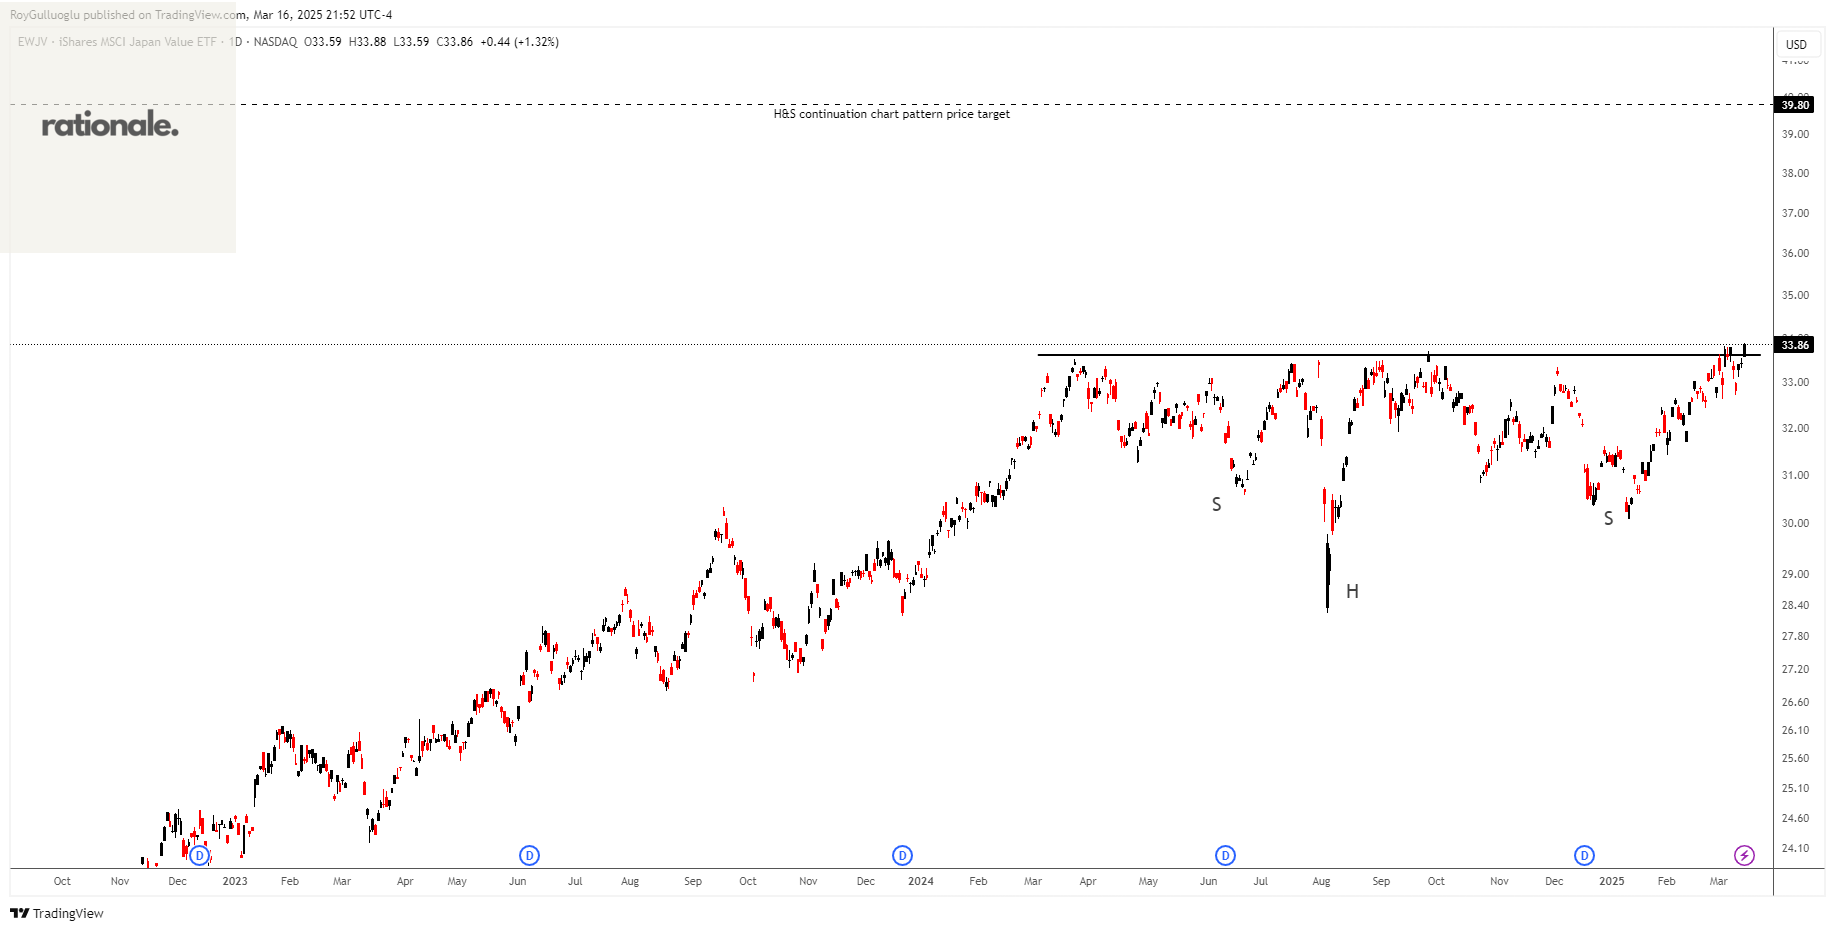
The above daily chart formed an approximately 8-month-long ascending H&S continuation chart pattern as a bullish continuation after an uptrend.
The horizontal boundary at 33.61 levels acts as a resistance within this pattern.
A daily close above 34.1(ATR(10/30)/2+boundary) levels would validate the breakout from the 8-month-long ascending H&S continuation chart pattern.
Based on this chart pattern, the potential price target is 39.8 levels.
iShares MSCI Emerging Markets ETF-(EEM/ARCA)-Long Idea
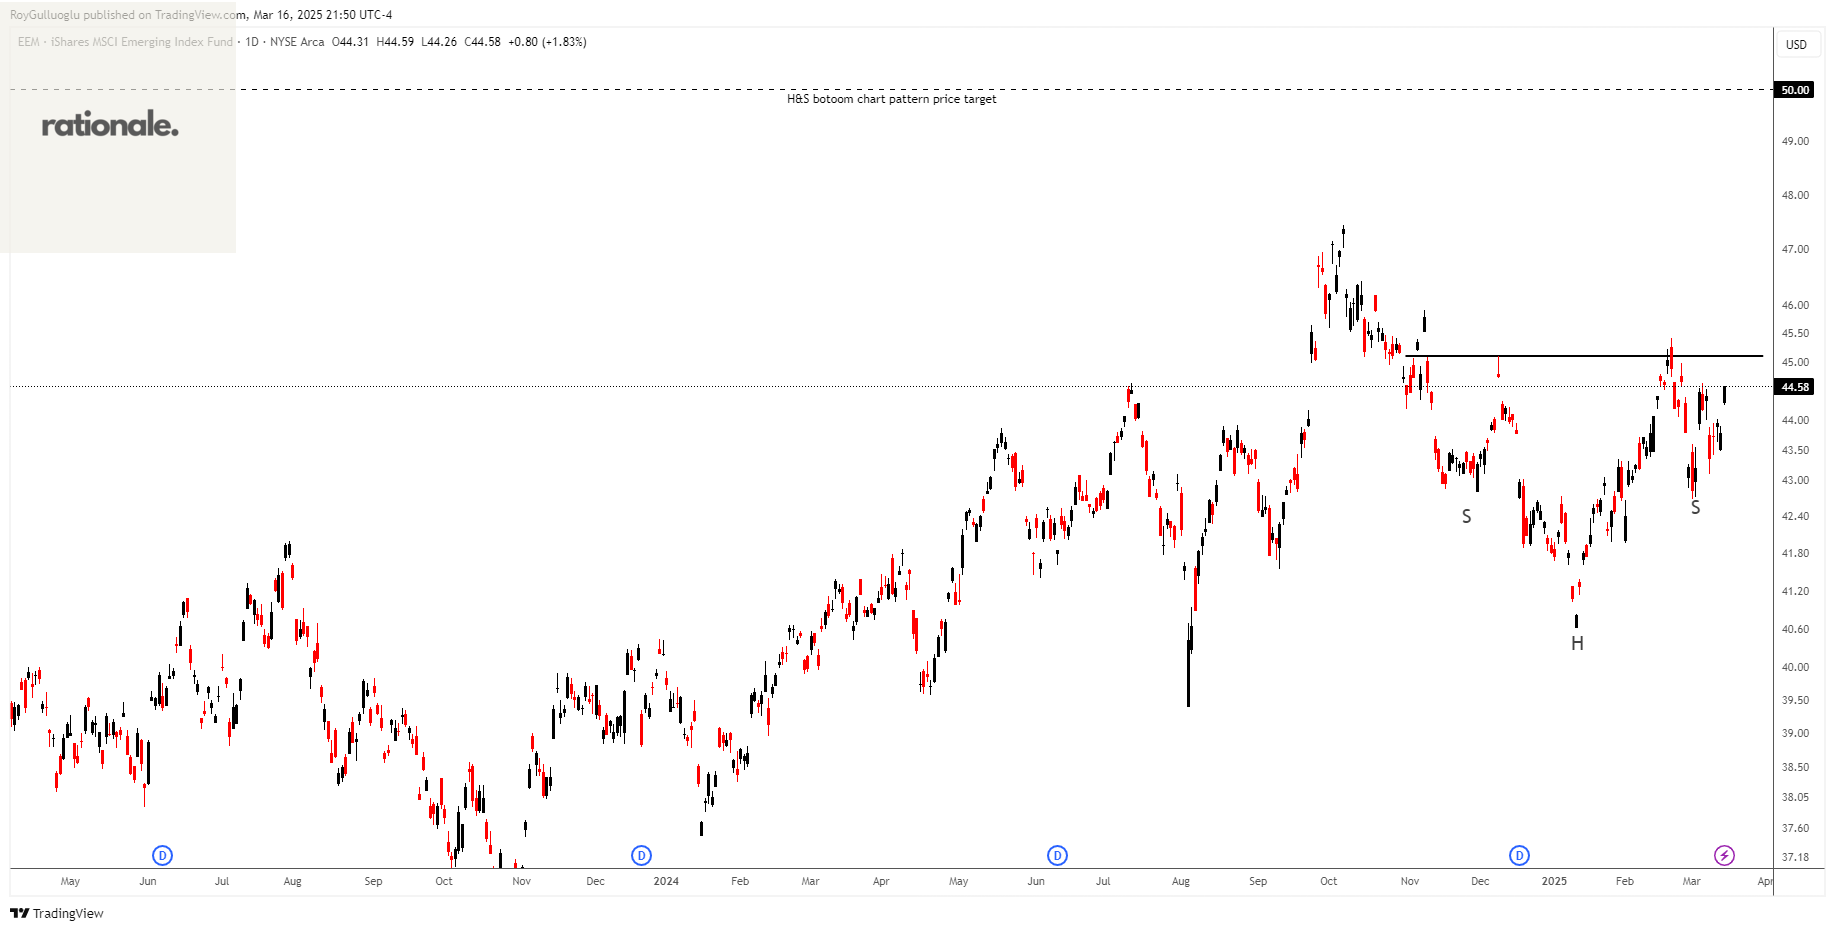
The fund invests at least 80% of its assets in securities of its underlying index, which tracks large- and mid-cap equities in global emerging markets.
The above daily chart formed an approximately 3-month-long H&S bottom chart pattern as a bullish reversal after a downtrend.
The horizontal boundary at 45.1 levels acts as a resistance within this pattern.
A daily close above 45.45(ATR(10/30)/2+boundary) levels would validate the breakout from the 3-month-long ascending H&S bottom chart pattern.
Based on this chart pattern, the potential price target is 50 levels.
XRPUSDT-Long/Short Idea
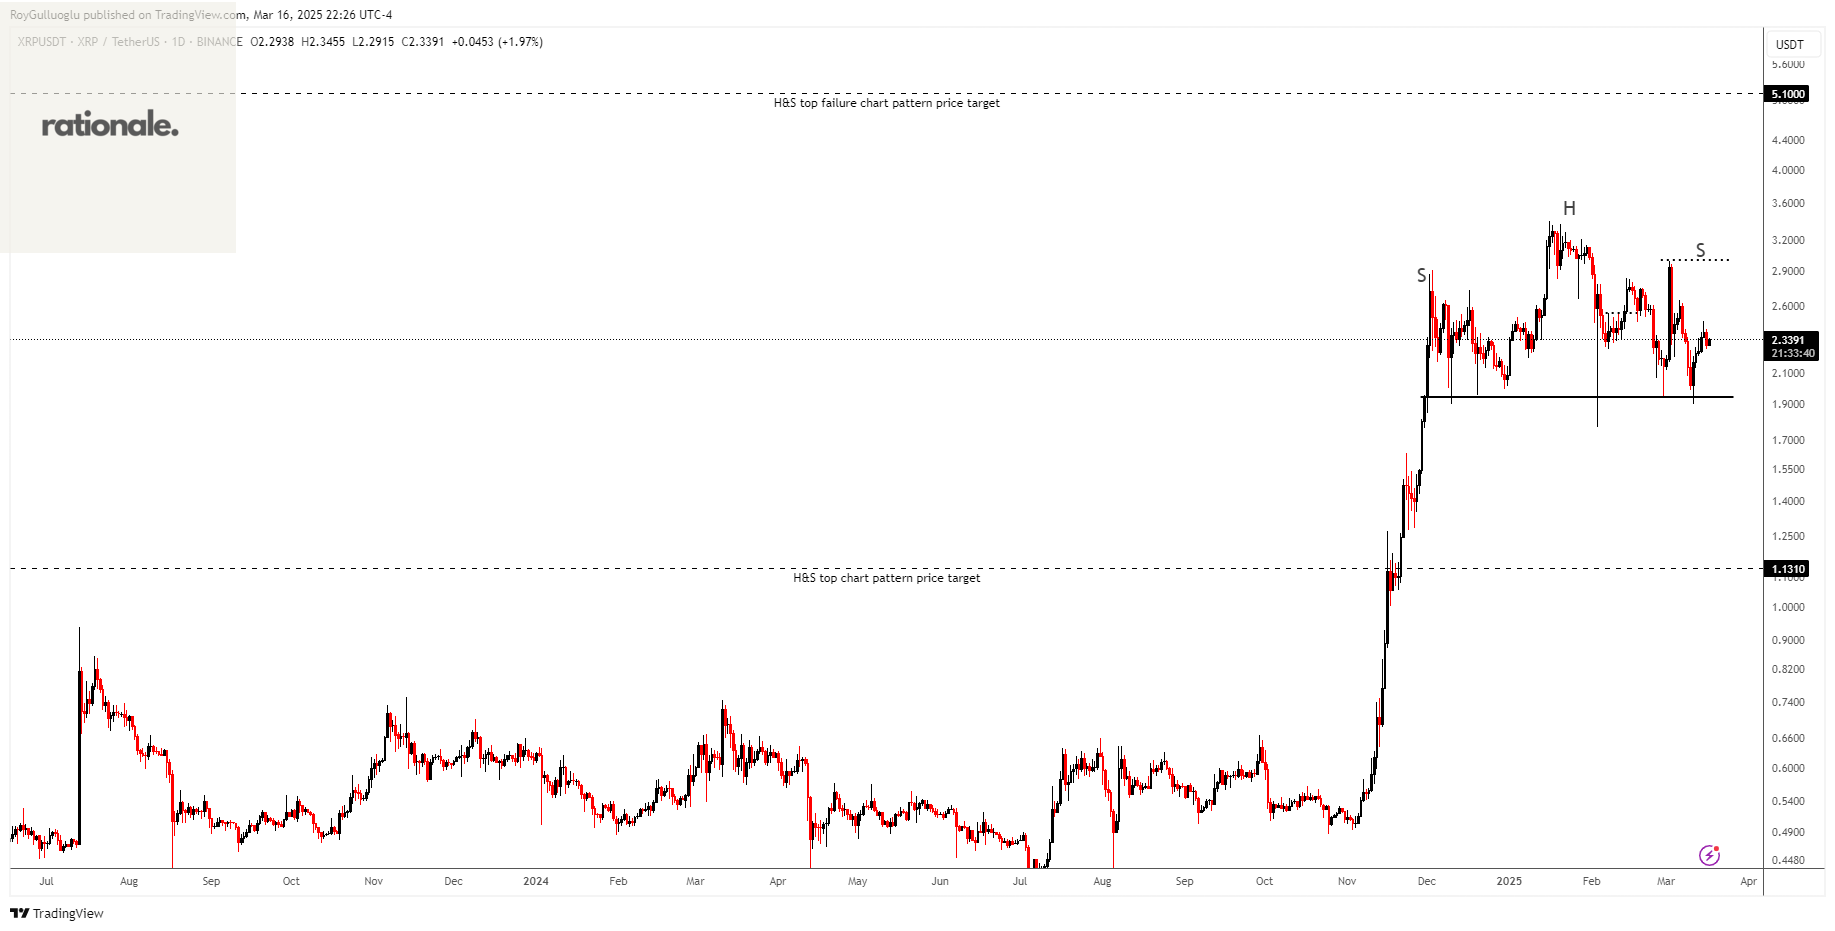
The above daily chart formed an approximately 3-month-long H&S top chart pattern as a bearish reversal after an uptrend or it might act as a continuation and form an H&S failure chart pattern.
The horizontal boundary at 1.9455 levels acts as a support within this pattern while 3.0 levels act as a resistance.
A daily close below 1.887 levels would validate the breakdown from the 3-month-long H&S top chart pattern. A daily close above 3.1 would validate the breakout from the H&S failure chart pattern.
Based on the chart patterns, the potential price targets are 1.131 and 5.1 levels respectively.