


Old Republic International Corporation-(ORI/NYSE)-Long Idea
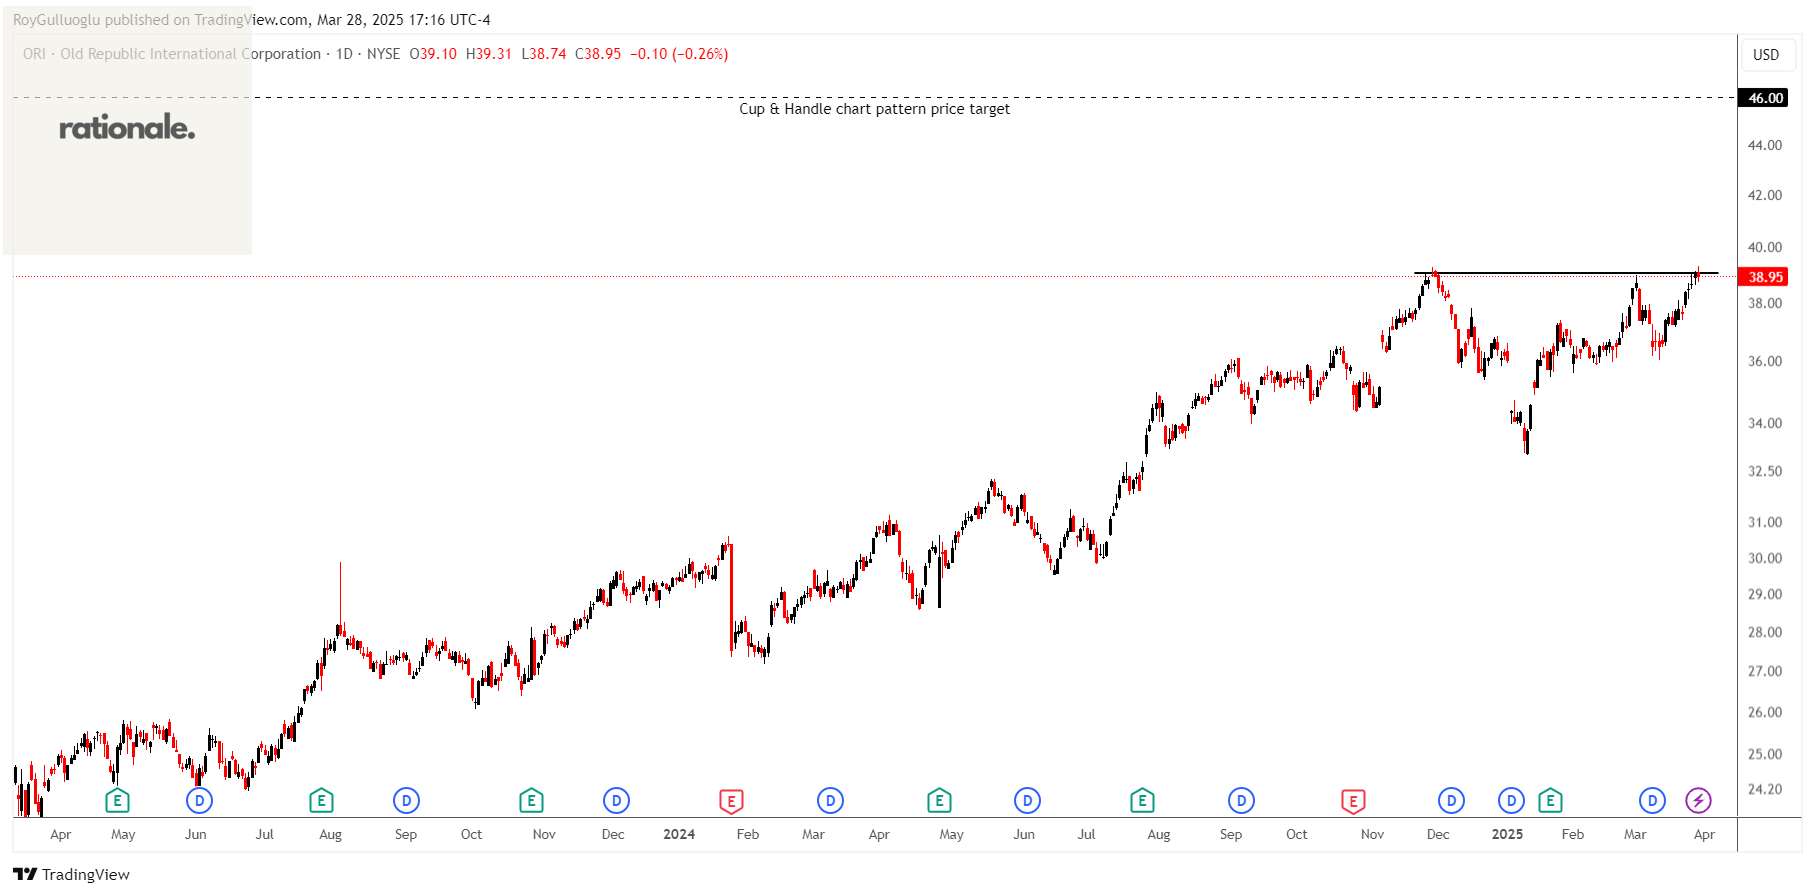
Old Republic International Corporation, through its subsidiaries, provides insurance underwriting and related services primarily in the United States and Canada.
The above daily chart formed an approximately 3-month-long cup & handle chart pattern as a bullish continuation after an uptrend.
The horizontal boundary at 39.05 levels acts as a resistance within this pattern.
A daily close above 40.22 levels would validate the breakout from the 3-month-long cup & handle chart pattern.
Based on this chart pattern, the potential price target is 46 levels.
ORI, classified under the "financial services" sector, falls under the “Mid Cap - Income” stock category.
PennyMac Financial Services, Inc.-(PFSI/NYSE)-Short Idea
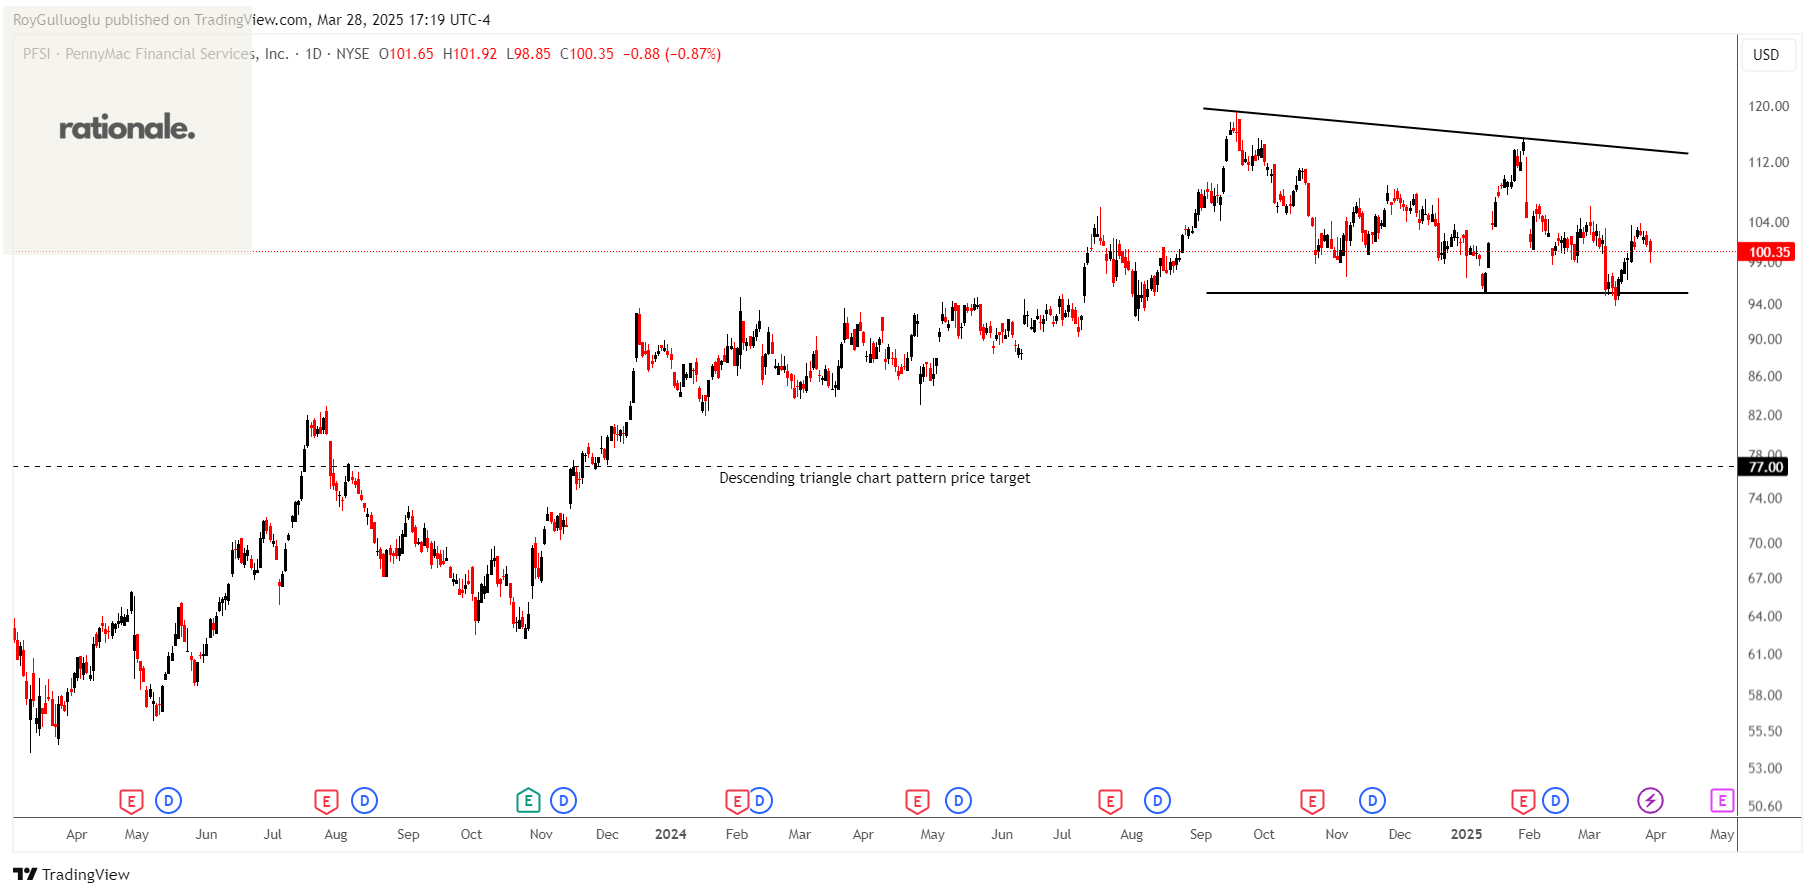
PennyMac Financial Services, Inc., through its subsidiaries, engages in the mortgage banking and investment management activities in the United States.
The above daily chart formed an approximately 4-month-long descending triangle chart pattern as a bearish reversal after an uptrend.
The horizontal boundary at 95.3 levels acted as a support within this pattern.
A daily close below 92.45 levels would validate the breakdown from the 4-month-long descending triangle chart pattern .
Based on this chart pattern, the potential price target is 77 levels.
PFSI, classified under the "financial services" sector, falls under the “Mid Cap - Income” stock category.
Nexstar Media Group, Inc.-(NXST/NASDAQ)-Long/Short Idea
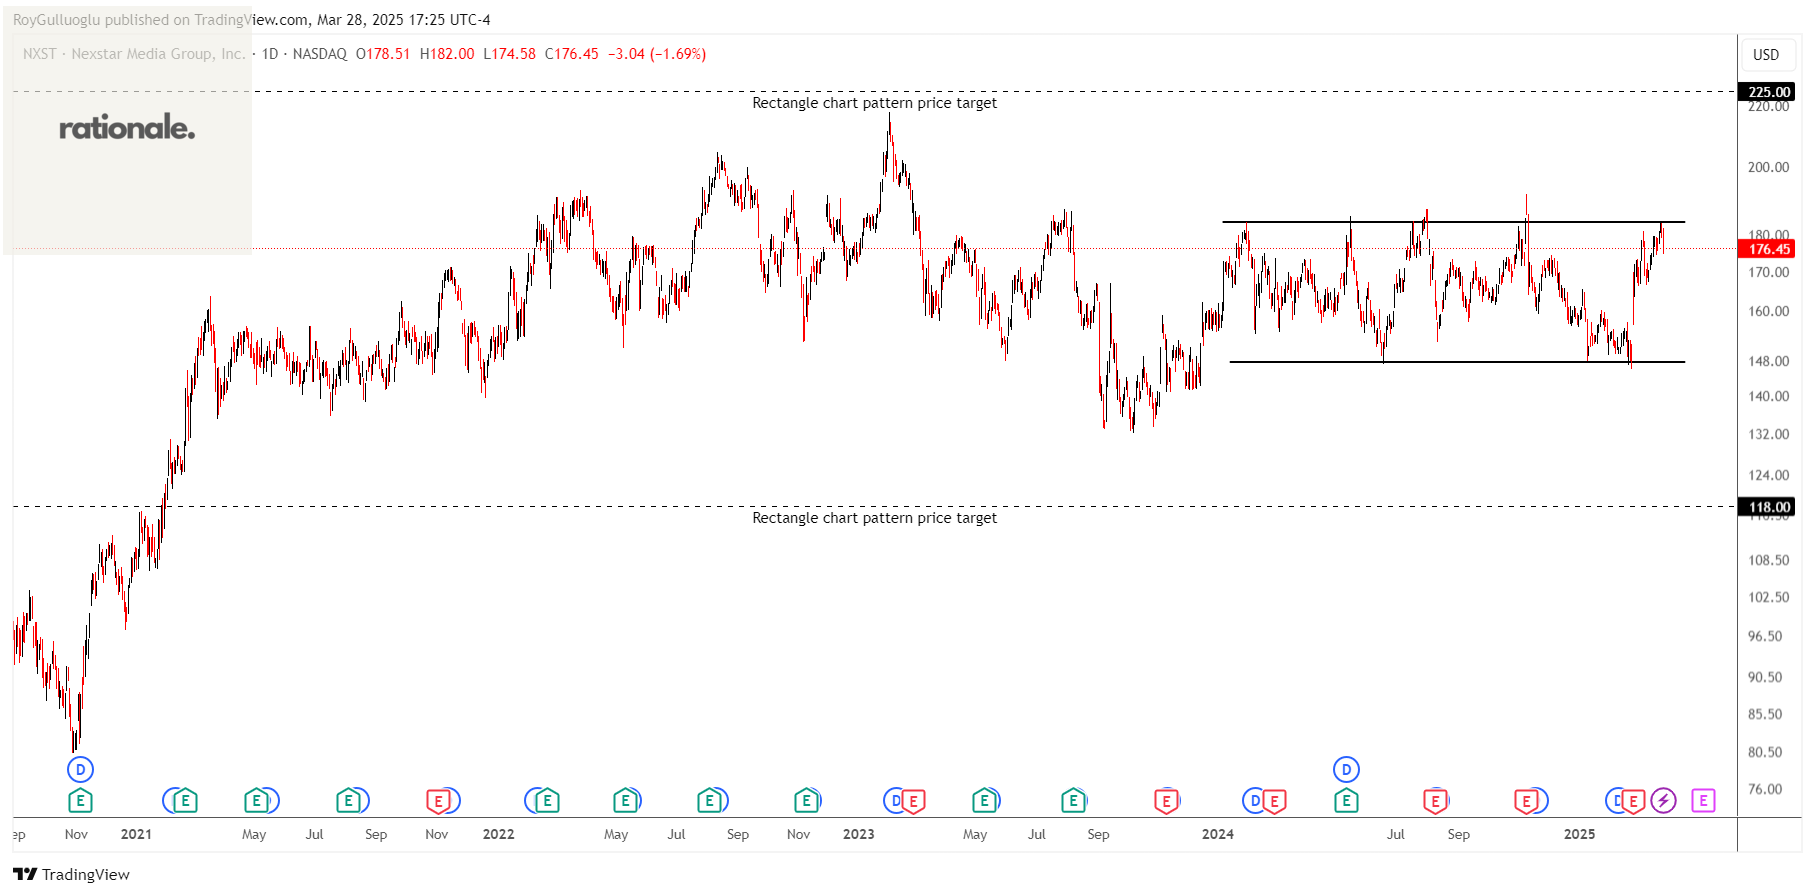
Nexstar Media Group, Inc. operates as a diversified media company that produces and distributes local and national news, sports, and entertainment contents on the television and digital platforms in the United States.
The above daily chart formed an approximately 10-month-long rectangle chart pattern as a bearish reversal or bullish continuation after an uptrend.
The horizontal boundary at 147.63 levels acts as a support within this pattern while 183.56 levels act as a resistance.
A daily close below 143.2 levels would validate the breakdown and a daily close above 189 would validate the breakout from the 10-month-long rectangle chart pattern.
Based on the chart patterns, the potential price targets are 118 and 225 levels respectively.
NXST, classified under the "communication services" sector, falls under the “Mid Cap - Growth” stock category.
Mattel, Inc.-(MAT/NASDAQ)-Long/Short Idea
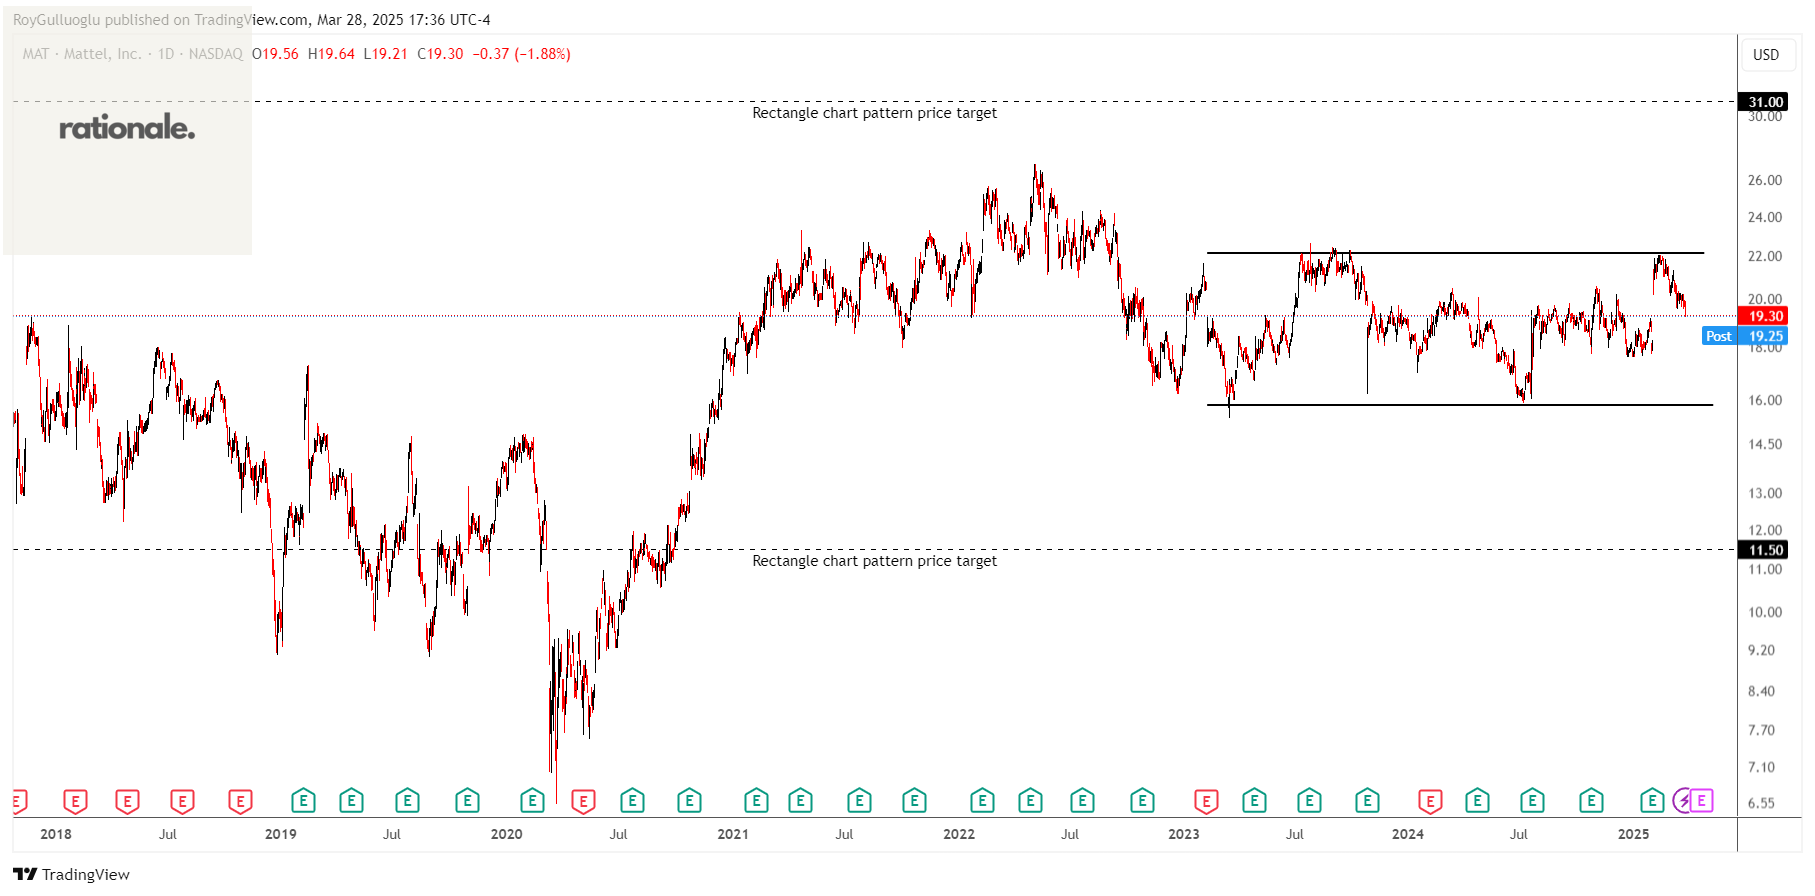
Mattel, Inc., a toy and family entertainment company, designs, manufactures, and markets toys and consumer products in North America, Latin America, Europe, the Middle East, Africa, and the Asia Pacific.
The above daily chart formed an approximately 42-month-long rectangle chart pattern as a bearish reversal or bullish continuation after an uptrend.
The horizontal boundary at 15.81 levels acts as a support within this pattern while 22.16 levels act as a resistance.
A daily close below 15.34 levels would validate the breakdown and a daily close above 22.83 would validate the breakout from the 10-month-long rectangle chart pattern.
Based on the chart patterns, the potential price targets are 11.5 and 31 levels respectively.
MAT, classified under the "consumer cyclicals" sector, falls under the “Mid Cap - Growth” stock category.
Teşekkürler Roy