


Hey everyone! The latest Market Update episode is now live, along with the new FX Futures ETF Crypto report!
GBPZAR-Long Idea
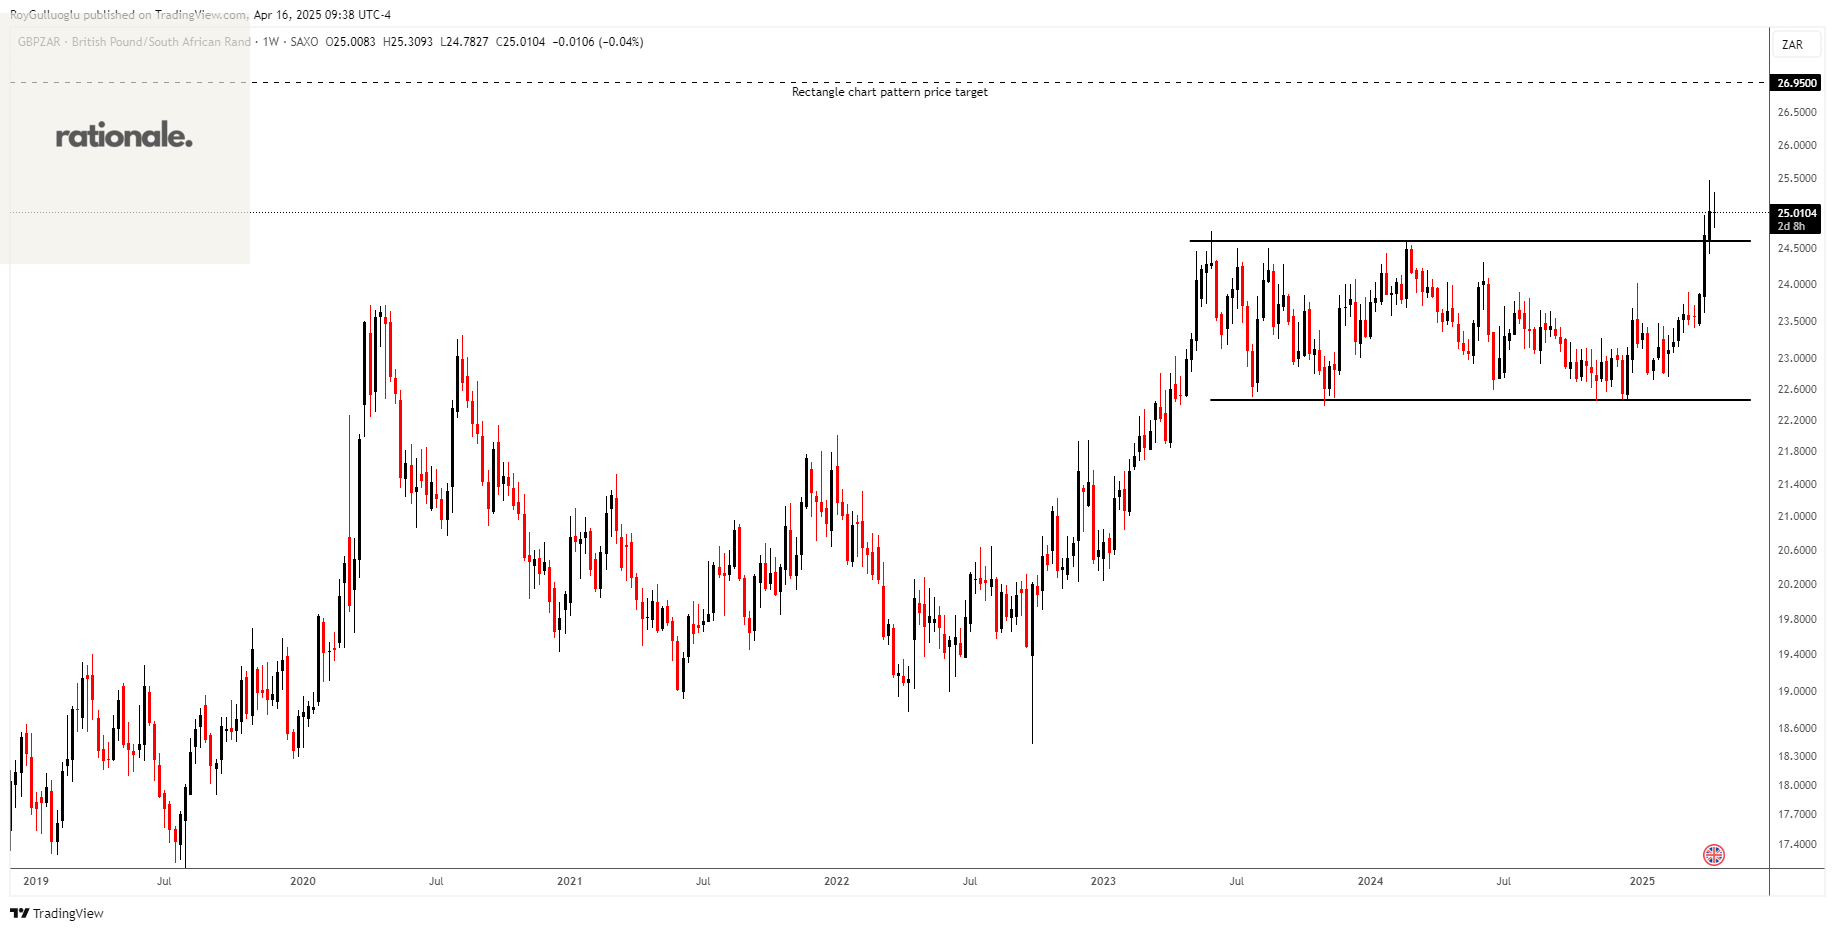
The above weekly chart formed an approximately 25-month-long rectangle chart pattern as a bullish continuation after an uptrend.
The horizontal boundary at 24.607 levels acted as a resistance within this pattern.
A daily close above 24.85 levels validated the breakout from the 25-month-long rectangle chart pattern.
Based on this chart pattern, the potential price target is approximately 26.95 levels.
The UK's favorable position in trade agreements offers a degree of protection for its currency, regardless of the direction tariff decisions take. Additionally, persistent inflation concerns are likely to keep the Bank of England on a more hawkish path compared to its peers.
On the other hand, the South African rand, as an emerging market currency, looks vulnerable in the current environment of uncertainty and risk-off sentiment in global markets—making it a reasonable candidate to position against.
EURNOK-Long Idea
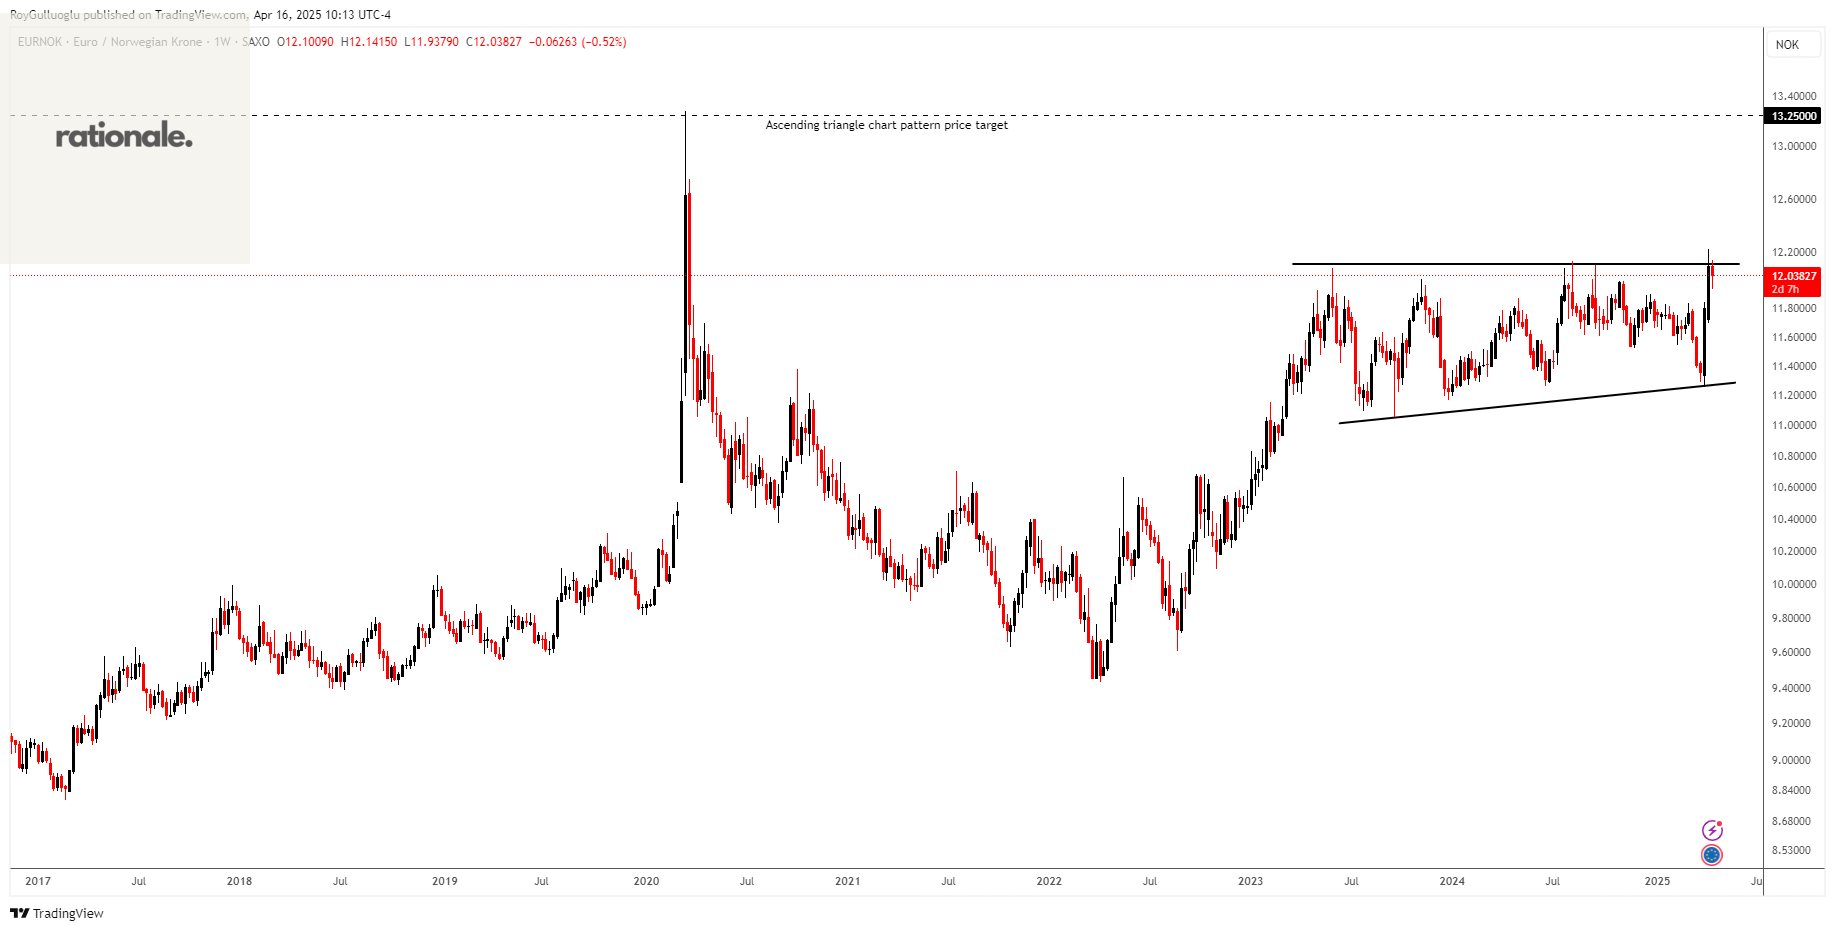
The above weekly chart formed an approximately 25-month-long ascending triangle chart pattern as a bullish continuation after an uptrend.
The horizontal boundary at 12.1150 levels acts as a resistance within this pattern.
A daily close above 12.236 levels would validate the breakout from the 25-month-long ascending triangle chart pattern.
Based on this chart pattern, the potential price target is approximately 13.25 levels.
XAGUSD-Long Idea
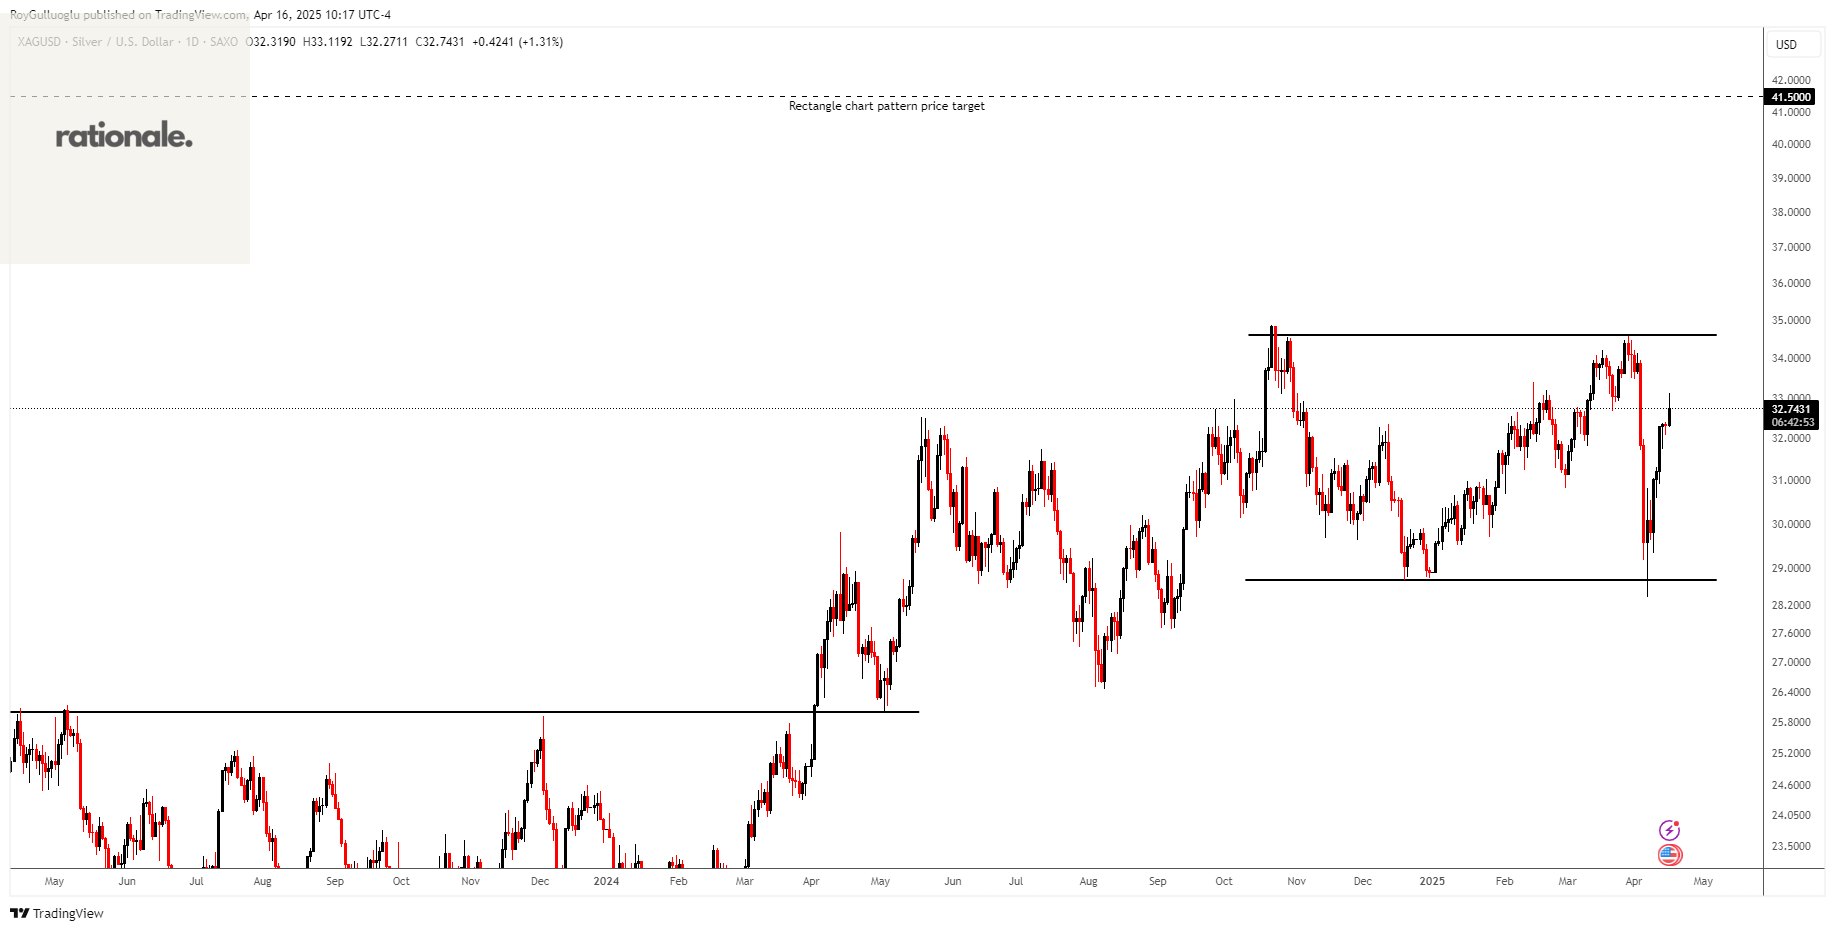
The above daily chart formed an approximately 32-month-long rectangle chart pattern as a bullish continuation after an uptrend.
The horizontal boundary at 34.61 levels acts as a resistance within this pattern.
A daily close above 34.95 levels would validate the breakout from the 32-month-long rectangle chart pattern.
Based on this chart pattern, the potential price target is approximately 41.5 levels.
Even though industrial demand does not seem strong currently, silver could get more attention as a precious metal, especially if gold keeps rising and silver starts to catch up.
TRXUSDT-Long Idea
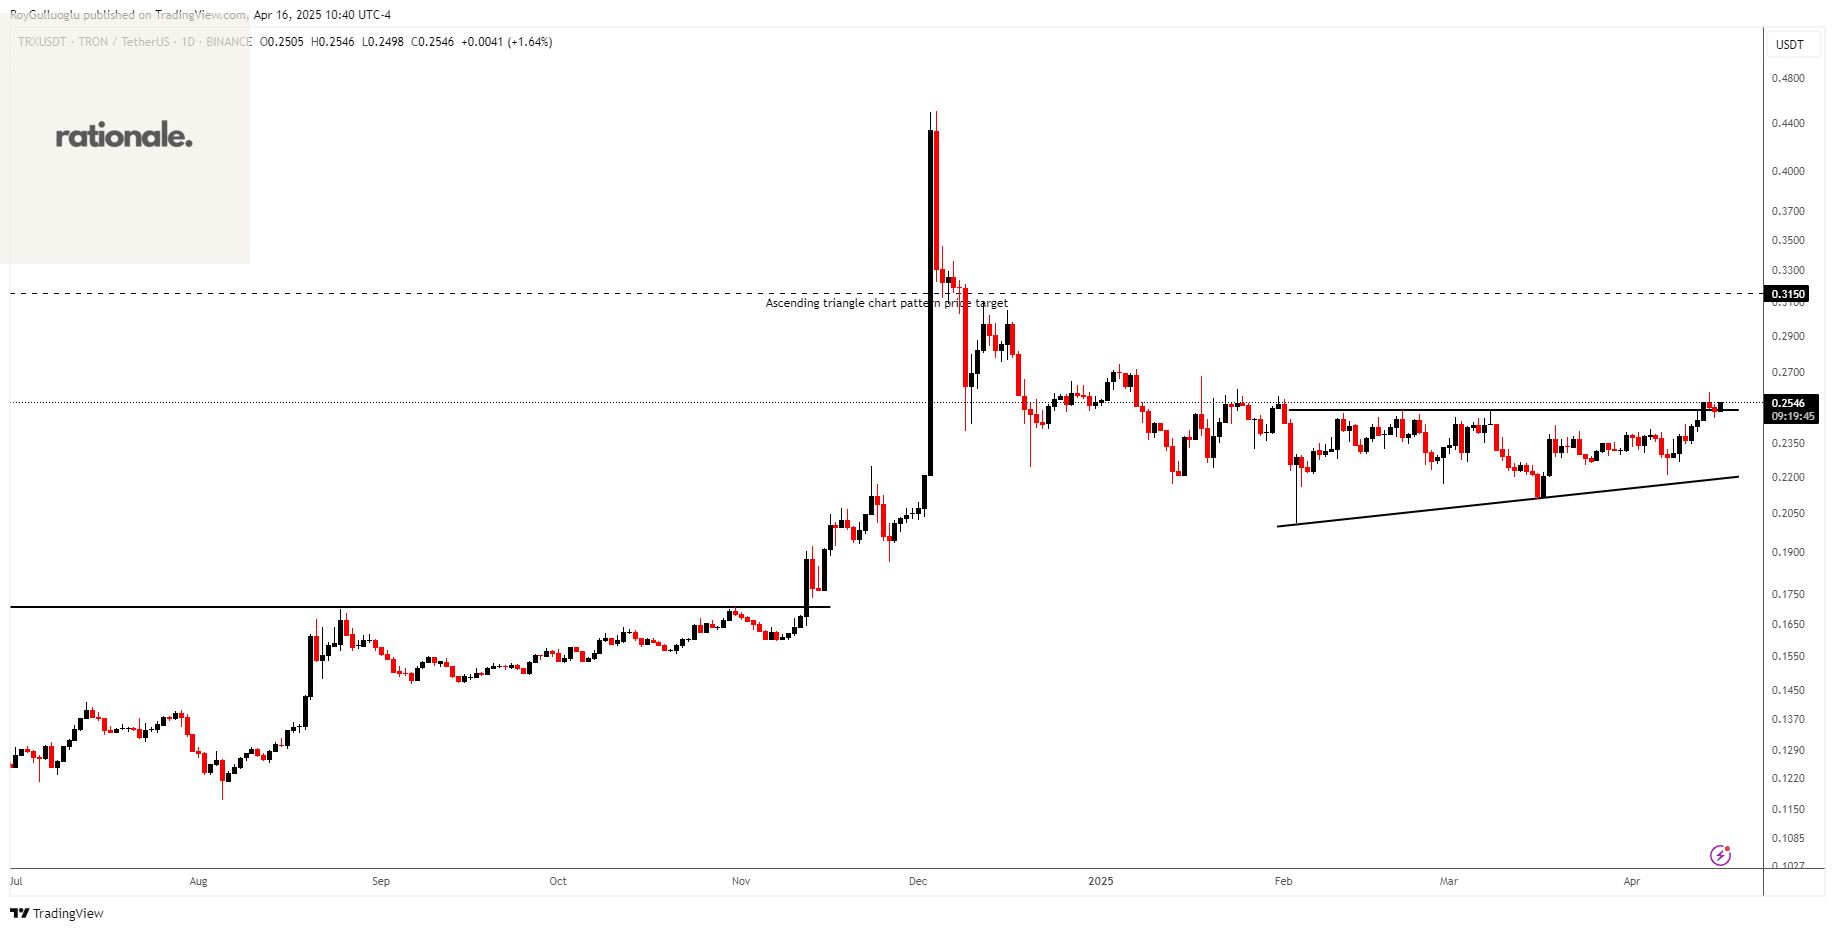
The above daily chart formed an approximately 3-month-long ascending triangle chart pattern as a bullish reversal after a downtrend.
The horizontal boundary at 0.251 levels acts as a resistance within this pattern.
A daily close above 0.2585 levels would validate the breakout from the ascending triangle chart pattern.
Based on this chart pattern, the potential price target is approximately 0.3150 levels.