

Trade Ideas Equities
SPR(NYSE), ULS(NYSE), GWRE(NYSE), TRP(NYSE), TRV(NYSE), SKWD(NASDAQ), 3690(HKEX)

Spirit AeroSystems Holdings, Inc.-(SPR/NYSE)-Long Idea
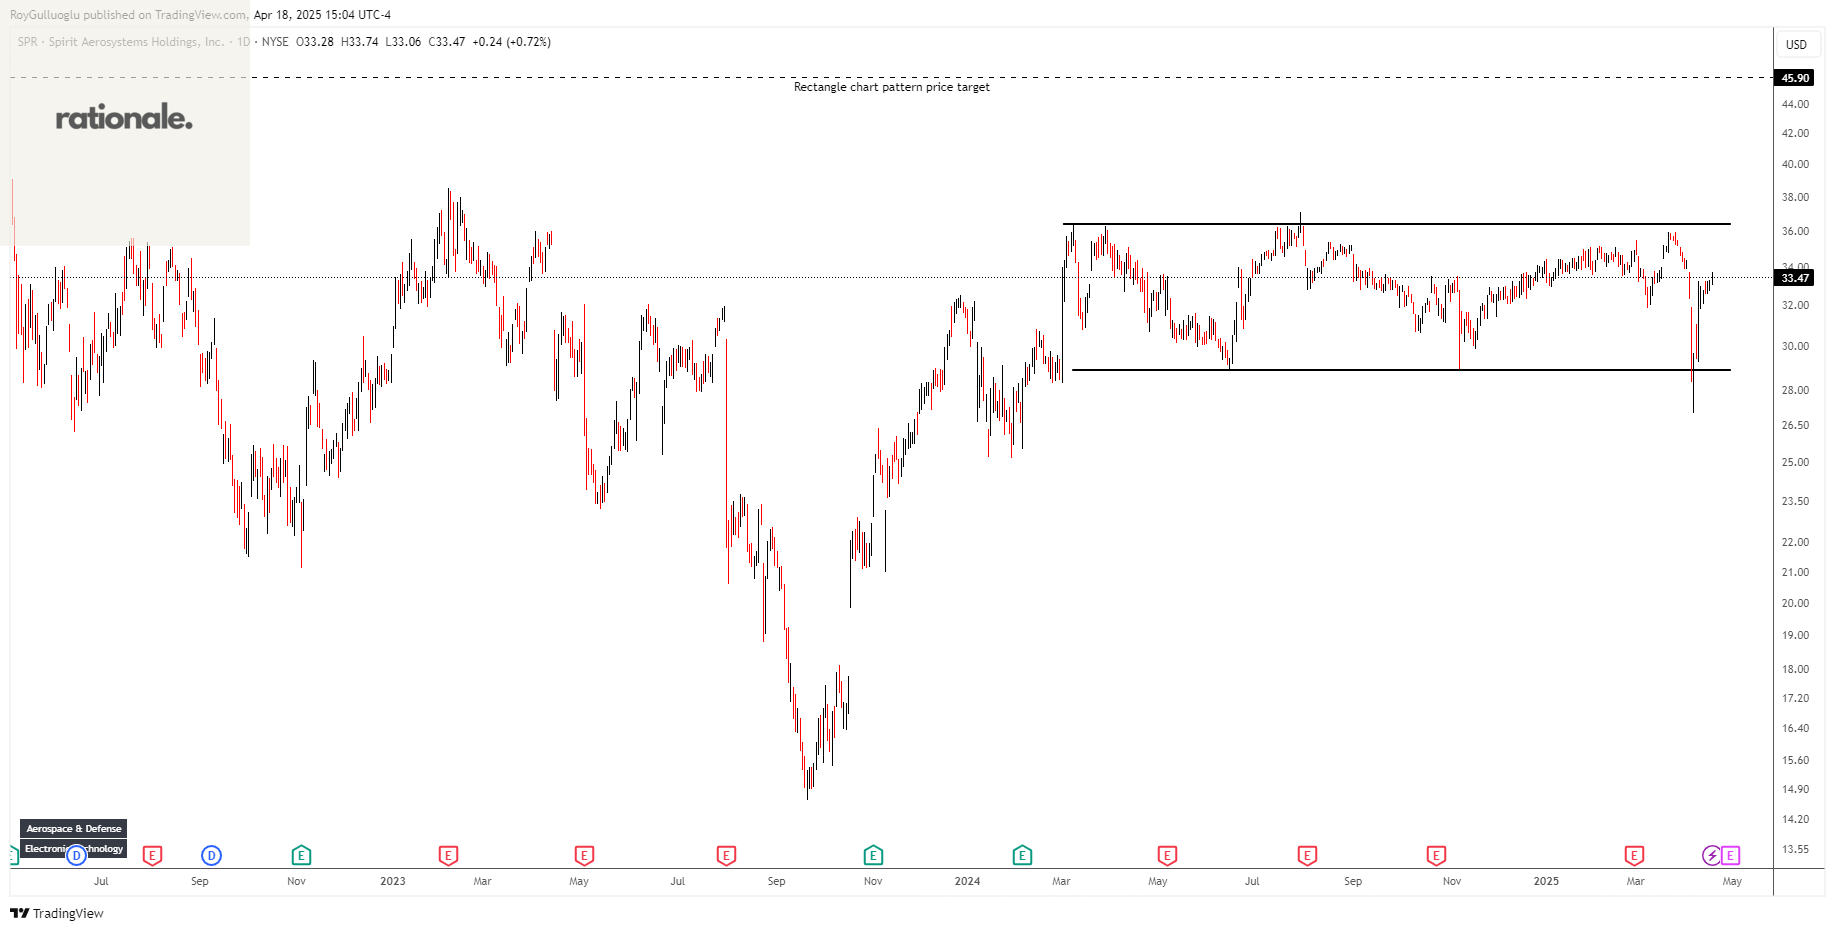
Spirit AeroSystems Holdings, Inc. engages in the design, engineering, manufacture, and marketing of commercial aerostructures worldwide.
The above daily chart formed an approximately 9-month-long rectangle chart pattern as a bullish continuation after an uptrend.
The horizontal boundary at 36.38 levels acts as a resistance within this pattern.
A daily close above 37.47 levels would validate the breakout from the 9-month-long rectangle chart pattern.
Based on this chart pattern, the potential price target is 45.9 levels.
SPR, classified under the "industrials" sector, falls under the “Mid Cap - Value” stock category.
Huntington Ingalls Industries, Inc.-(HII/NYSE)-Long Idea
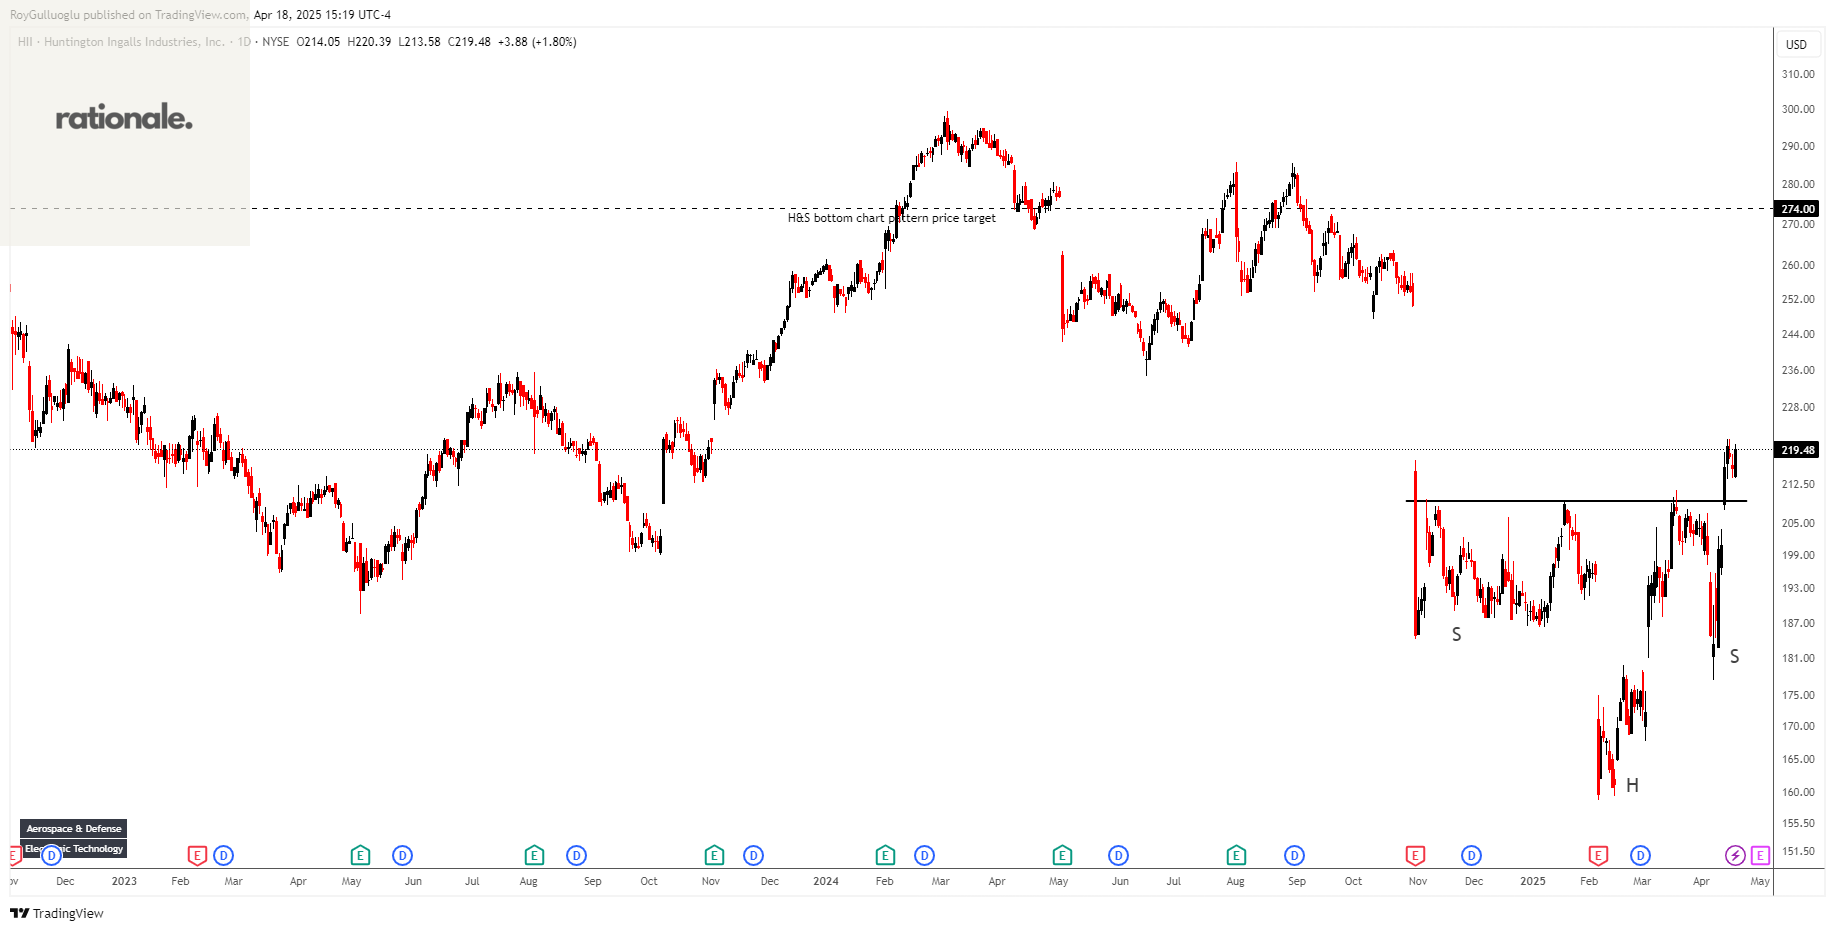
Huntington Ingalls Industries, Inc. designs, builds, overhauls, and repairs military ships in the United States
The above daily chart formed an approximately 3-month-long H&S bottom chart pattern as a bullish reversal after a downtrend.
The horizontal boundary at 209.25 levels acted as a resistance within this pattern.
A daily close above 215.53 levels validated the breakout from the 3-month-long H&S bottom chart pattern.
Based on this chart pattern, the potential price target is 274 levels.
HII, classified under the "industrials" sector, falls under the “Mid Cap - Value” stock category.
UL Solutions Inc.-(ULS/NYSE)-Long Idea
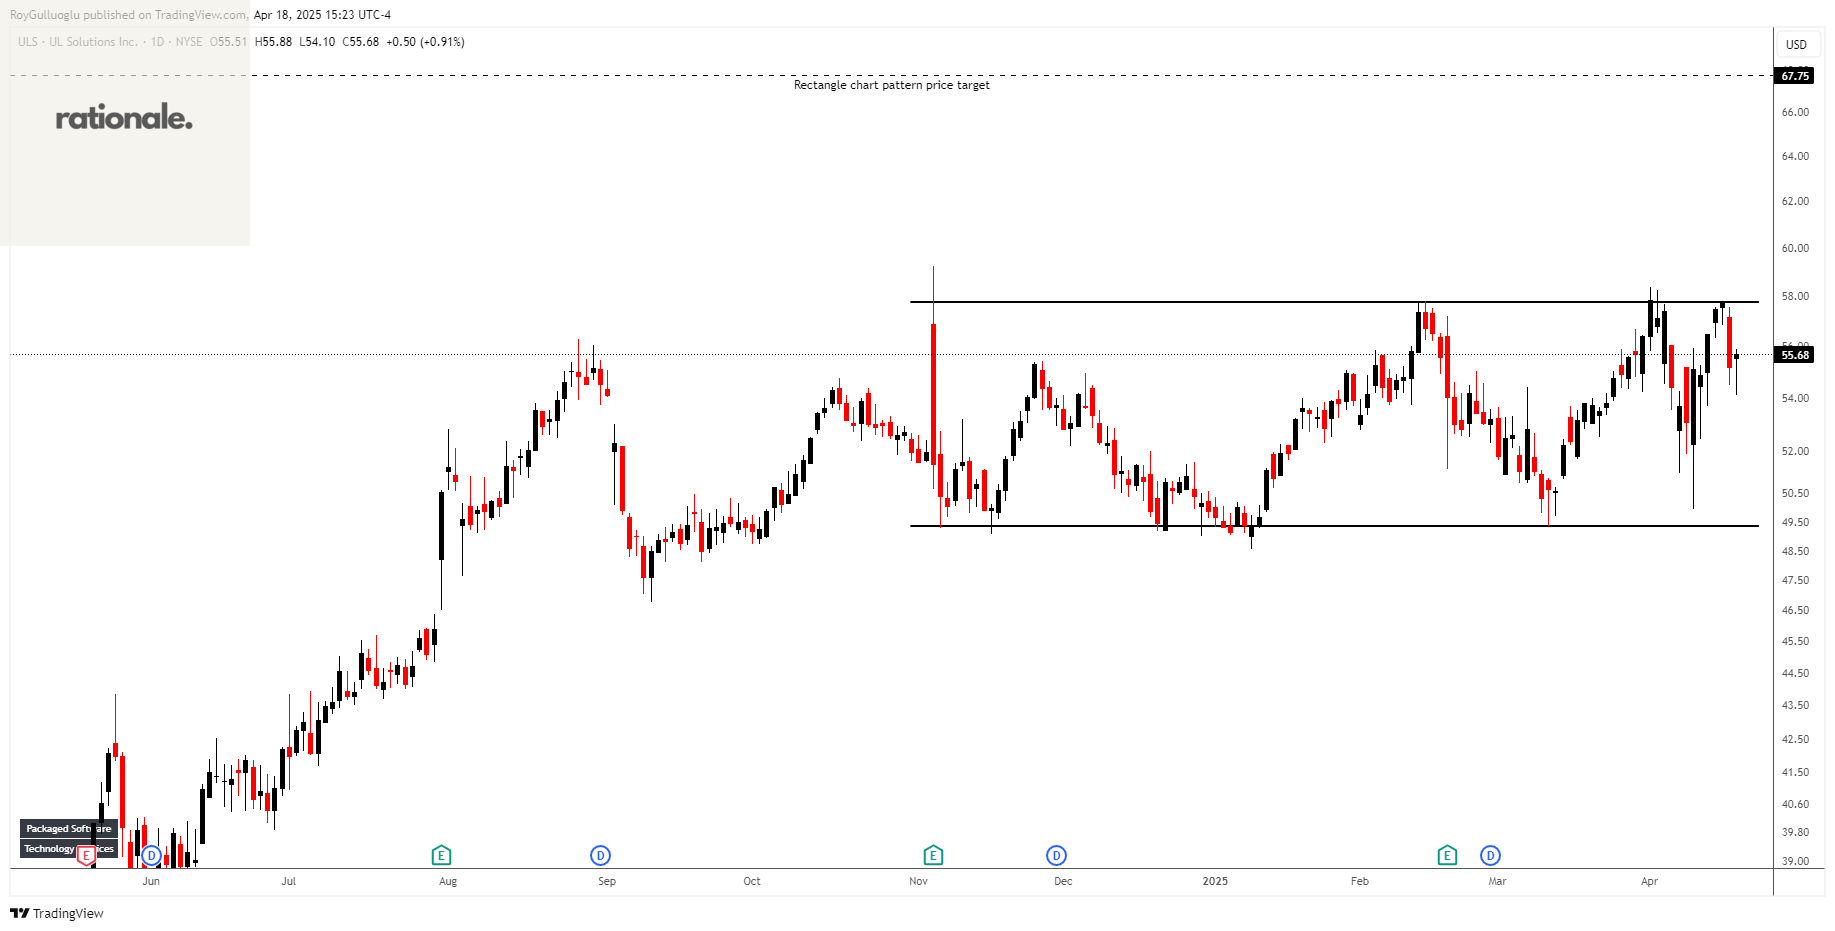
UL Solutions Inc., together with its subsidiaries, provides testing, inspection and certification, and related software and advisory services worldwide.
The above daily chart formed an approximately 3-month-long rectangle chart pattern as a bullish continuation after an uptrend.
The horizontal boundary at 57.75 levels acts as a resistance within this pattern.
A daily close above 59.48 levels would validate the breakout from the 3-month-long rectangle chart pattern.
Based on this chart pattern, the potential price target is 67.75 levels.
ULS, classified under the "industrials" sector, falls under the “Large Cap - Value” stock category.
Guidewire Software, Inc.-(GWRE/NYSE)-Long/Short Idea
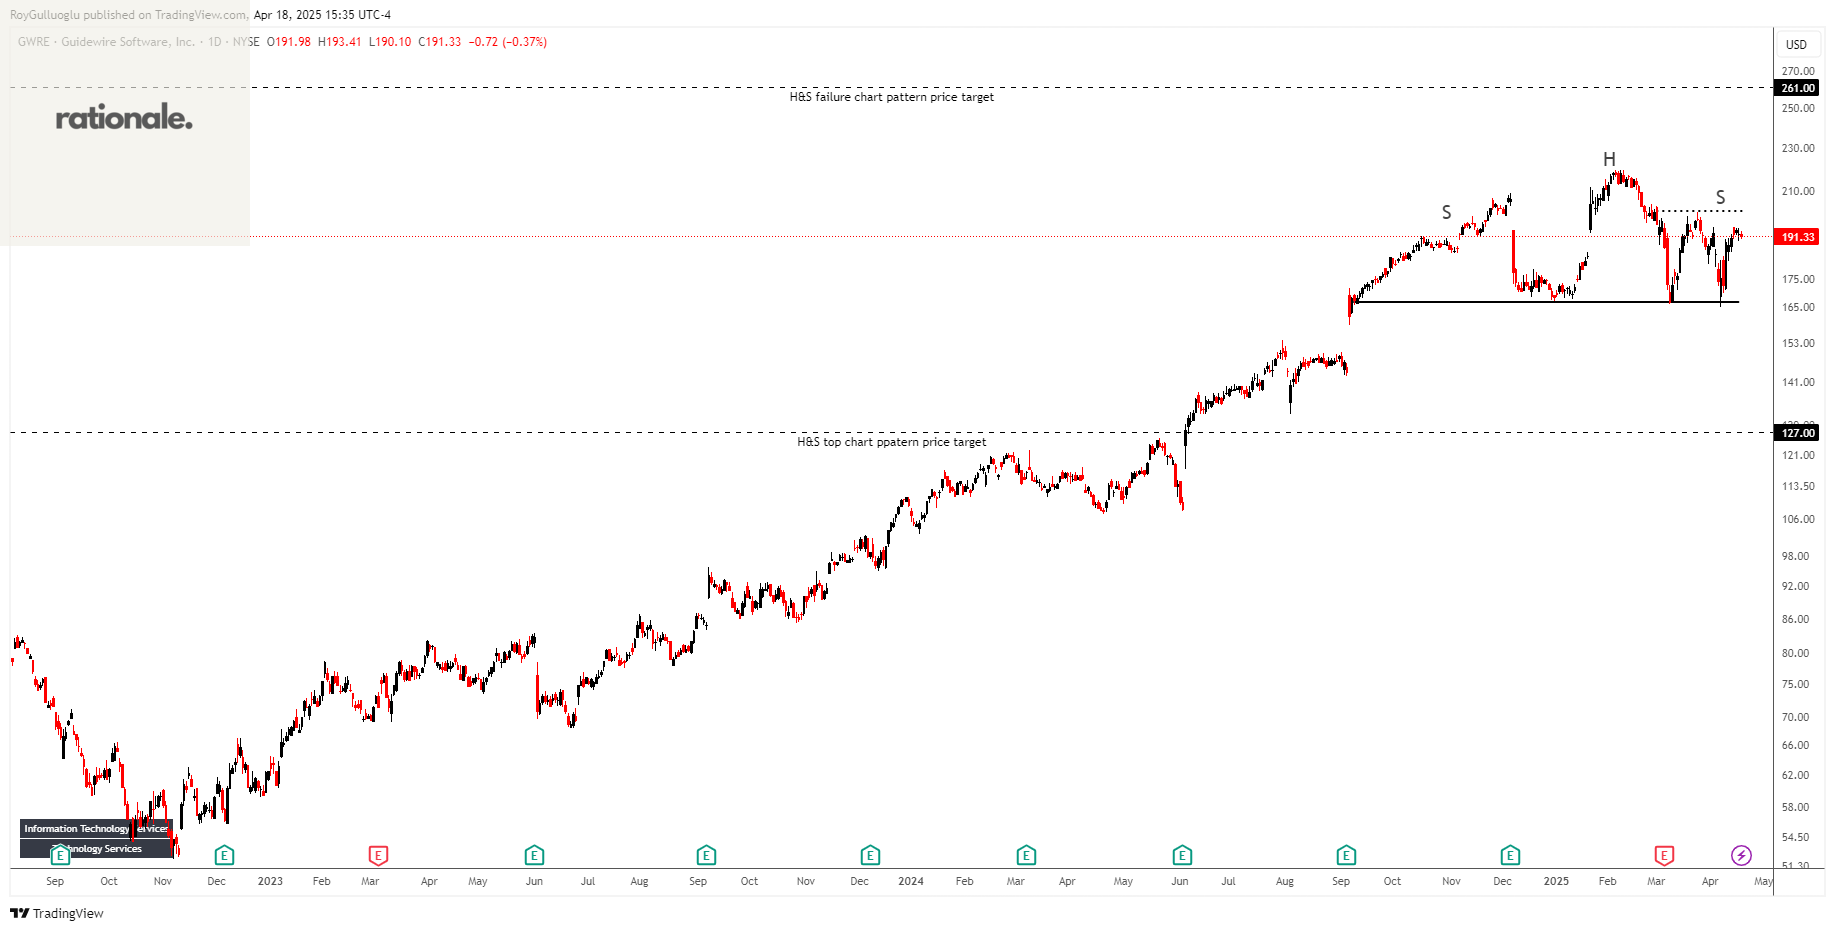
Guidewire Software, Inc. provides a platform for property and casualty (P&C) insurers worldwide.
The above daily chart formed an approximately 5-month-long H&S top chart pattern as a bearish reversal after an uptrend or it might act as a continuation and form an H&S failure chart pattern.
The horizontal boundary at 166.69 levels acts as a support within this pattern, while 201.6 levels act as a resistance.
A daily close below 161.69 levels would validate the breakdown from the 2-month-long H&S top chart pattern. A daily close above 207.65 would validate the breakout from the H&S failure chart pattern.
Based on the chart patterns, the potential price targets are 127 and 261 levels respectively.
TC Energy Corporation-(TRP/NYSE)-Long Idea
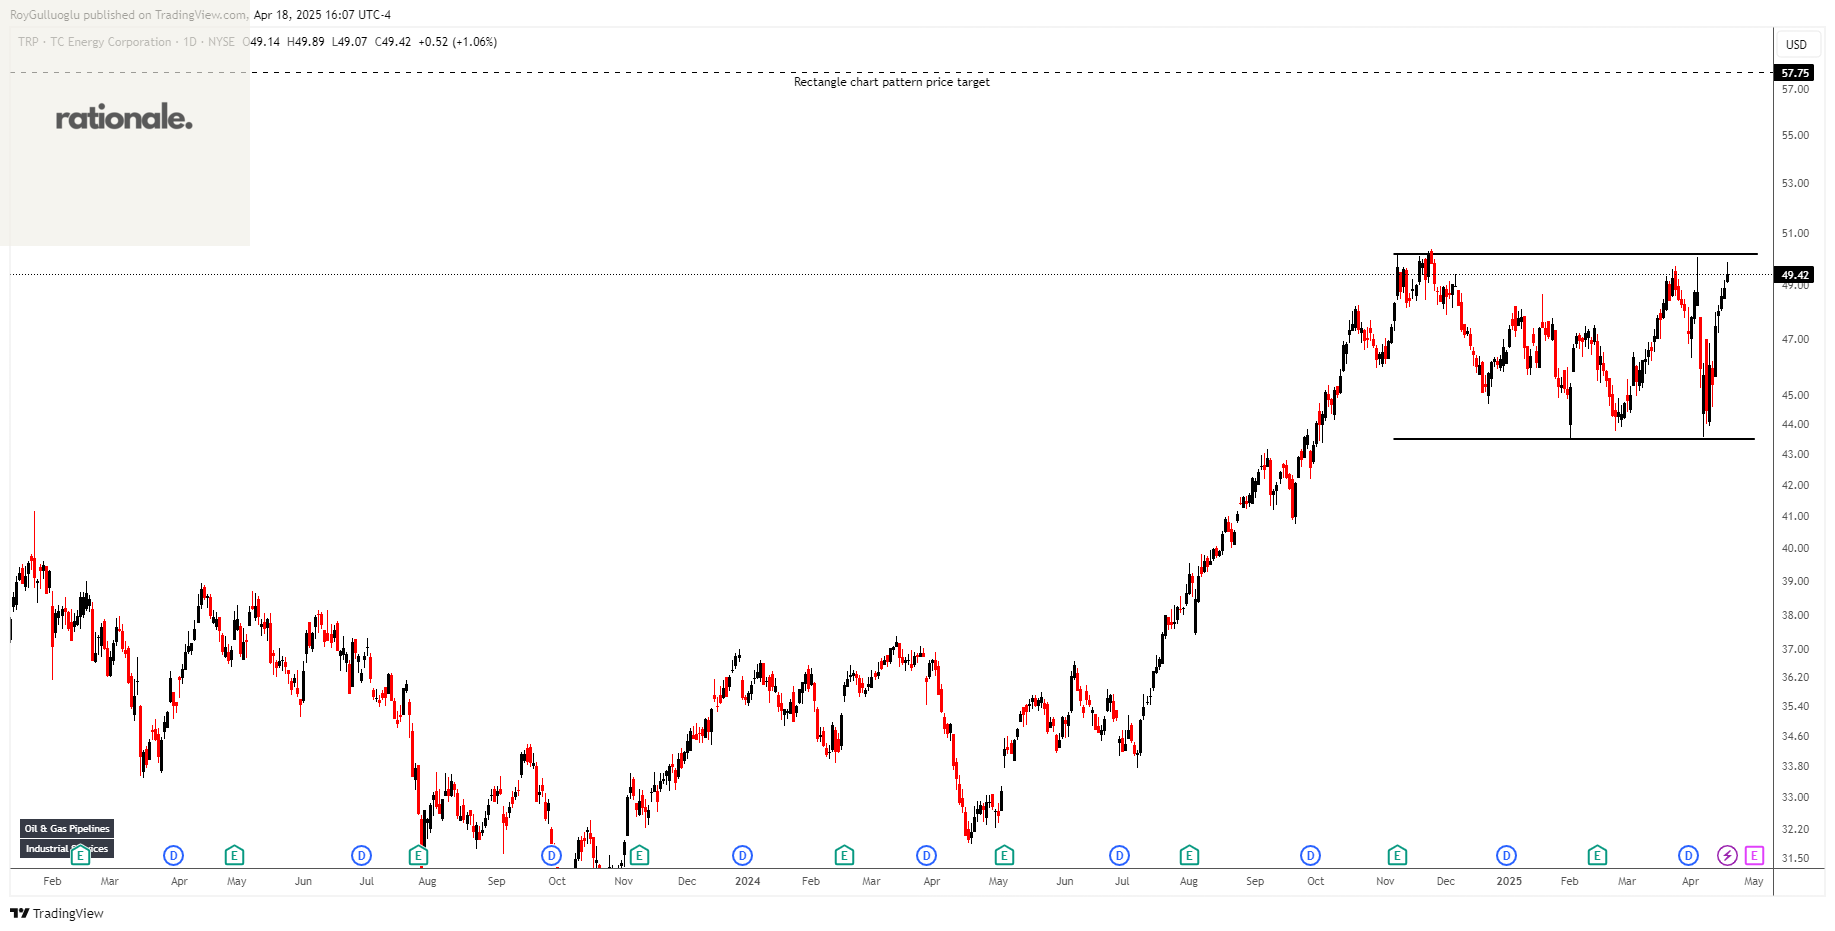
TC Energy Corporation operates as an energy infrastructure company in North America. It operates through four segments: Canadian Natural Gas Pipelines; U.S. Natural Gas Pipelines; Mexico Natural Gas Pipelines; and Power and Energy Solutions.
The above daily chart formed an approximately 4-month-long rectangle chart pattern as a bullish continuation after an uptrend.
The horizontal boundary at 50.18 levels acts as a resistance within this pattern.
A daily close above 51.68 levels would validate the breakout from the 3-month-long rectangle chart pattern.
Based on this chart pattern, the potential price target is 57.75 levels.
TRP, classified under the "energy" sector, falls under the “Large Cap - Income” stock category.
The Travelers Companies, Inc.-(TRV/NYSE)-Long Idea
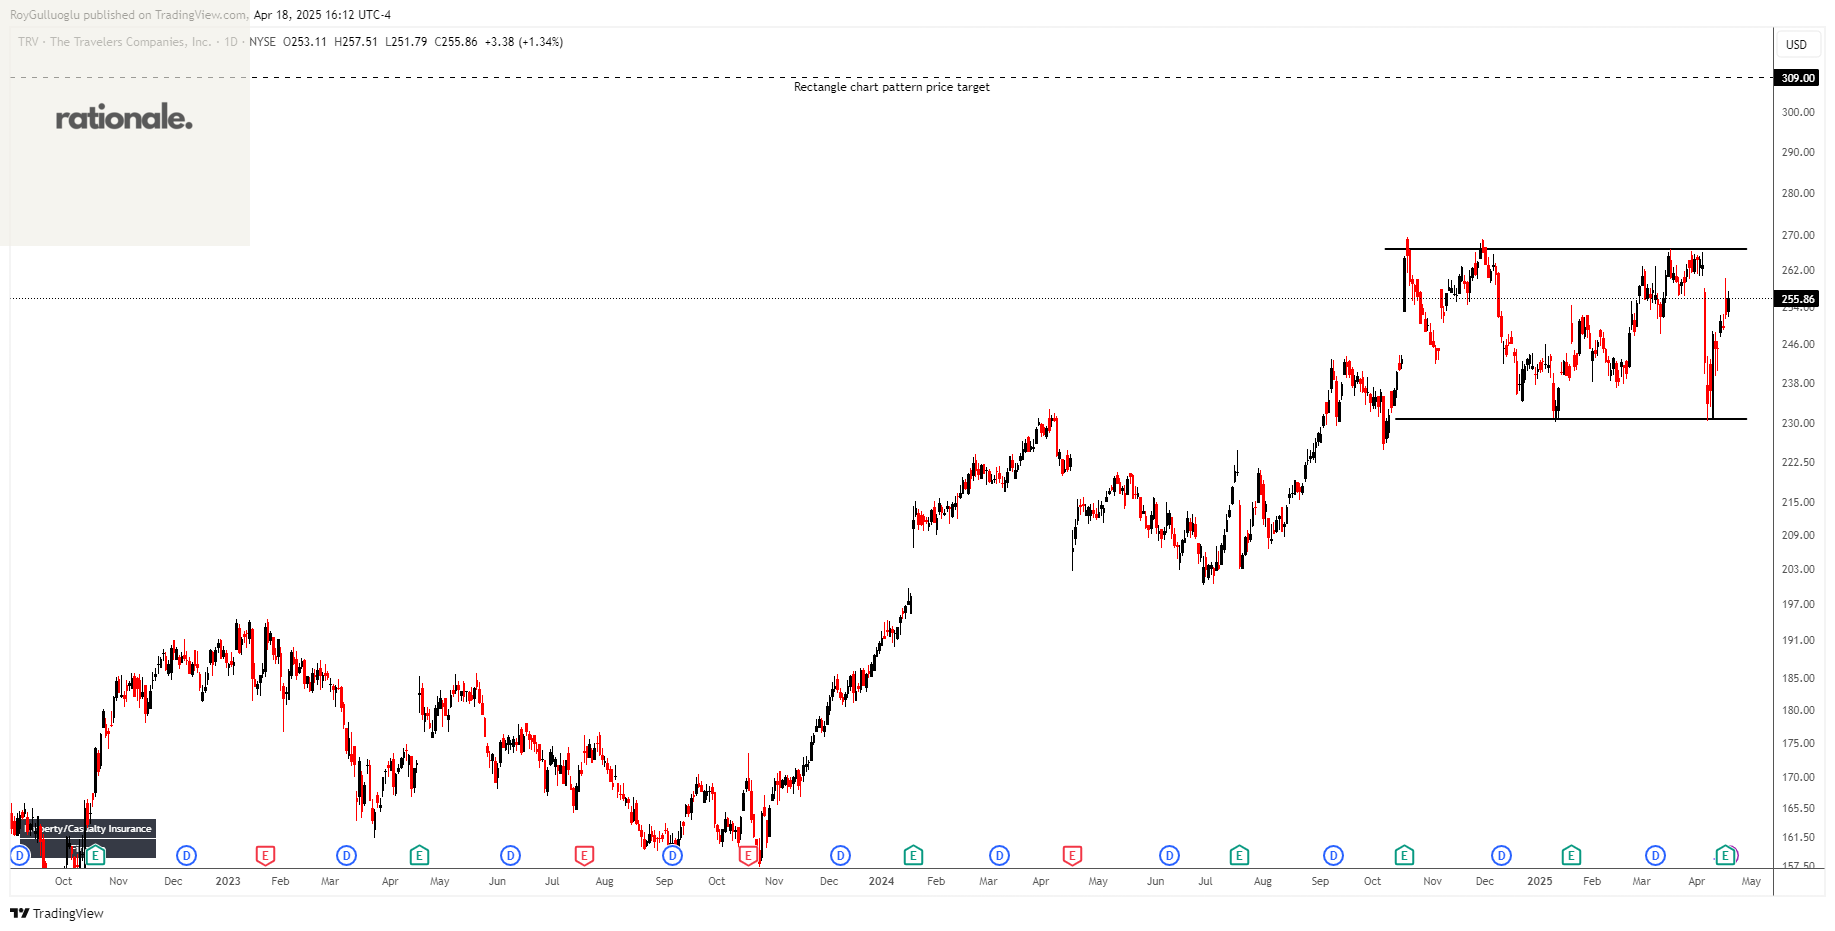
The Travelers Companies, Inc., through its subsidiaries, provides a range of commercial and personal property, and casualty insurance products and services to businesses, government units, associations, and individuals in the United States and internationally.
The above daily chart formed an approximately 4-month-long rectangle chart pattern as a bullish continuation after an uptrend.
The horizontal boundary at 266.8 levels acts as a resistance within this pattern.
A daily close above 274.8 levels would validate the breakout from the 4-month-long rectangle chart pattern.
Based on this chart pattern, the potential price target is 309 levels.
TRV, classified under the "financial services" sector, falls under the “Large Cap - Income” stock category.
Skyward Specialty Insurance Group, Inc. -(SKWD/NASDAQ)-Long Idea
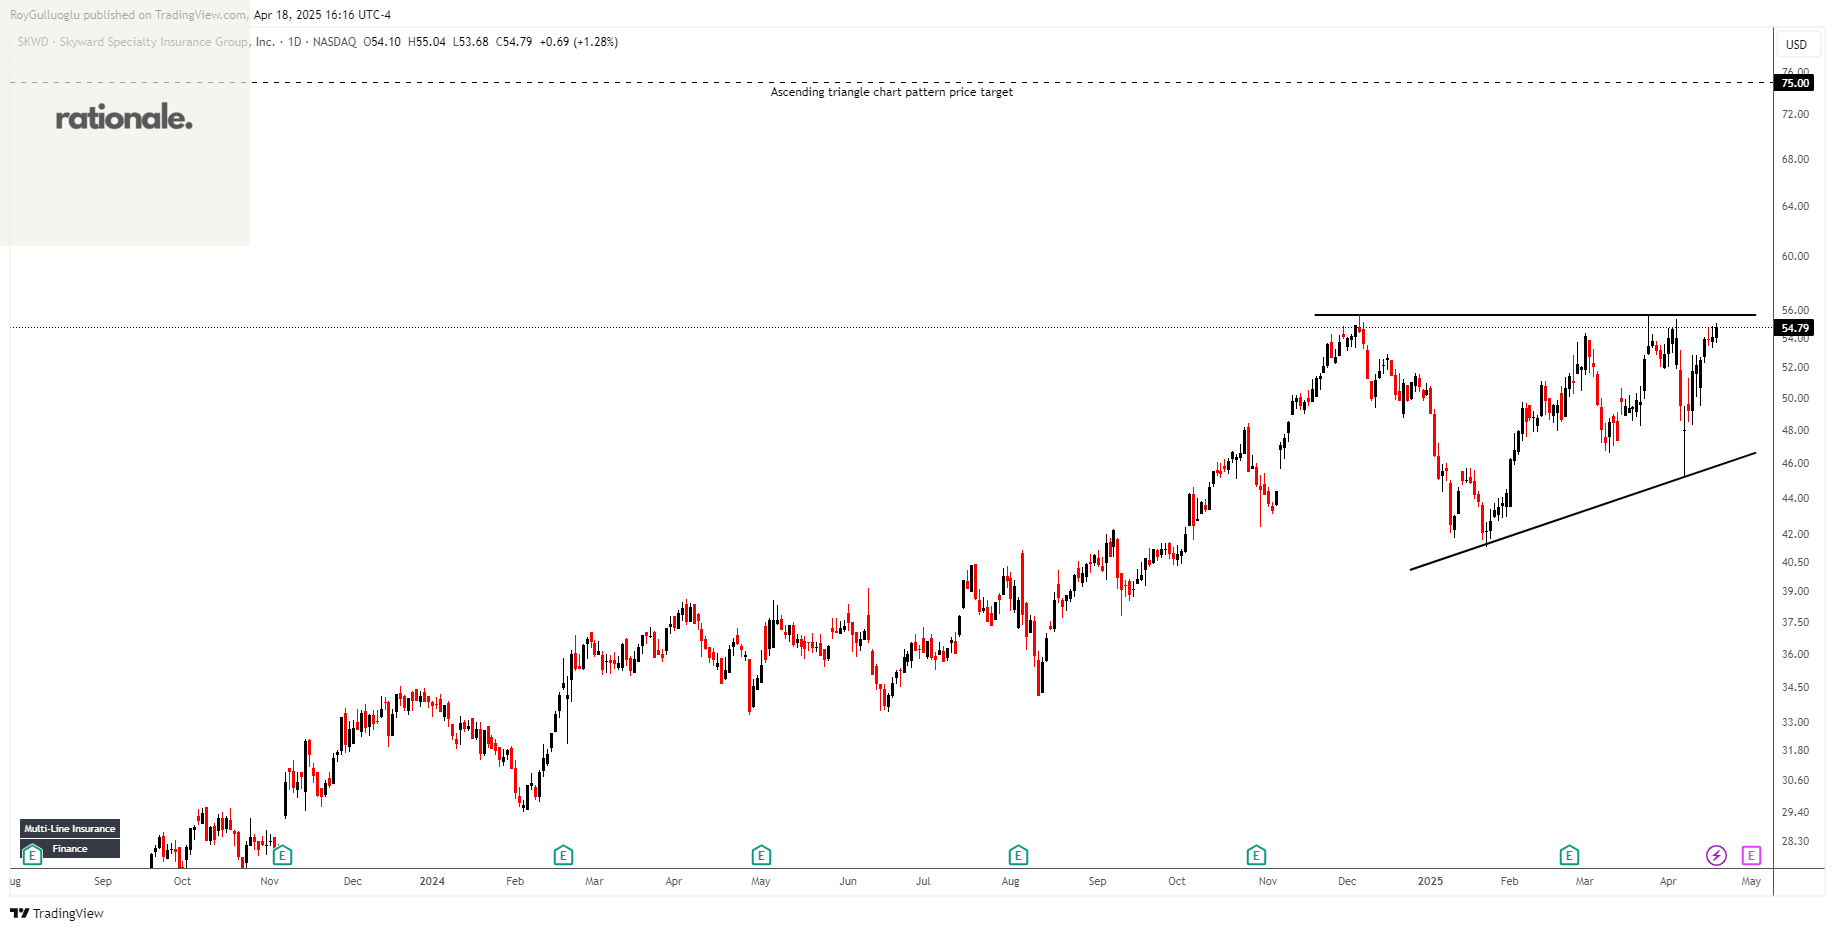
Skyward Specialty Insurance Group, Inc., an insurance holding company, underwrites commercial property and casualty insurance products in the United States.
The above daily chart formed an approximately 3-month-long ascending triangle chart pattern as a bullish continuation after an uptrend.
The horizontal boundary at 55.65 levels acts as a resistance within this pattern.
A daily close above 57.31 levels would validate the breakout from the 3-month-long ascending triangle chart pattern.
Based on this chart pattern, the potential price target is 75 levels.
SKWD, classified under the "financial services" sector, falls under the “Mid Cap - Income” stock category.
Meituan-(3690/HKEX)-Short Idea
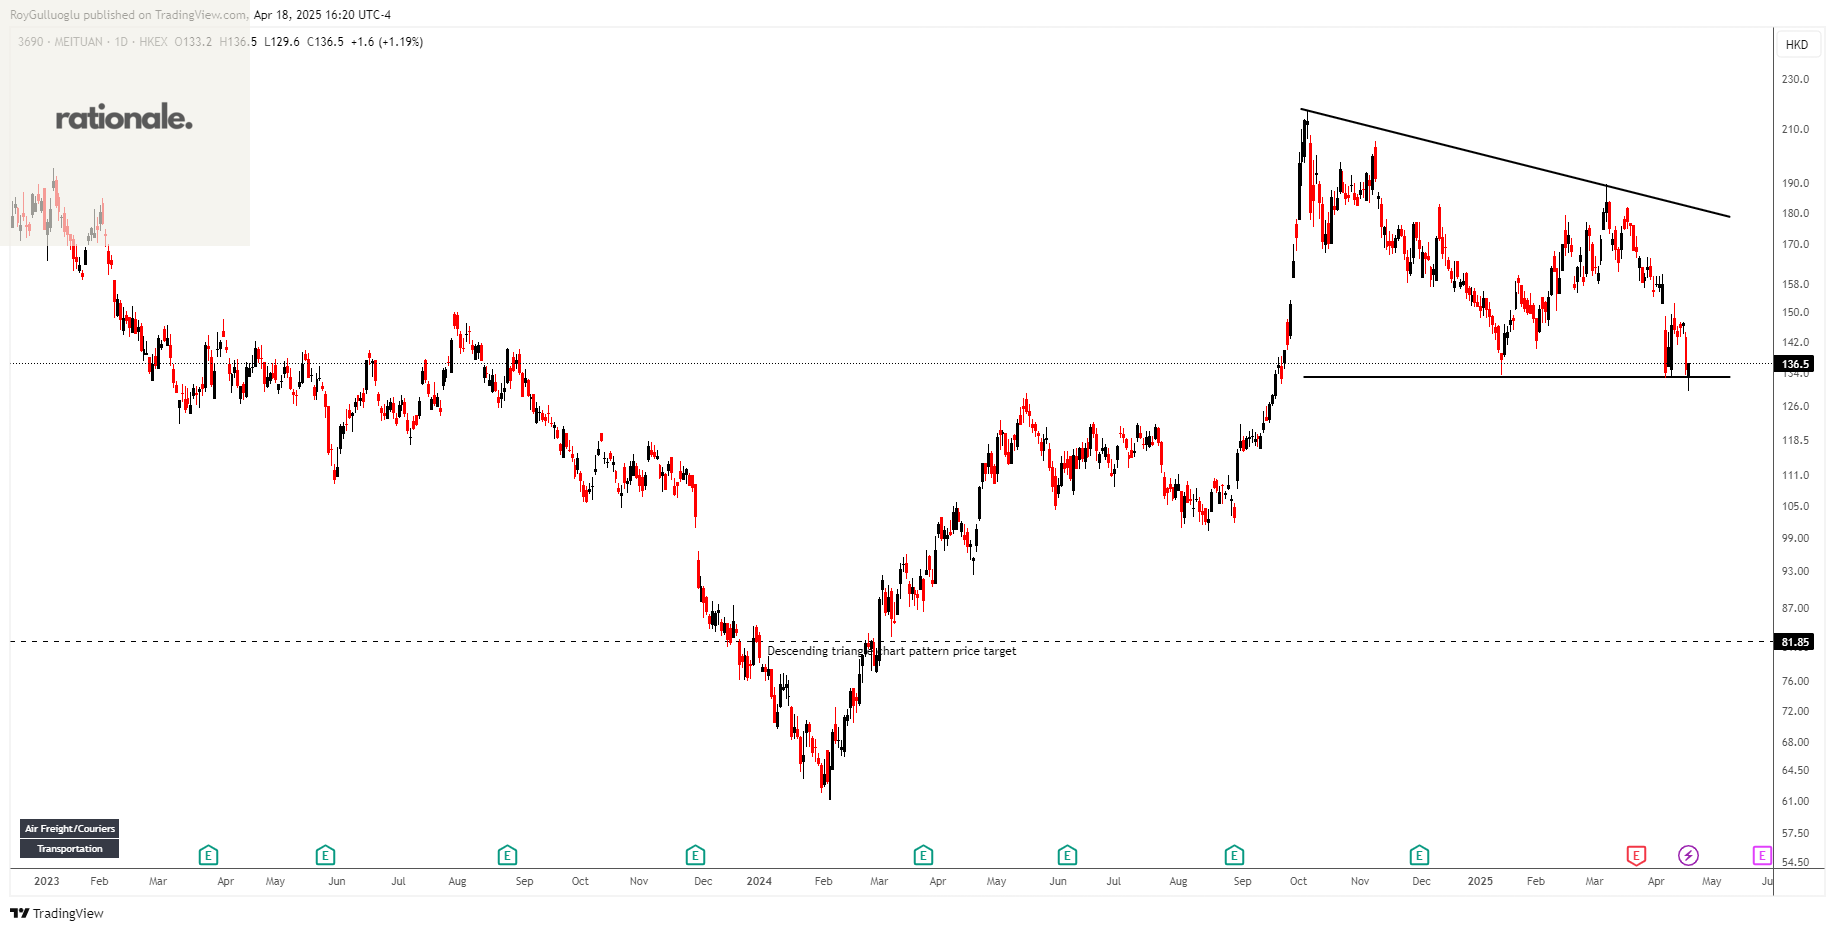
Meituan operates as a technology retail company in the People's Republic of China. It operates through Core Local Commerce and New Initiatives segments.
The above daily chart formed an approximately 4-month-long descending triangle chart pattern as a bearish reversal after an uptrend.
The horizontal boundary at 133.1 levels acts as a support within this pattern.
A daily close below 129.1 levels would validate the breakout from the 4-month-long descending triangle chart pattern.
Based on this chart pattern, the potential price target is 81.85 levels.
3690, classified under the "consumer cyclicals" sector, falls under the “Large Cap - Growth” stock category.