


Healthcare Services Group, Inc.-(HCSG/NASDAQ)-Long Idea
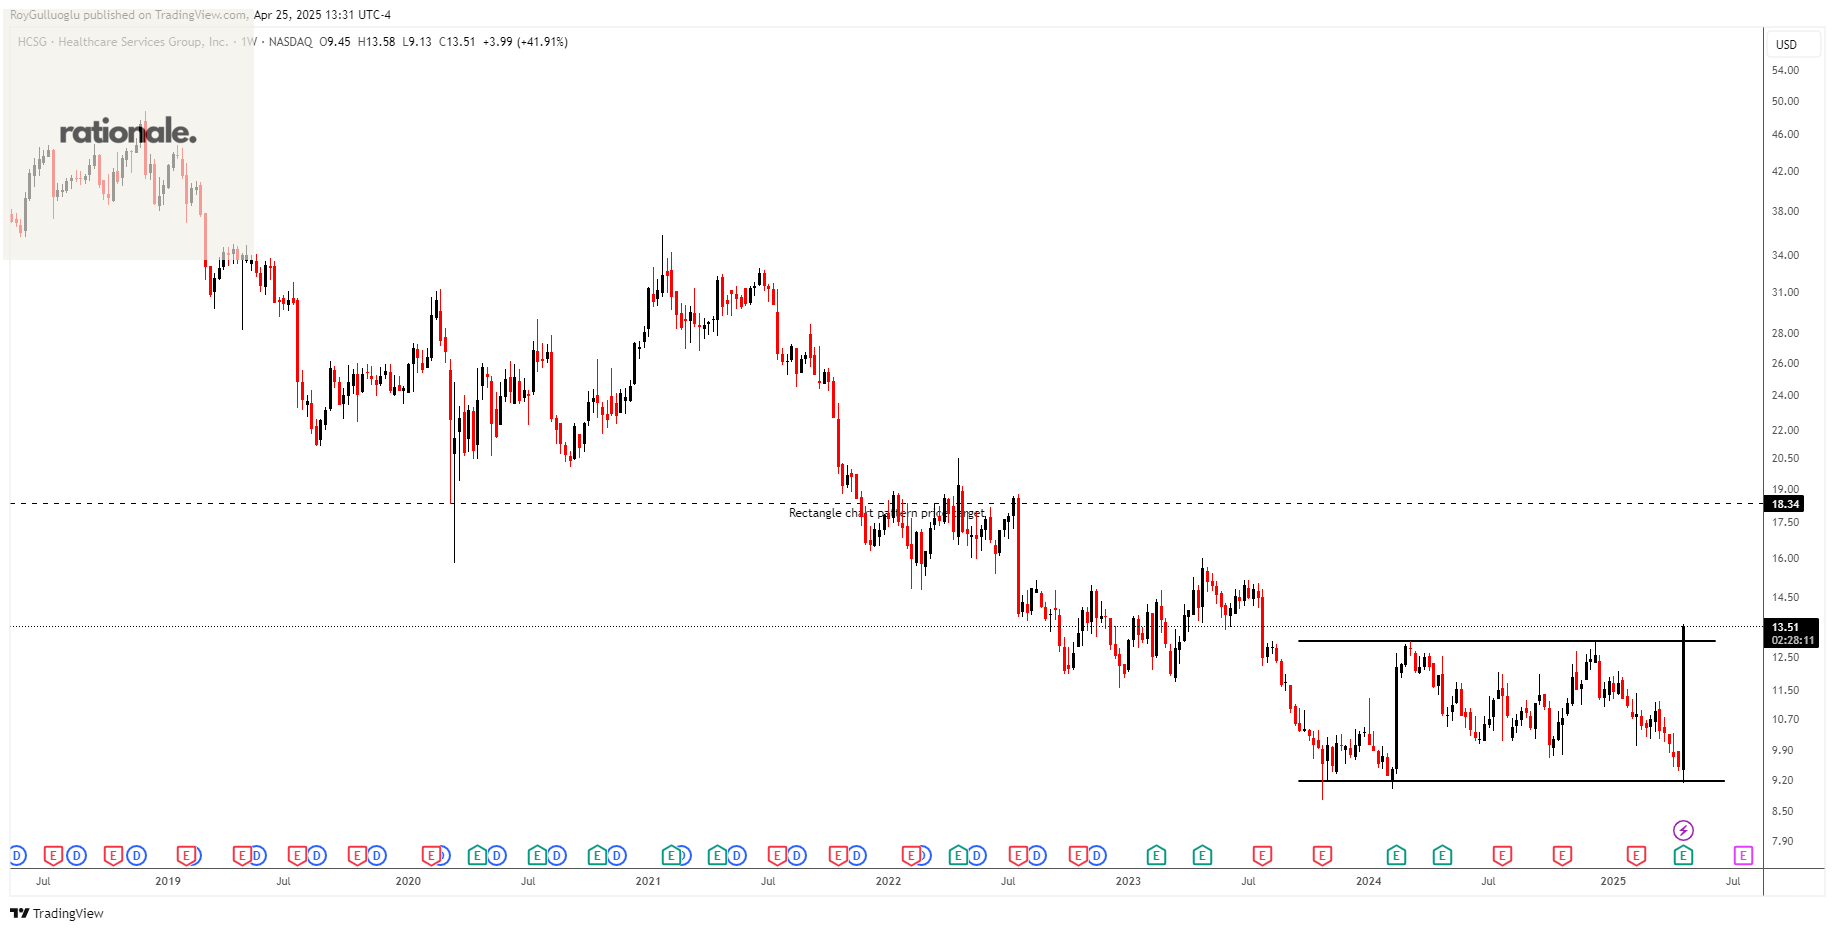
Healthcare Services Group, Inc. provides management, administrative, and operating services to the housekeeping, laundry, linen, facility maintenance, and dietary service departments of nursing homes, retirement complexes, rehabilitation centers, and hospitals in the United States.
The above daily chart formed an approximately 20-month-long rectangle chart pattern as a bullish reversal after a downtrend.
The horizontal boundary at 13 levels acts as a resistance within this pattern.
A daily close above 13.39 levels would validate the breakout from the 20-month-long rectangle chart pattern.
Based on this chart pattern, the potential price target is 18.34 levels.
HCSG, classified under the "healthcare" sector, falls under the “Small Cap - Value” stock category.
Edwards Lifesciences Corporation-(EW/NYSE)-Long Idea
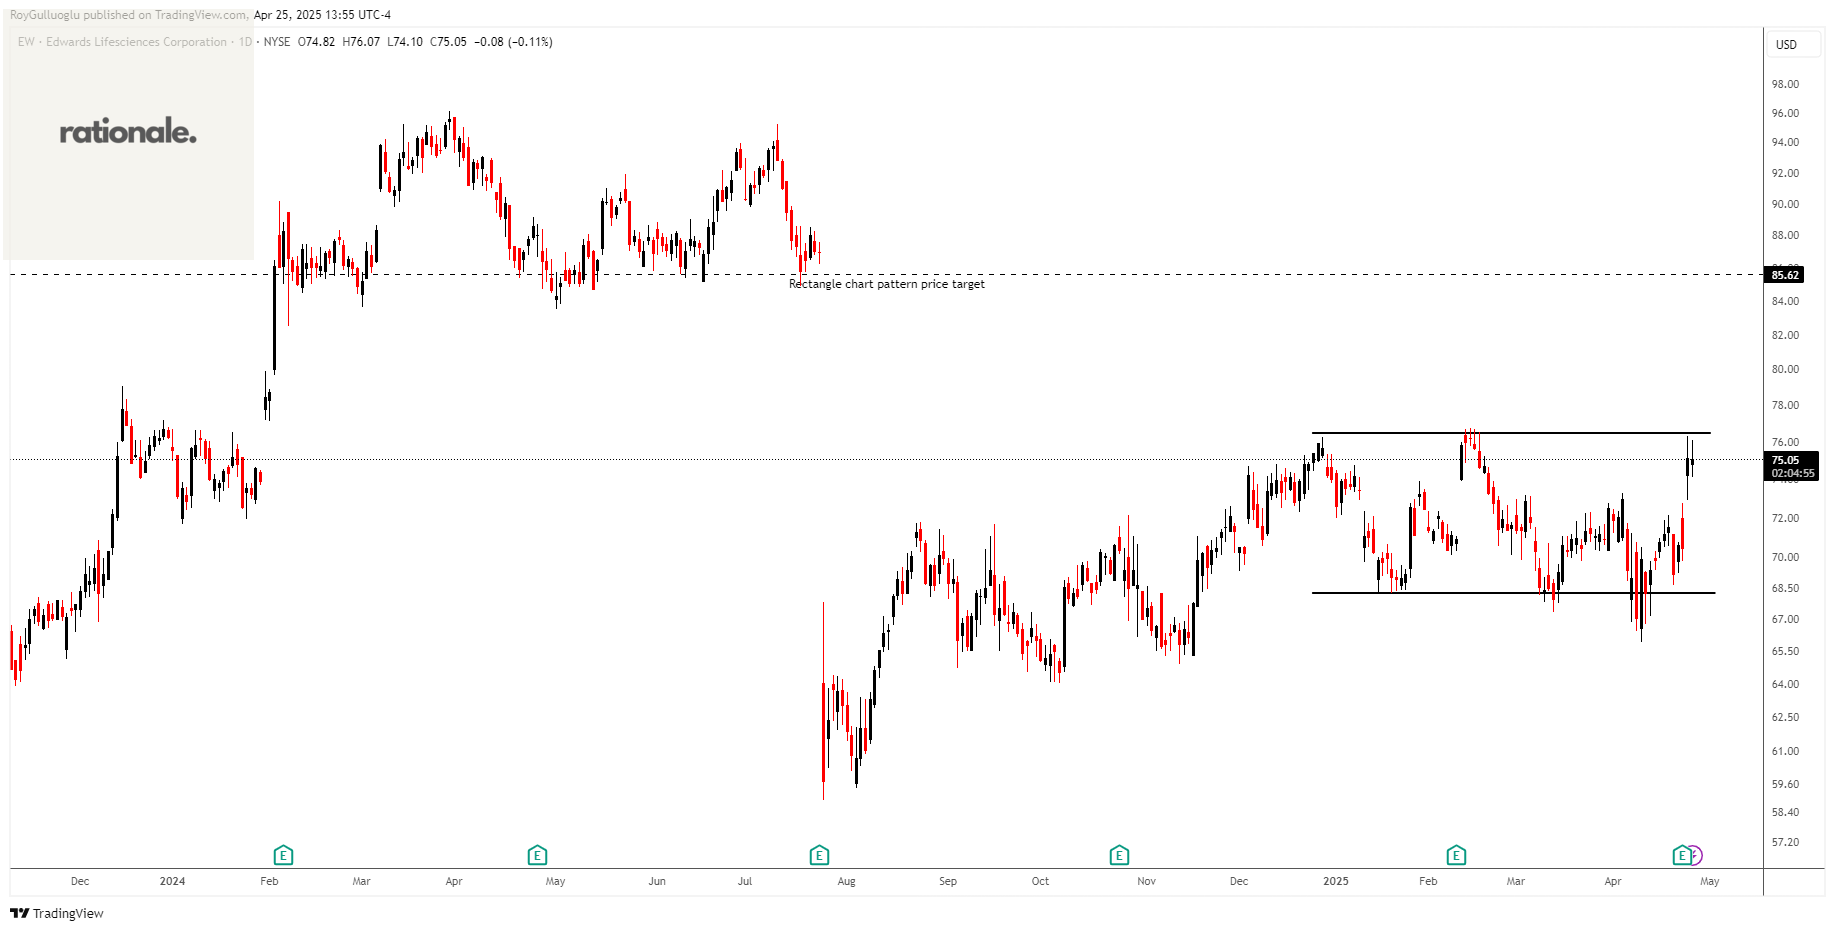
Edwards Lifesciences Corporation provides products and technologies to treat advanced cardiovascular diseases in the United States, Europe, Japan, and internationally.
The above daily chart formed an approximately 3-month-long rectangle chart pattern as a bullish continuation after an uptrend.
The horizontal boundary at 76.46 levels acts as a resistance within this pattern.
A daily close above 78.75 levels would validate the breakout from the 3-month-long rectangle chart pattern.
Based on this chart pattern, the potential price target is 85.62 levels.
EW, classified under the "healthcare" sector, falls under the “Large Cap-Value” stock category.
Itron, Inc.-(ITRI/NASDAQ)-Long Idea
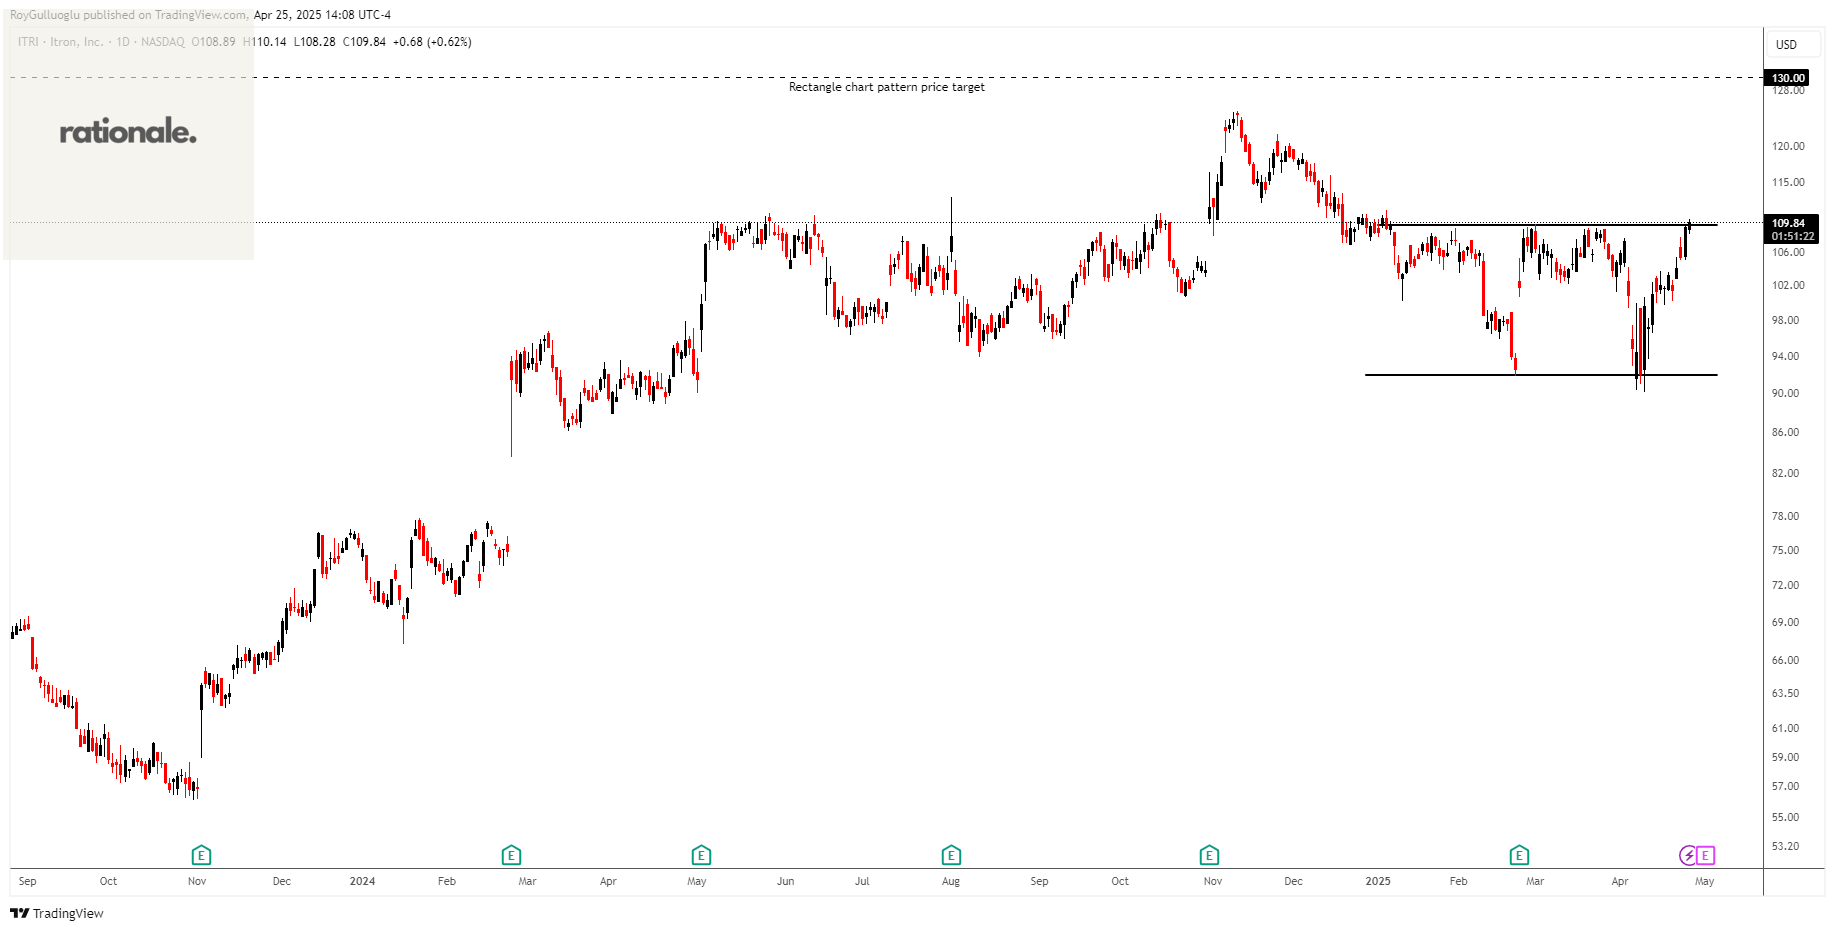
Itron, Inc., a technology, solutions, and service company, provides end-to-end solutions that help manage energy, water, and smart city operations worldwide.
The above daily chart formed an approximately 3-month-long rectangle chart pattern as a bullish reversal after a downtrend.
The horizontal boundary at 109.4 levels acts as a resistance within this pattern.
A daily close above 112.68 levels would validate the breakout from the 3-month-long rectangle chart pattern.
Based on this chart pattern, the potential price target is 130 levels.
ITRI, classified under the "technology" sector, falls under the “Mid Cap - Growth” stock category.
Caixa Seguridade Participações S.A.-(CXSE3/BOVESPA)-Long Idea
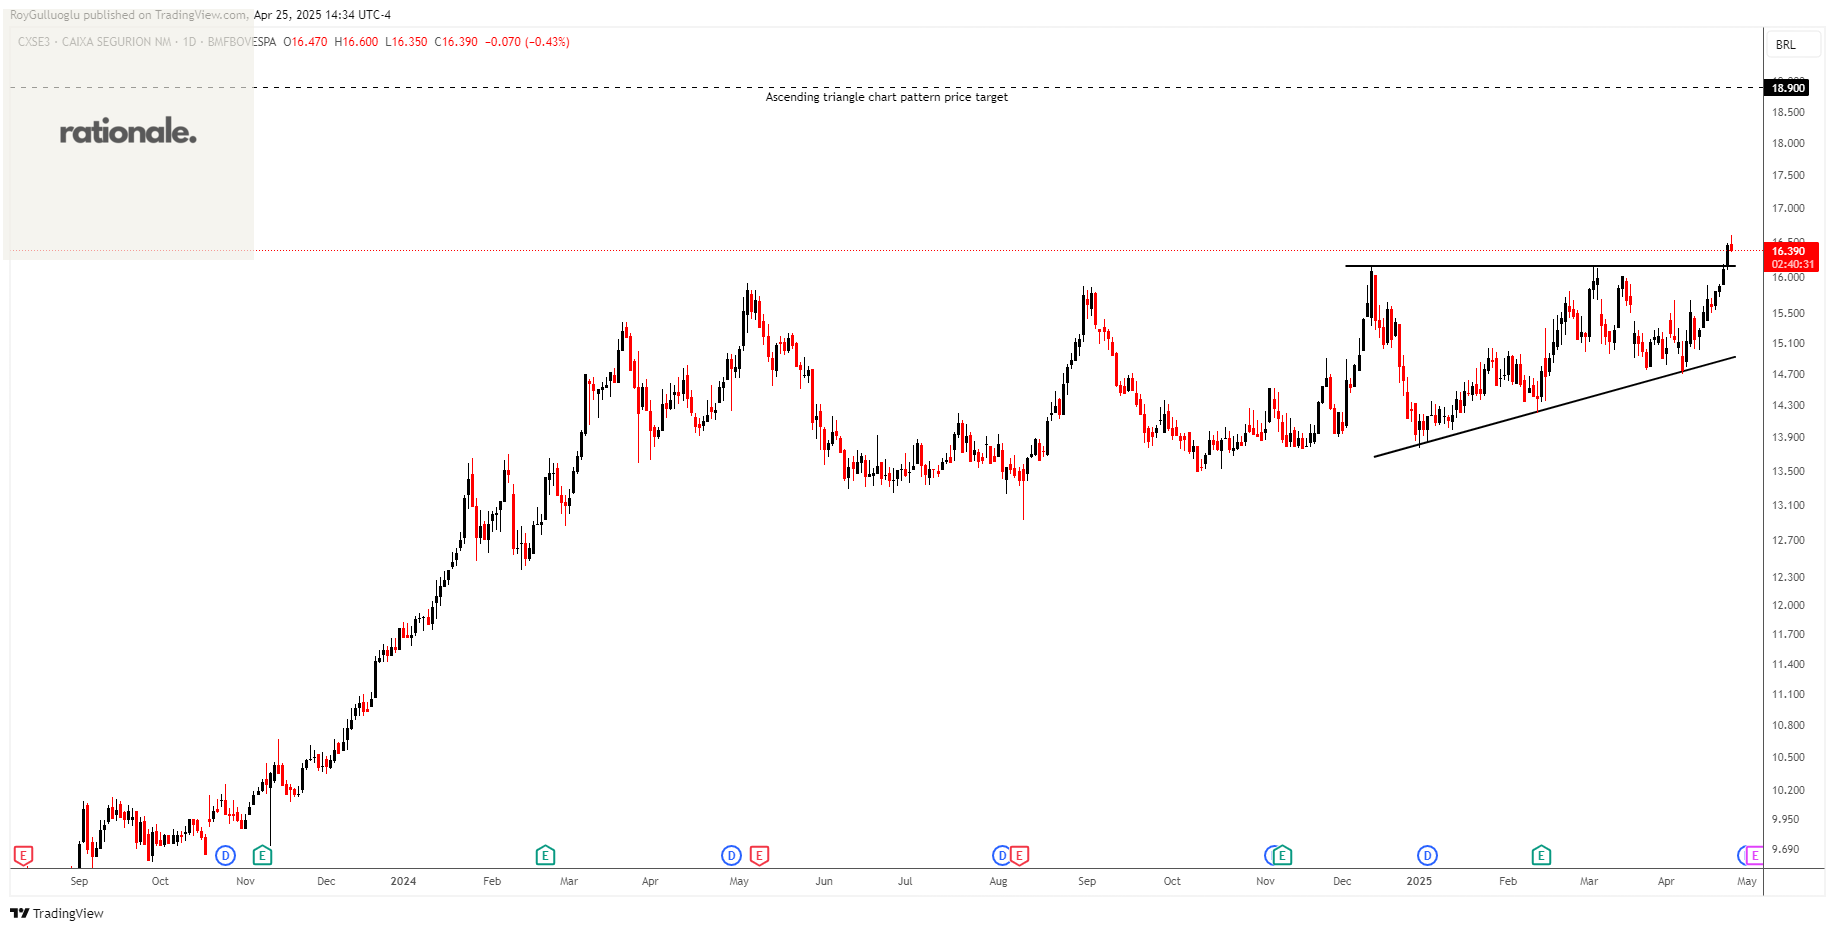
Caixa Seguridade Participações S.A. provides various life and non-life insurance products in Brazil.
The above daily chart formed an approximately 3-month-long ascending triangle chart pattern as a bullish continuation after an uptrend.
The horizontal boundary at 16.149 levels acts as a resistance within this pattern.
A daily close above 16.63 levels would validate the breakout from the 3-month-long rectangle chart pattern.
Based on this chart pattern, the potential price target is 18.9 levels.
CXSE3, classified under the "technology" sector, falls under the “Mid Cap-Growth” stock category.
Türk Telekomünikasyon Anonim Sirketi-(TTKOM/BIST)-Long Idea
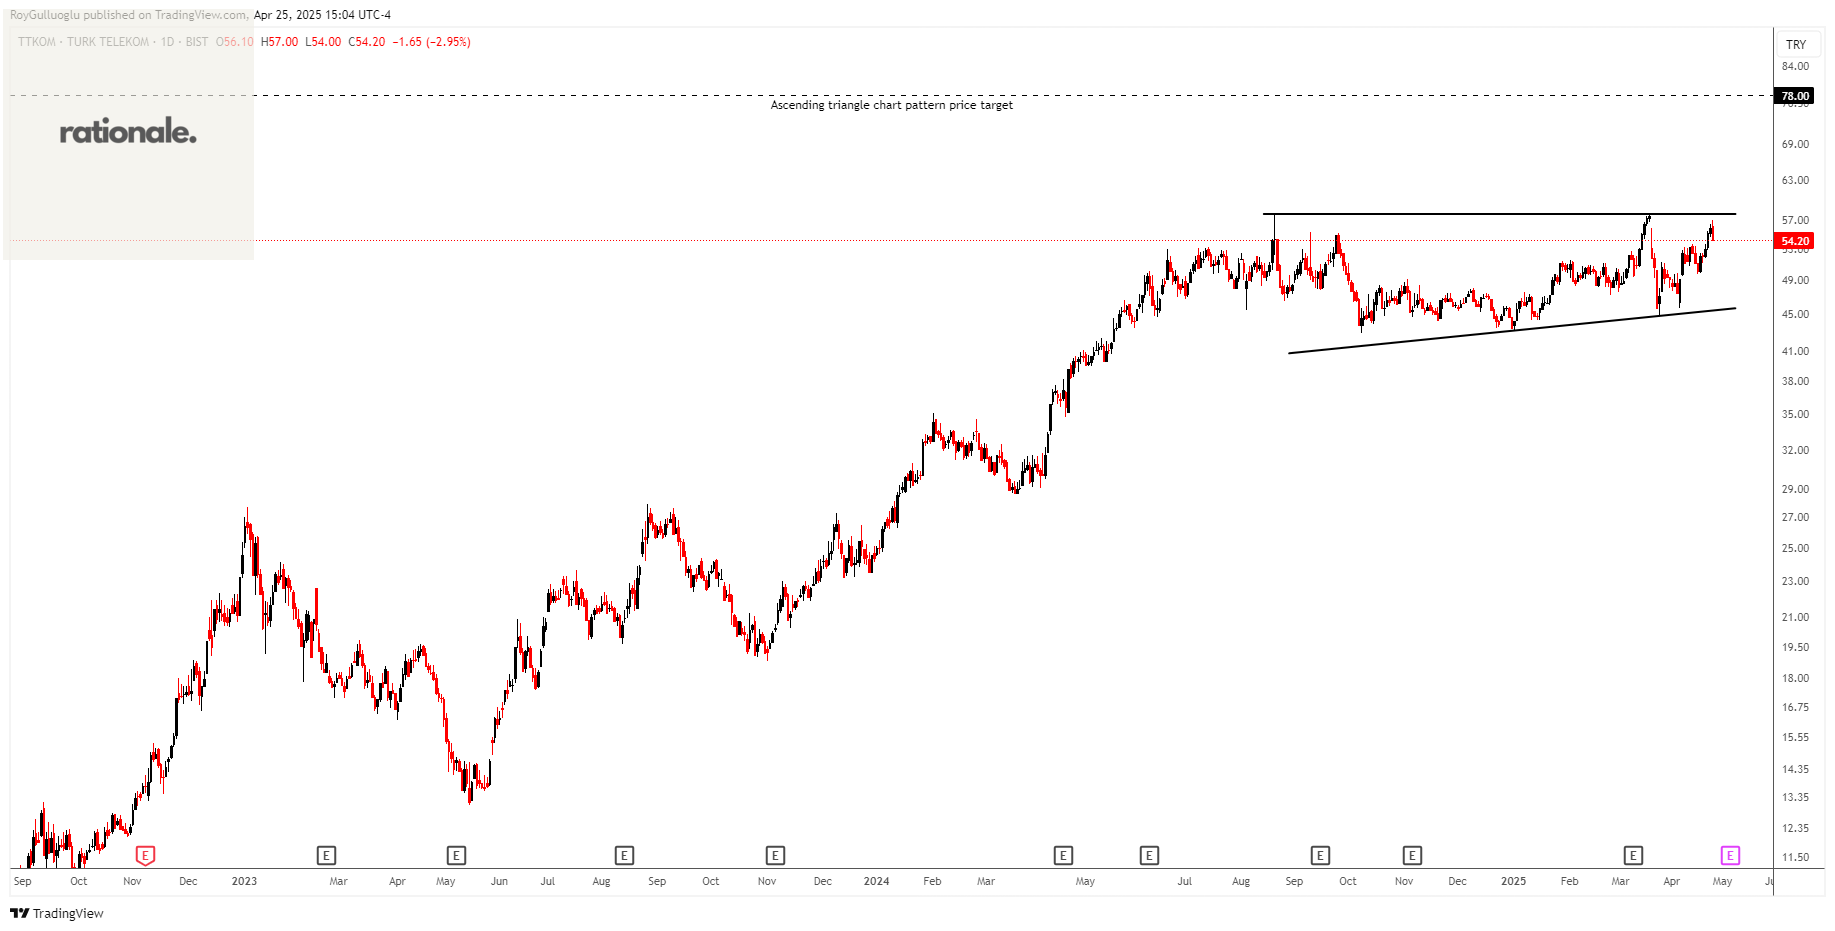
Türk Telekomünikasyon Anonim Şirketi, together with its subsidiaries, operates as an integrated telecommunication company in Turkey.
The above daily chart formed an approximately 6-month-long ascending triangle chart pattern as a bullish continuation after an uptrend.
The horizontal boundary at 57.85 levels acts as a resistance within this pattern.
A daily close above 59.58 levels would validate the breakout from the 6-month-long ascending triangle chart pattern.
Based on this chart pattern, the potential price target is 78 levels.
Teşekkürler Roy