

Trade Ideas Equities
VIRT(NASDAQ), MGEE(NASDAQ), XEL(NASDAQ), GWO(TSX), REM(JSE), NPH(JSE)

Virtu Financial, Inc.-(VIRT/NASDAQ)-Long Idea
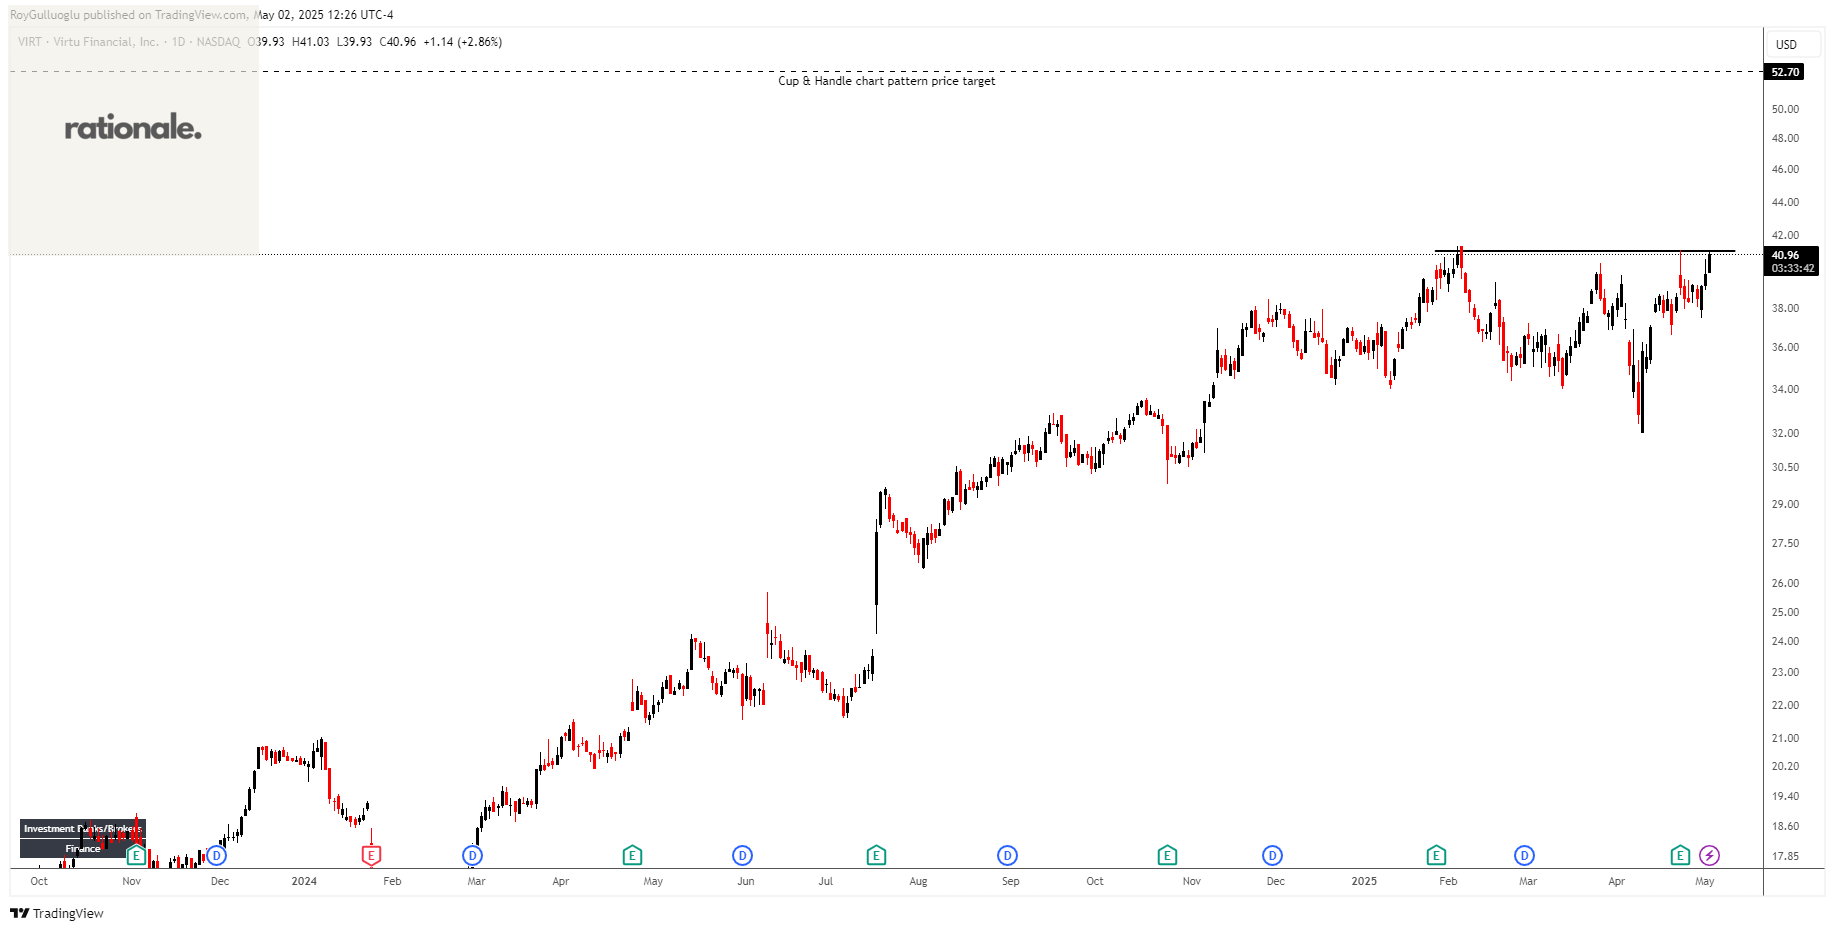
Virtu Financial, Inc. operates as a financial services company in the United States, Ireland, and internationally.
The above daily chart formed an approximately 2-month-long cup & handle chart pattern as a bullish continuation after an uptrend.
The horizontal boundary at 41.1 levels acts as a resistance within this pattern.
A daily close above 42.3 levels would validate the breakout from the 2-month-long cup & handle chart pattern.
Based on this chart pattern, the potential price target is 52.7 levels.
VIRT, classified under the "financial services" sector, falls under the “Mid Cap - Income” stock category.
MGE Energy, Inc.-(MGEE/NASDAQ)-Long Idea
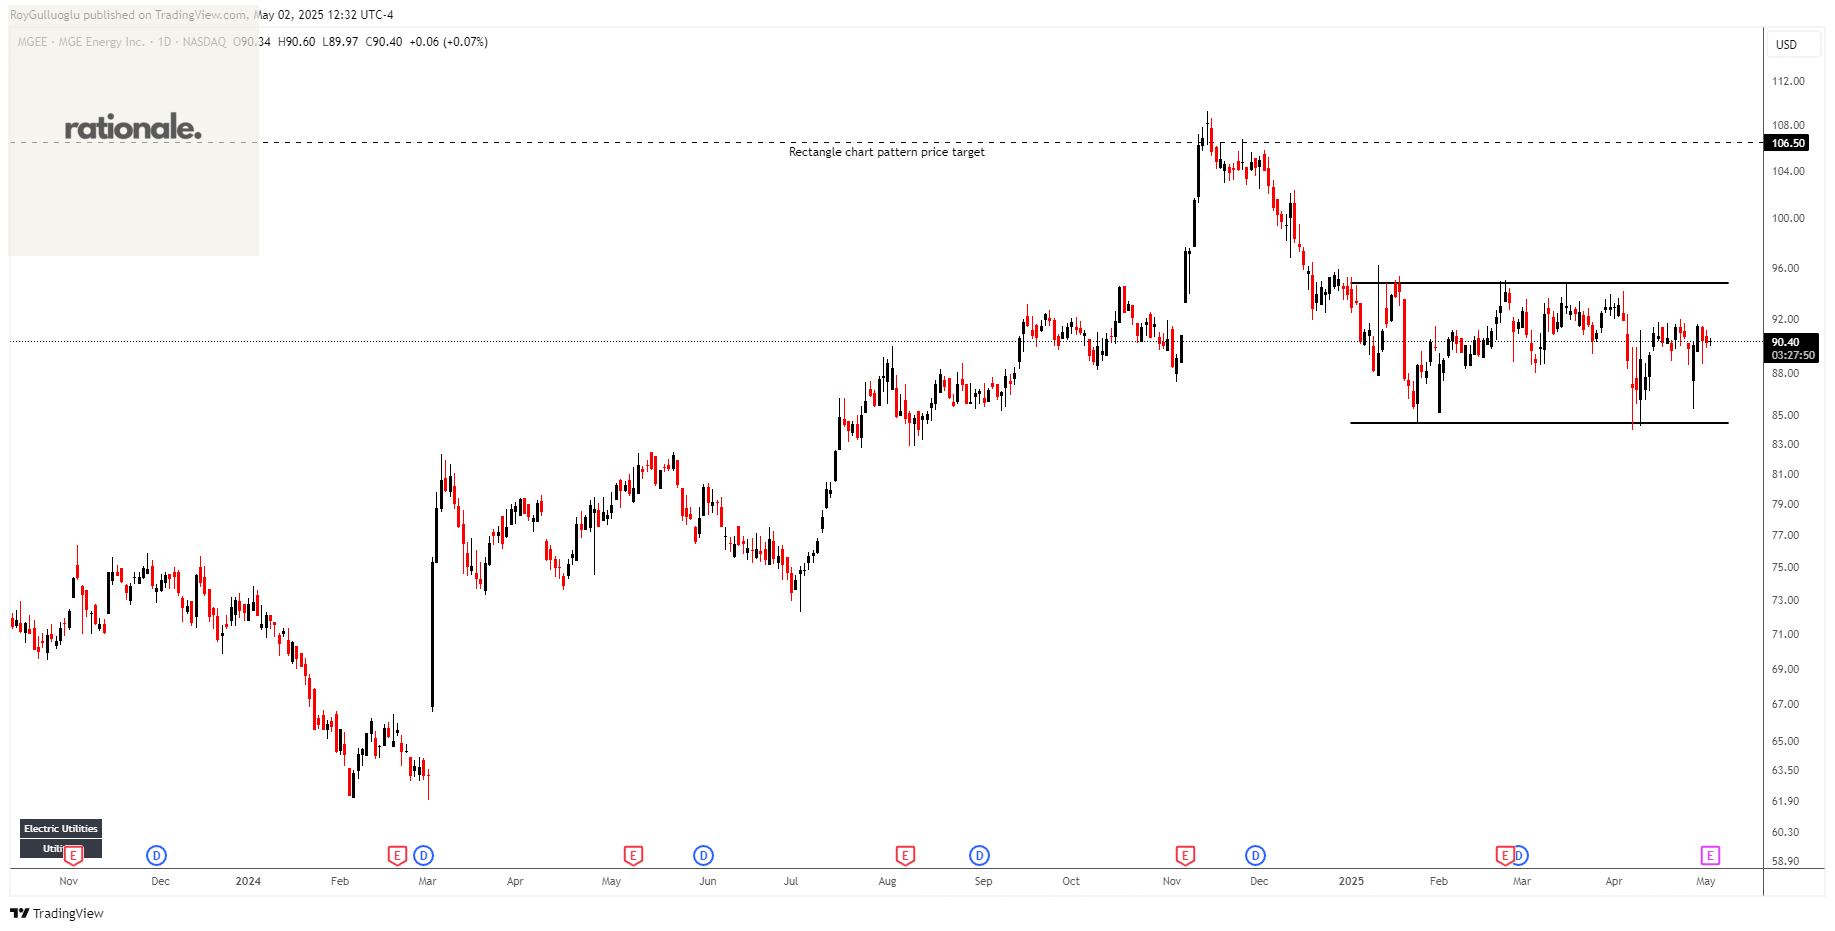
MGE Energy, Inc., through its subsidiaries, operates as a public utility holding company in the United States.
The above daily chart formed an approximately 3-month-long rectangle chart pattern as a bullish reversal after a downtrend.
The horizontal boundary at 94.8 levels acts as a resistance within this pattern.
A daily close above 97.64 levels would validate the breakout from the 3-month-long rectangle chart pattern.
Based on this chart pattern, the potential price target is 106.5 levels.
MGEE, classified under the "utilities" sector, falls under the “Mid Cap-Income” stock category.
Xcel Energy Inc.-(XEL/NASDAQ)-Long Idea
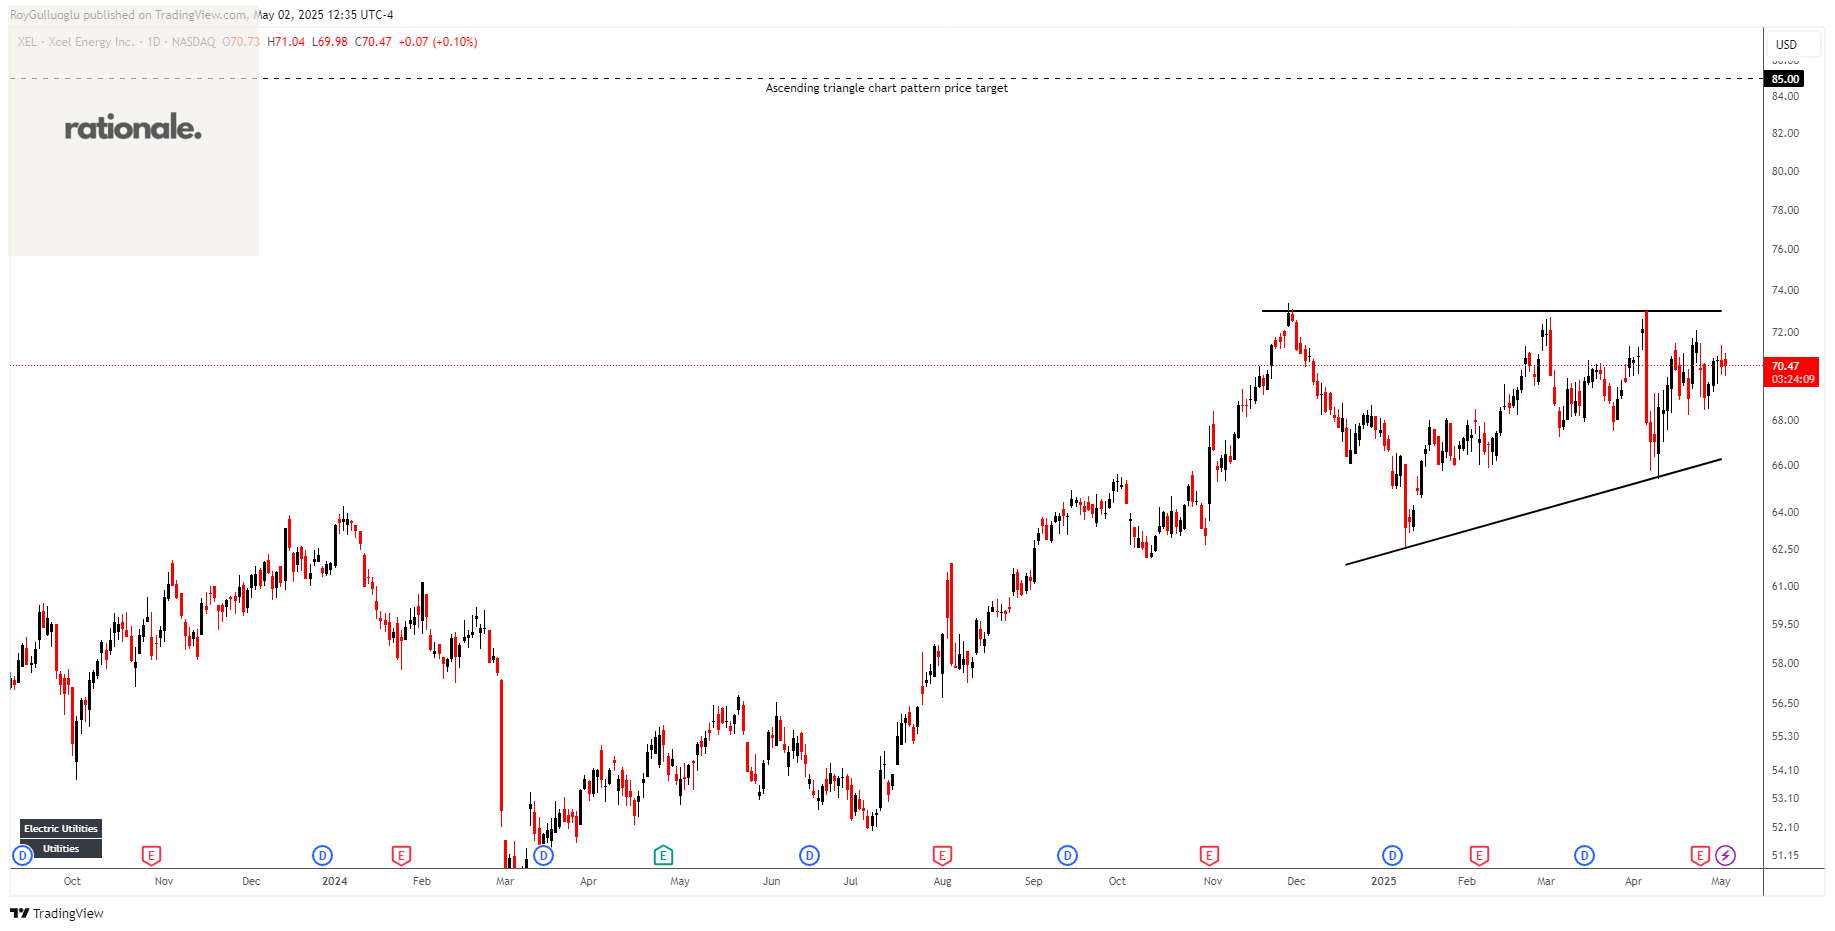
Xcel Energy Inc., through its subsidiaries, engages in the generation, purchasing, transmission, distribution, and sale of electricity in the United States.
The above daily chart formed an approximately 3-month-long ascending triangle chart pattern as a bullish continuation after an uptrend.
The horizontal boundary at 73.02 levels acts as a resistance within this pattern.
A daily close above 75.21 levels would validate the breakout from the 3-month-long ascending triangle chart pattern.
Based on this chart pattern, the potential price target is 85 levels.
XEL, classified under the "utilities" sector, falls under the “Large Cap - Income” stock category.
Great-West Lifeco Inc.-(GWO/TSX)-Short Idea
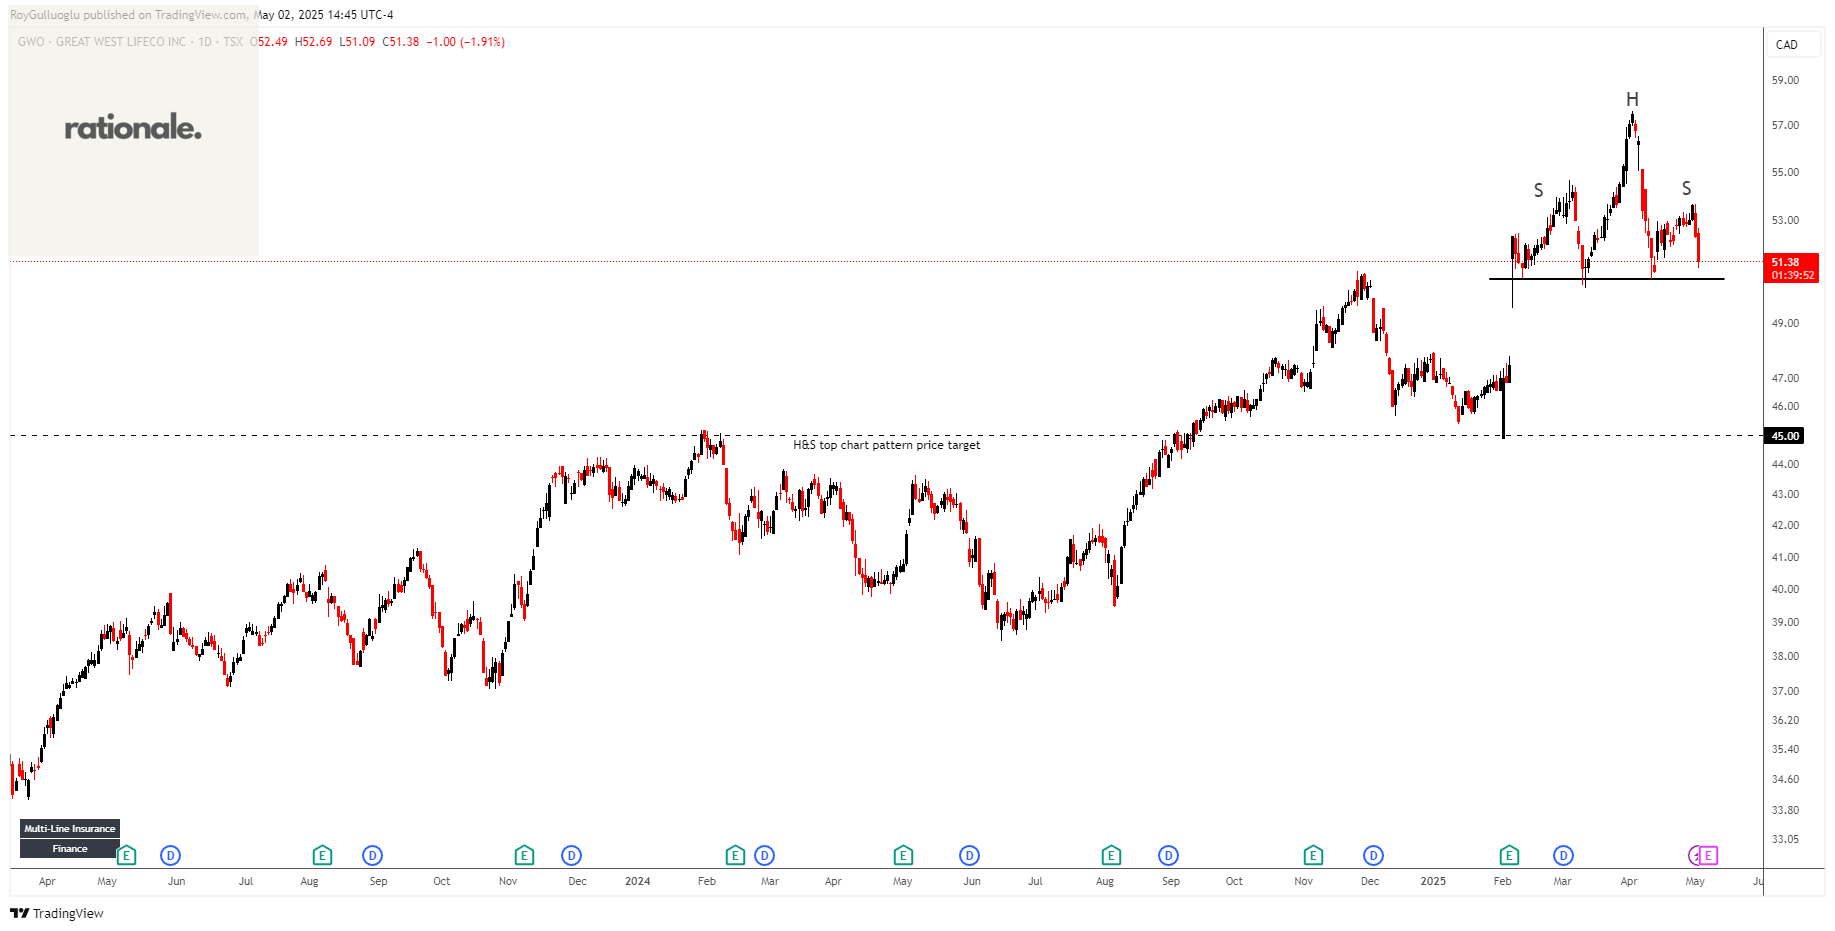
Great-West Lifeco Inc. engages in the life and health insurance, retirement savings, wealth and asset management, and reinsurance businesses in Canada, the United States, and Europe.
The above daily chart formed an approximately 2-month-long H&S top chart pattern as a bearish reversal after an uptrend.
The horizontal boundary at 50.69 levels acts as a support within this pattern.
A daily close below 49.17 levels would validate the breakout from the 2-month-long H&S top chart pattern.
Based on this chart pattern, the potential price target is 45 levels.
GWO, classified under the "financial services" sector, falls under the “Large Cap-Income” stock category.
Remgro Limited-(REM/JSE)-Long Idea
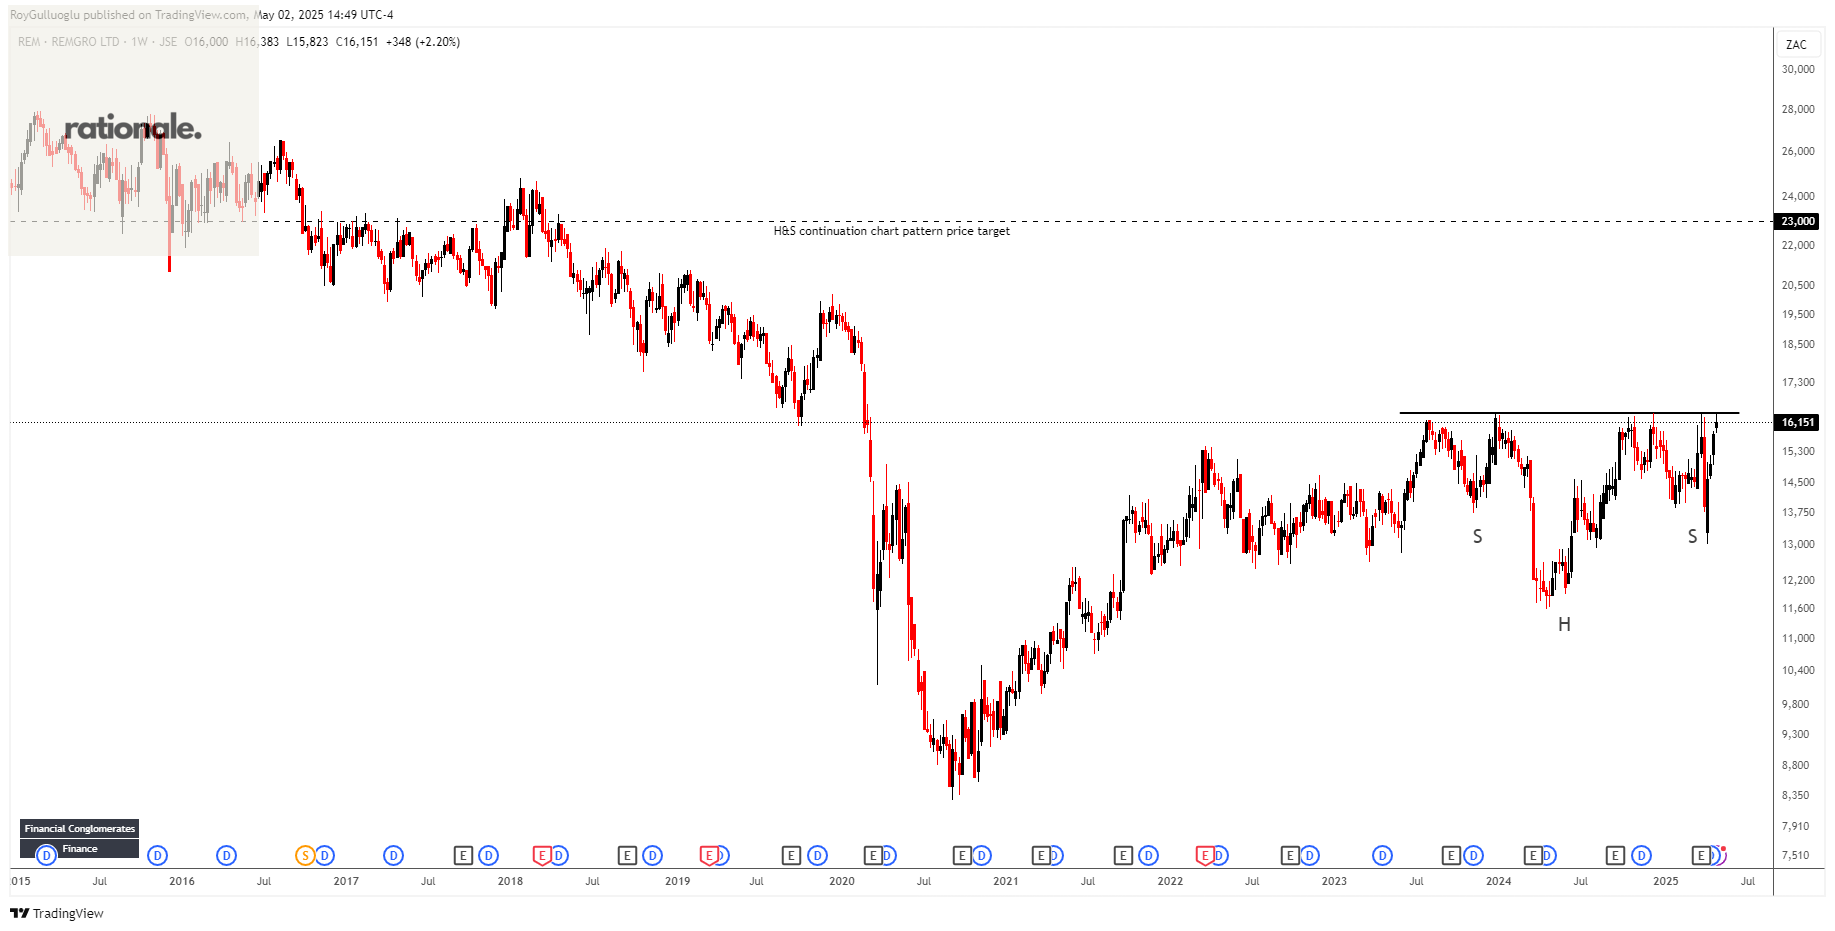
Remgro Limited is a principal investment firm. The firm prefers to invest in financial services, food, liquor and home care, banking, insurance, industrial, healthcare, infrastructure, information technology infrastructure services, media, and sport.
The above daily chart formed an approximately 3-month-long H&S continuation chart pattern as a bullish continuation after an uptrend.
The horizontal boundary at 16398 levels acts as a resistance within this pattern.
A daily close above 16890 levels would validate the breakout from the 3-month-long H&S continuation chart pattern.
Based on this chart pattern, the potential price target is 23000 levels.
Northam Platinum Holdings Limited-(NPH/JSE)-Long Idea
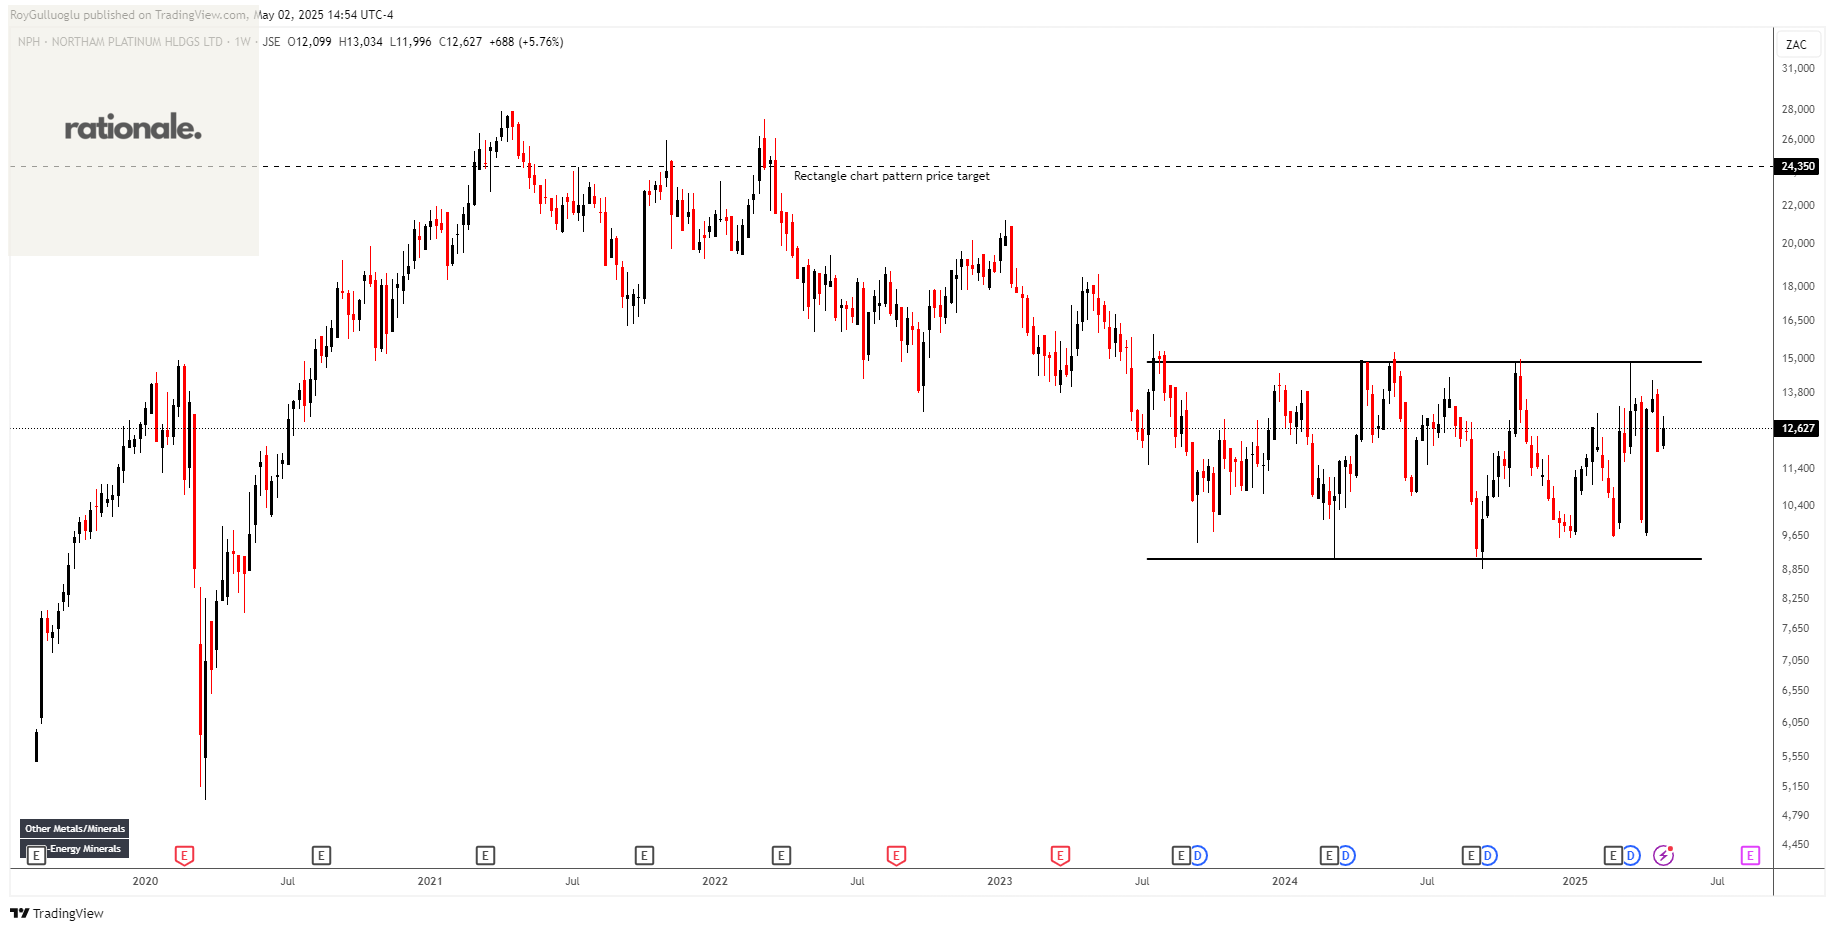
Northam Platinum Holdings Limited, through its subsidiary, Northam Platinum Limited, engages in the production and sale of platinum group metals in South Africa, the Americas, Europe, the United Kingdom, Far East, rest of Africa, the Middle East, Australasia, and the People's Republic of China.
The above weekly chart formed an approximately 20-month-long rectangle chart pattern as a bullish reversal after a downtrend.
The horizontal boundary at 14906 levels acts as a resistance within this pattern.
A daily close above 15353 levels would validate the breakout from the 20-month-long rectangle chart pattern.
Based on this chart pattern, the potential price target is 24350 levels.