

Trade Ideas Fx-Futures-Etf-Crypto
XLMUSDT, ATOMUSDT, DYDXUSDT, LPTUSDT, CT1!(ICEUS)

XLMUSDT-Long Idea
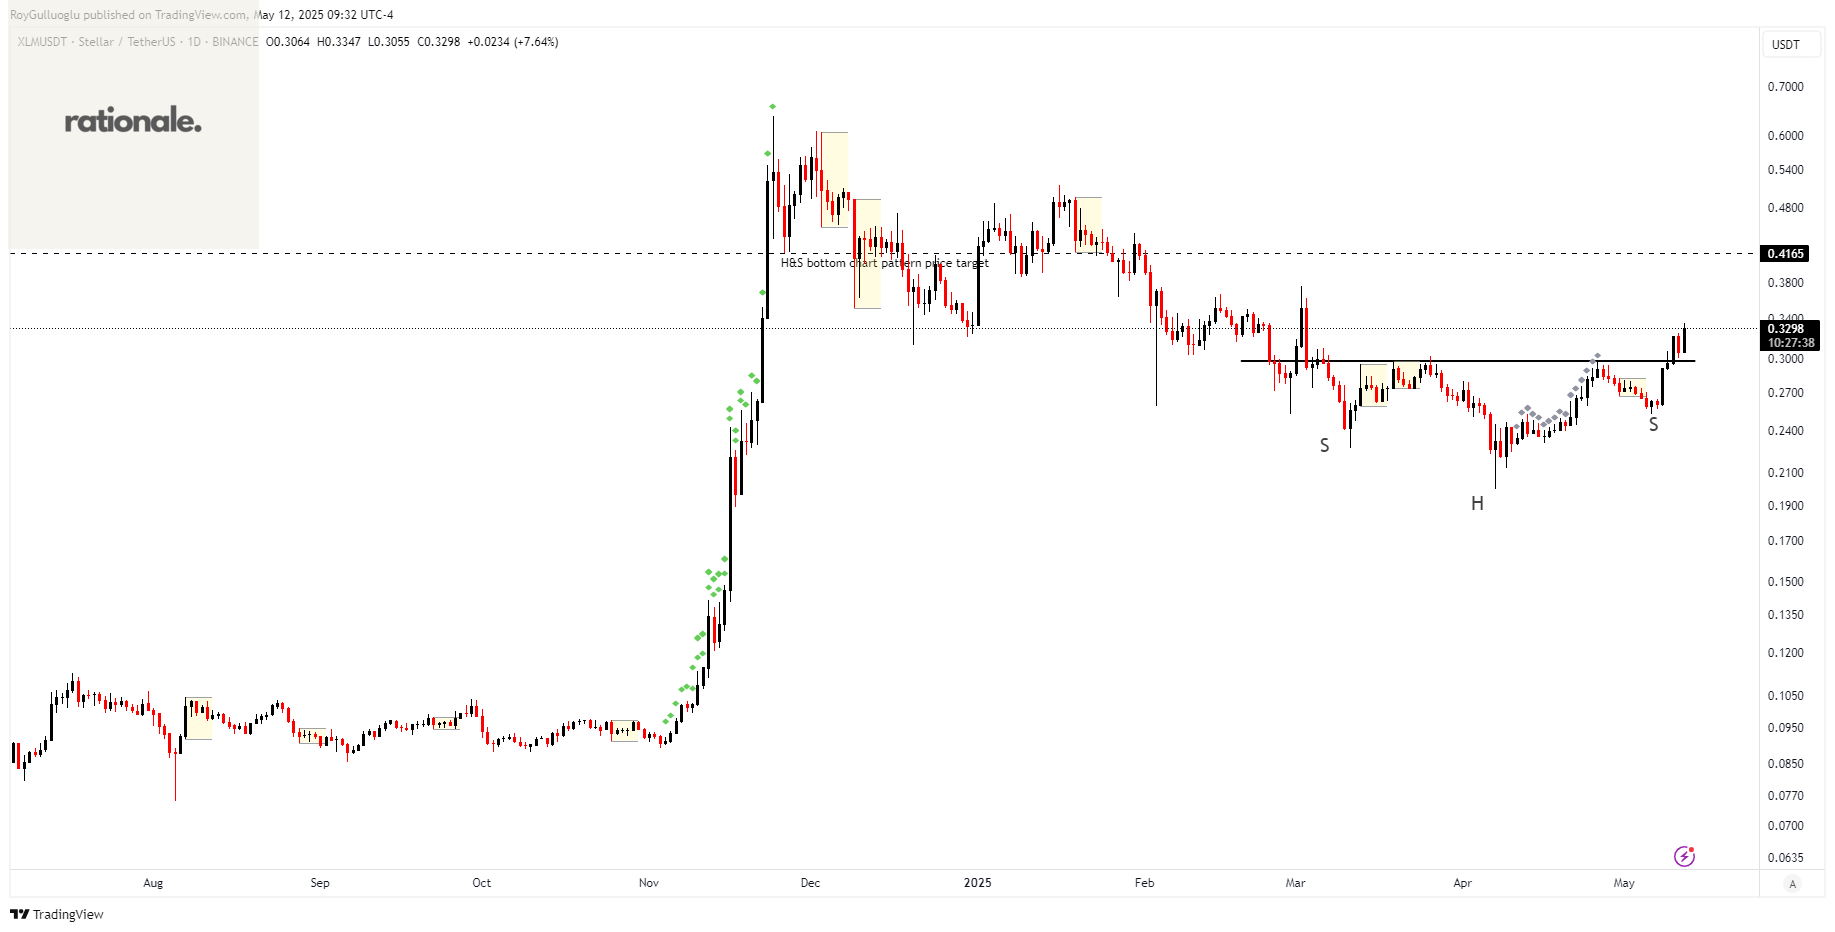
The above daily chart formed an approximately 3-month-long H&S bottom chart pattern as a bullish reversal after a downtrend.
The horizontal boundary at 0.2979 levels acted as a resistance within this pattern.
A daily close above 0.3068 levels validated the breakdown from the 3-month-long H&S bottom chart pattern.
Based on this chart pattern, the potential price target is approximately 0.4165 levels.
ATOMUSDT-Long Idea
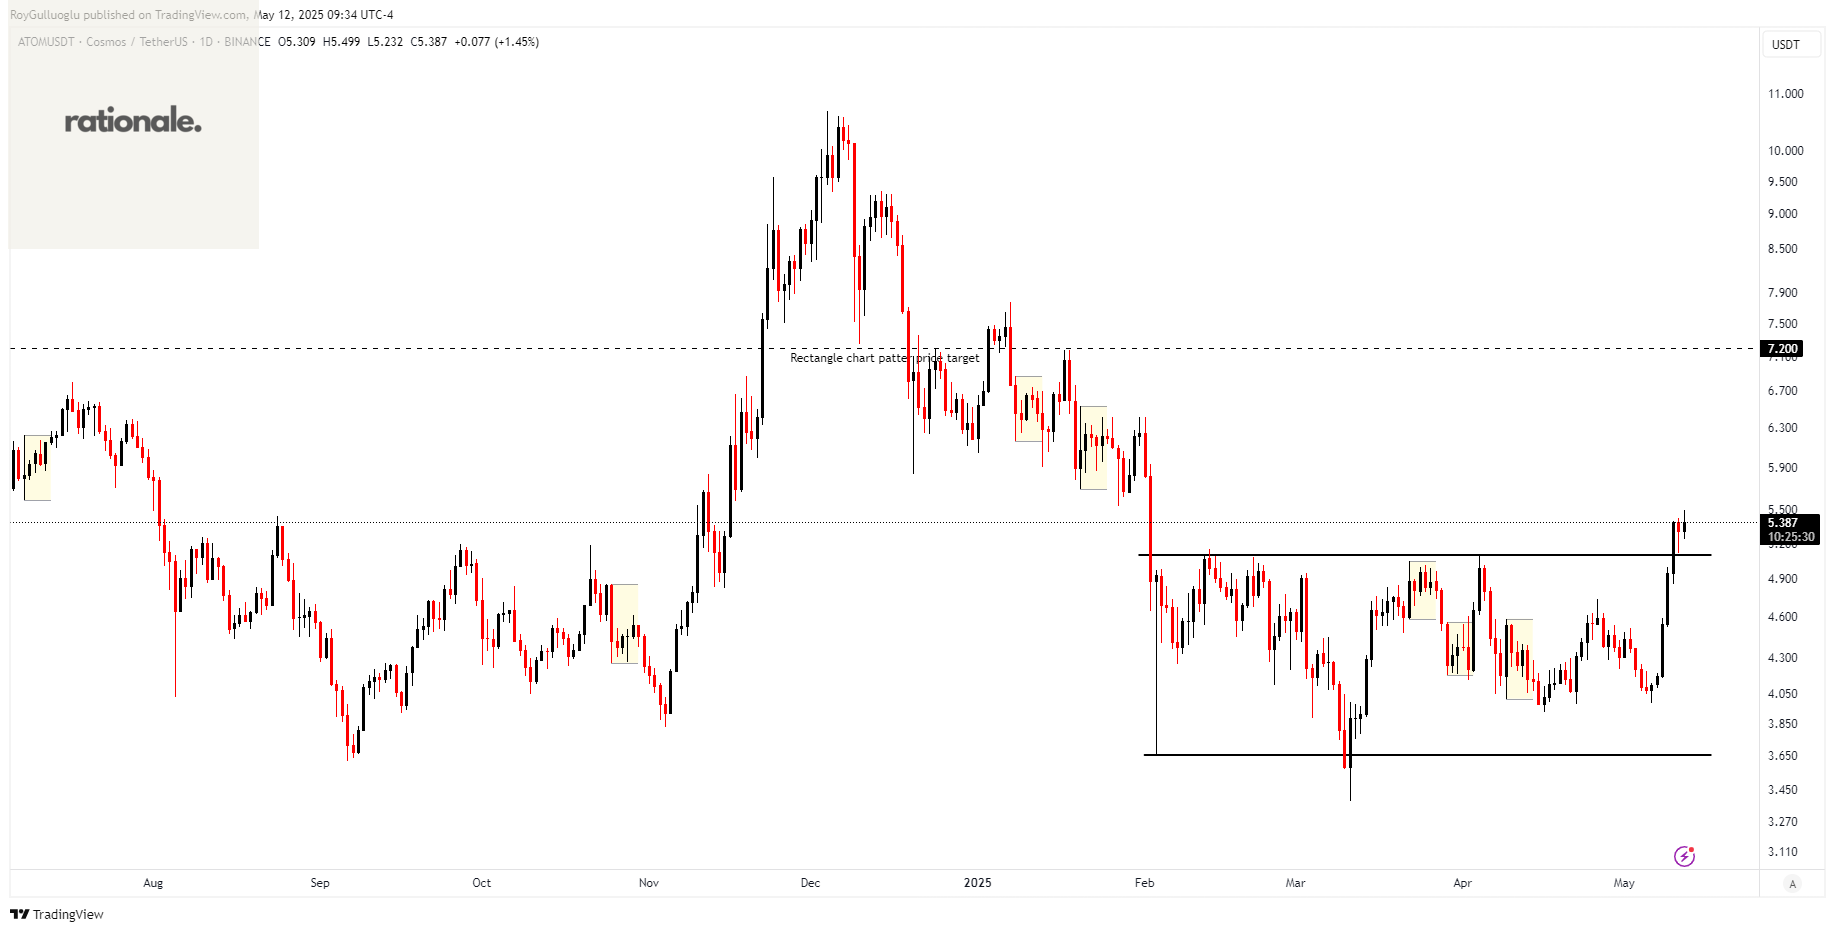
The above daily chart formed an approximately 3-month-long rectangle chart pattern as a bullish reversal after a downtrend.
The horizontal boundary at 5.101 levels acted as a resistance within this pattern.
A daily close above 5.254 levels validated the breakdown from the 17-month-long rectangle chart pattern.
Based on this chart pattern, the potential price target is approximately 7.2 levels.
DYDXUSDT-Long Idea
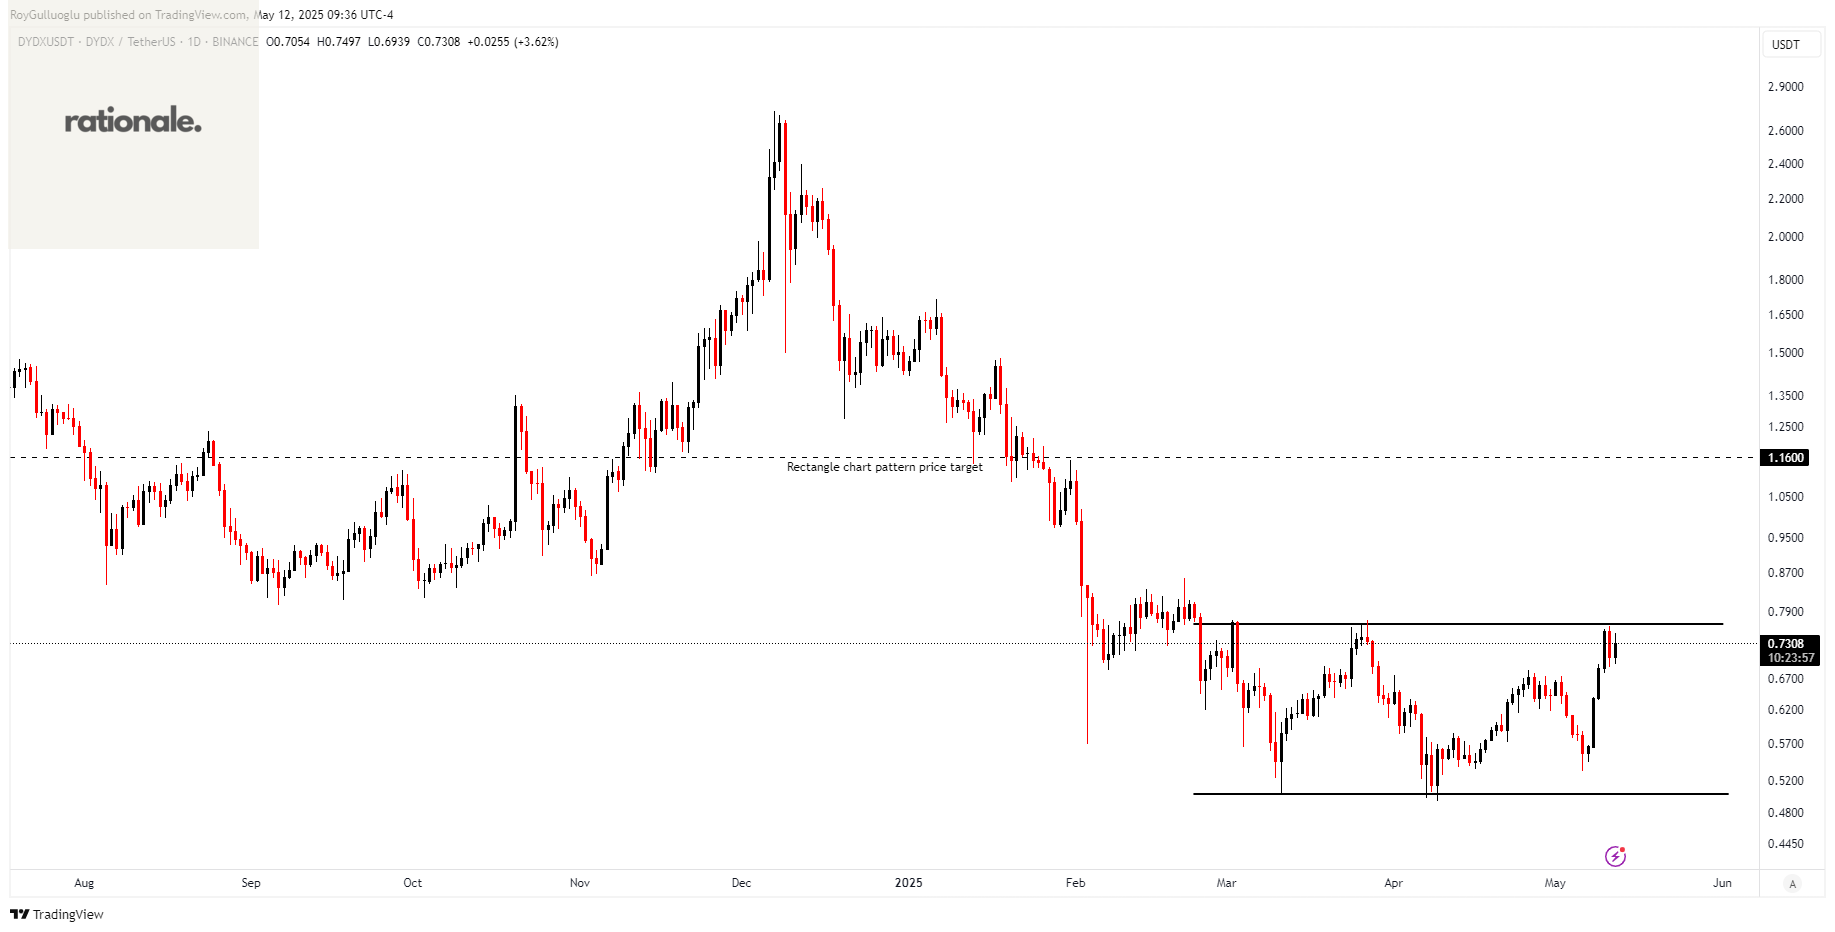
The above daily chart formed an approximately 3-month-long rectangle chart pattern as a bullish reversal after a downtrend.
The horizontal boundary at 0.7657 levels acts as a resistance within this pattern.
A daily close above 0.7886 levels would validate the breakdown from the 3-month-long rectangle chart pattern.
Based on this chart pattern, the potential price target is approximately 1.16 levels.
LPTUSDT-Long Idea
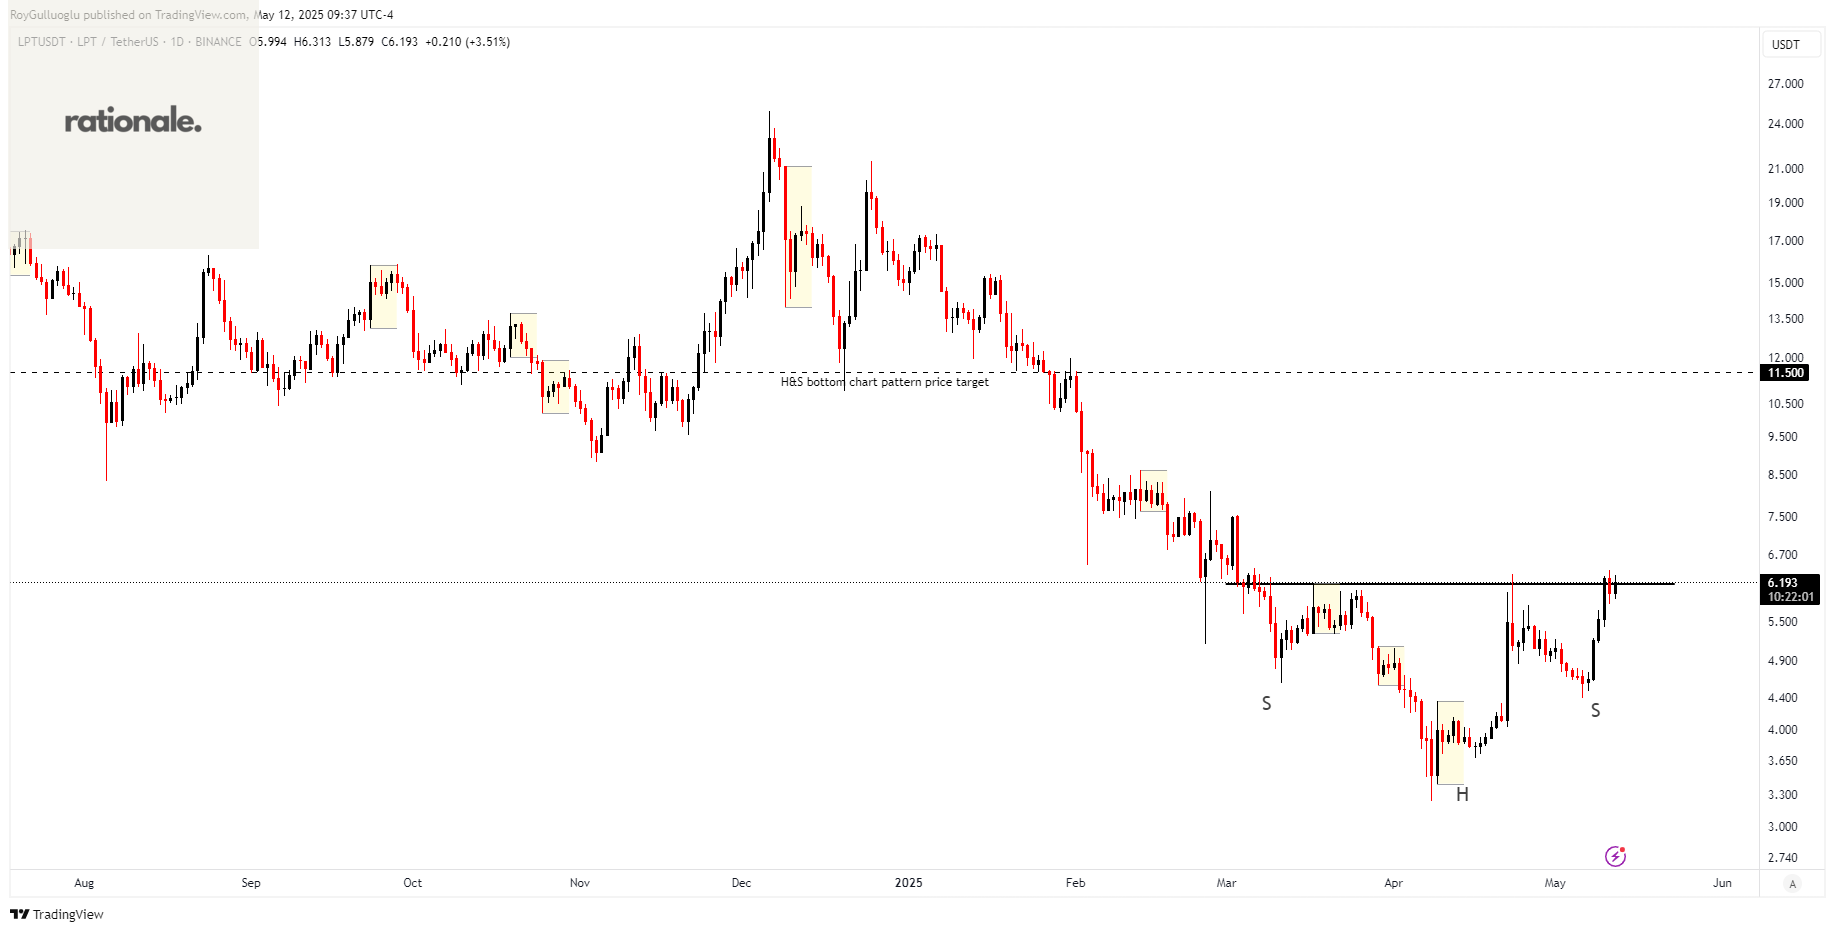
The above daily chart formed an approximately 2-month-long H&S bottom chart pattern as a bullish reversal after a downtrend.
The horizontal boundary at 6.147 levels acts as a resistance within this pattern.
A daily close above 6.33 levels would validate the breakdown from the 2-month-long H&S bottom chart pattern.
Based on this chart pattern, the potential price target is approximately 11.5 levels.
CT1!(Cotton Futures)-Long Idea
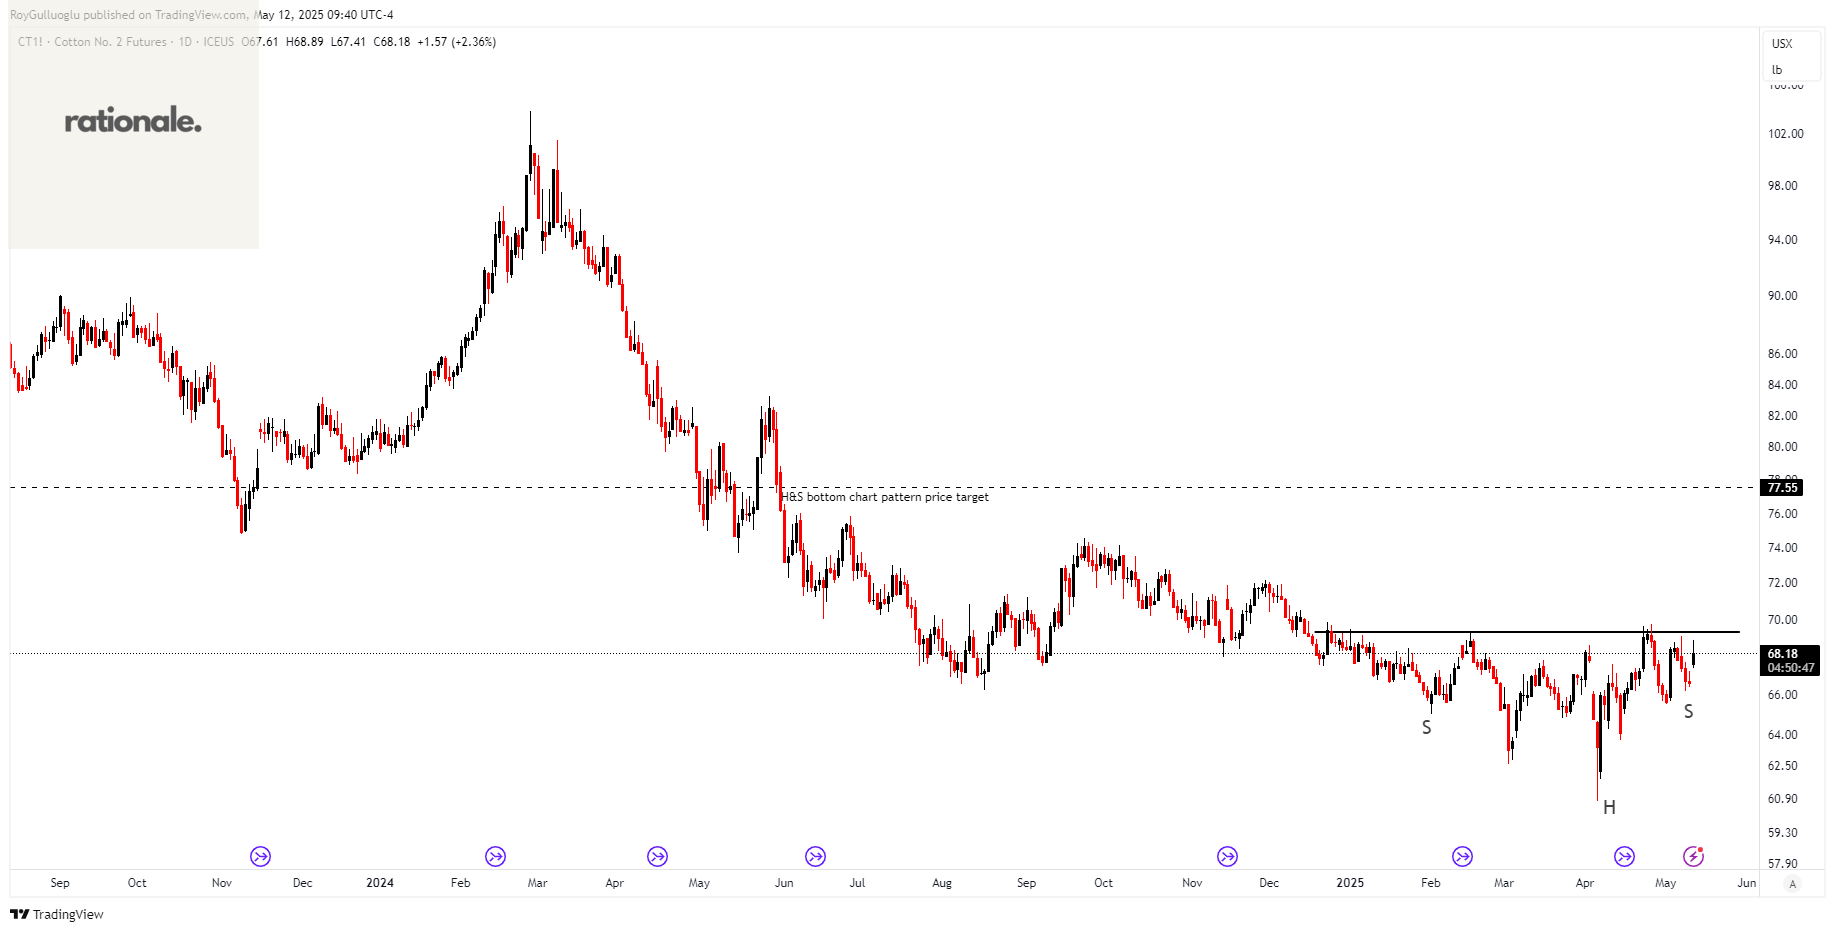
The above daily chart formed an approximately 3-month-long H&S bottom chart pattern as a bullish reversal after a downtrend.
The horizontal boundary at 69.3 levels acts as a resistance within this pattern.
A daily close above 71.37 levels would validate the breakdown from the 3-month-long H&S bottom chart pattern.
Based on this chart pattern, the potential price target is approximately 77.55 levels.