

Trade Ideas Equities
BSX(NYSE), CVCO(NASDAQ), 7187(TSE), 1698(HKEX), 6750(TSE), MAERSK(OMXCOP), MAGEN(BIST)

Boston Scientific Corporation-(BSX/NYSE)-Long Idea
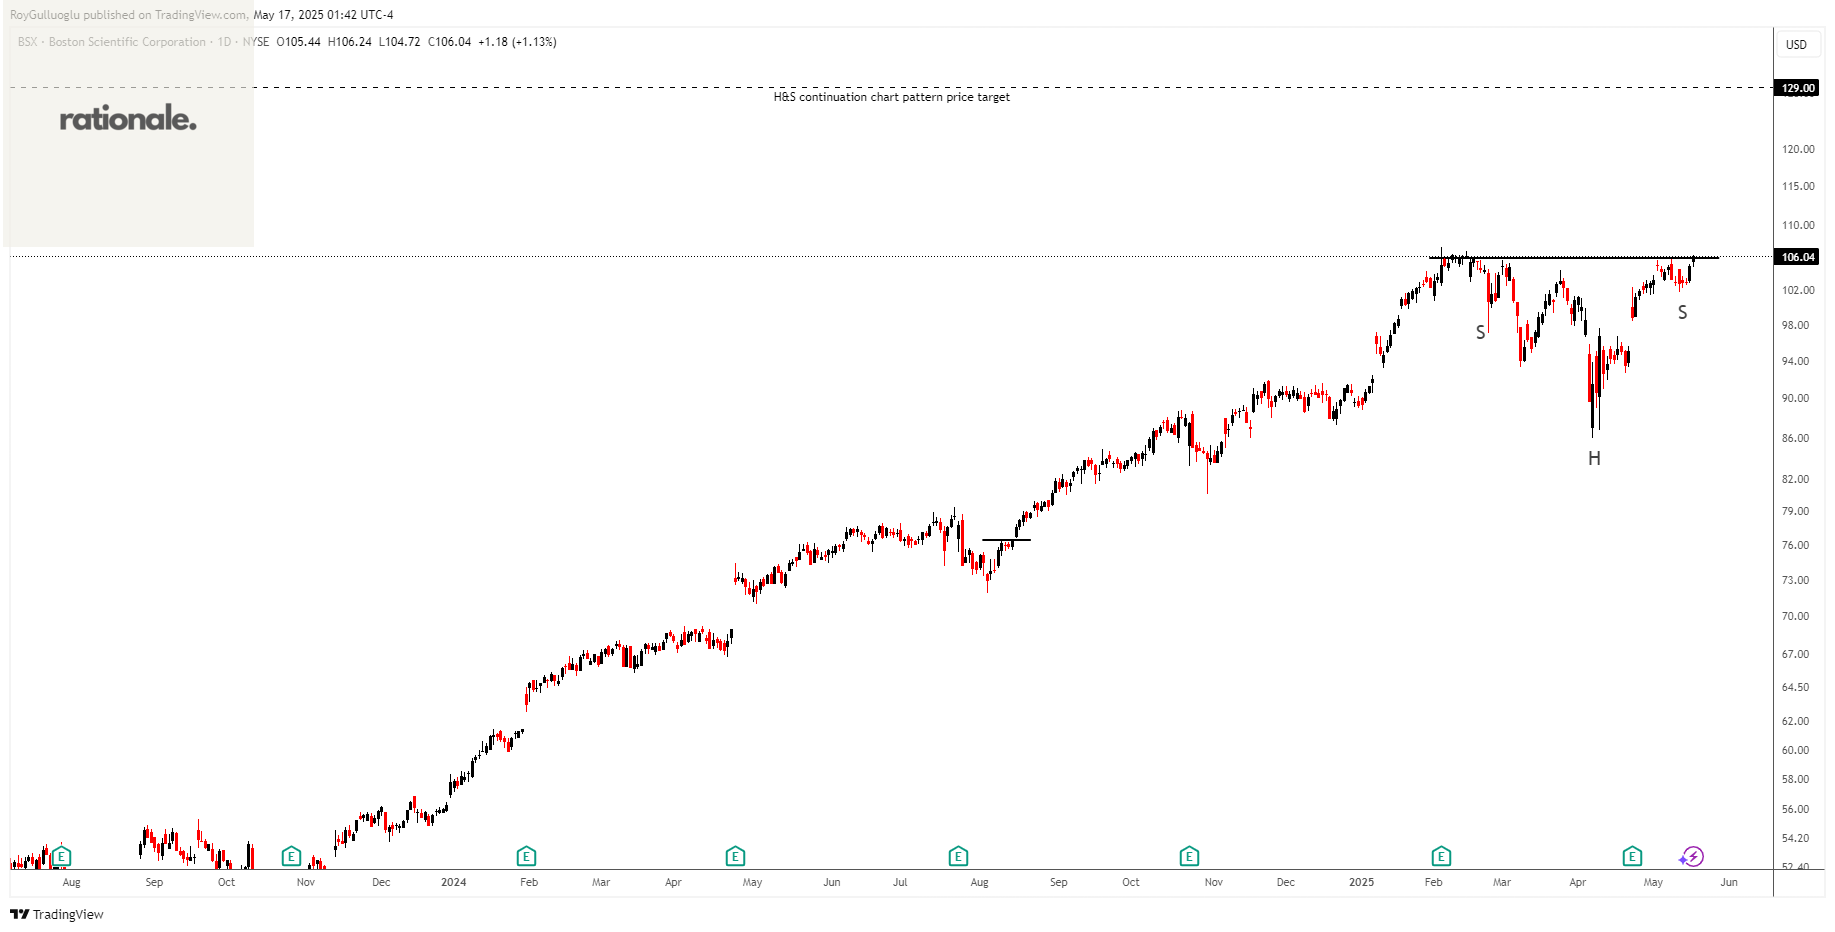
Boston Scientific Corporation develops, manufactures, and markets medical devices for use in various interventional medical specialties worldwide.
The above daily chart formed an approximately 2-month-long H&S continuation chart pattern as a bullish continuation after an uptrend.
The horizontal boundary at 105.89 levels acts as a resistance within this pattern.
A daily close above 109 levels would validate the breakout from the 2-month-long H&S continuation chart pattern.
Based on this chart pattern, the potential price target is 129 levels.
BSX, classified under the "industrials" sector, falls under the “Large Cap - Value” stock category.
Cavco Industries, Inc.-(CVCO/NASDAQ)-Long Idea
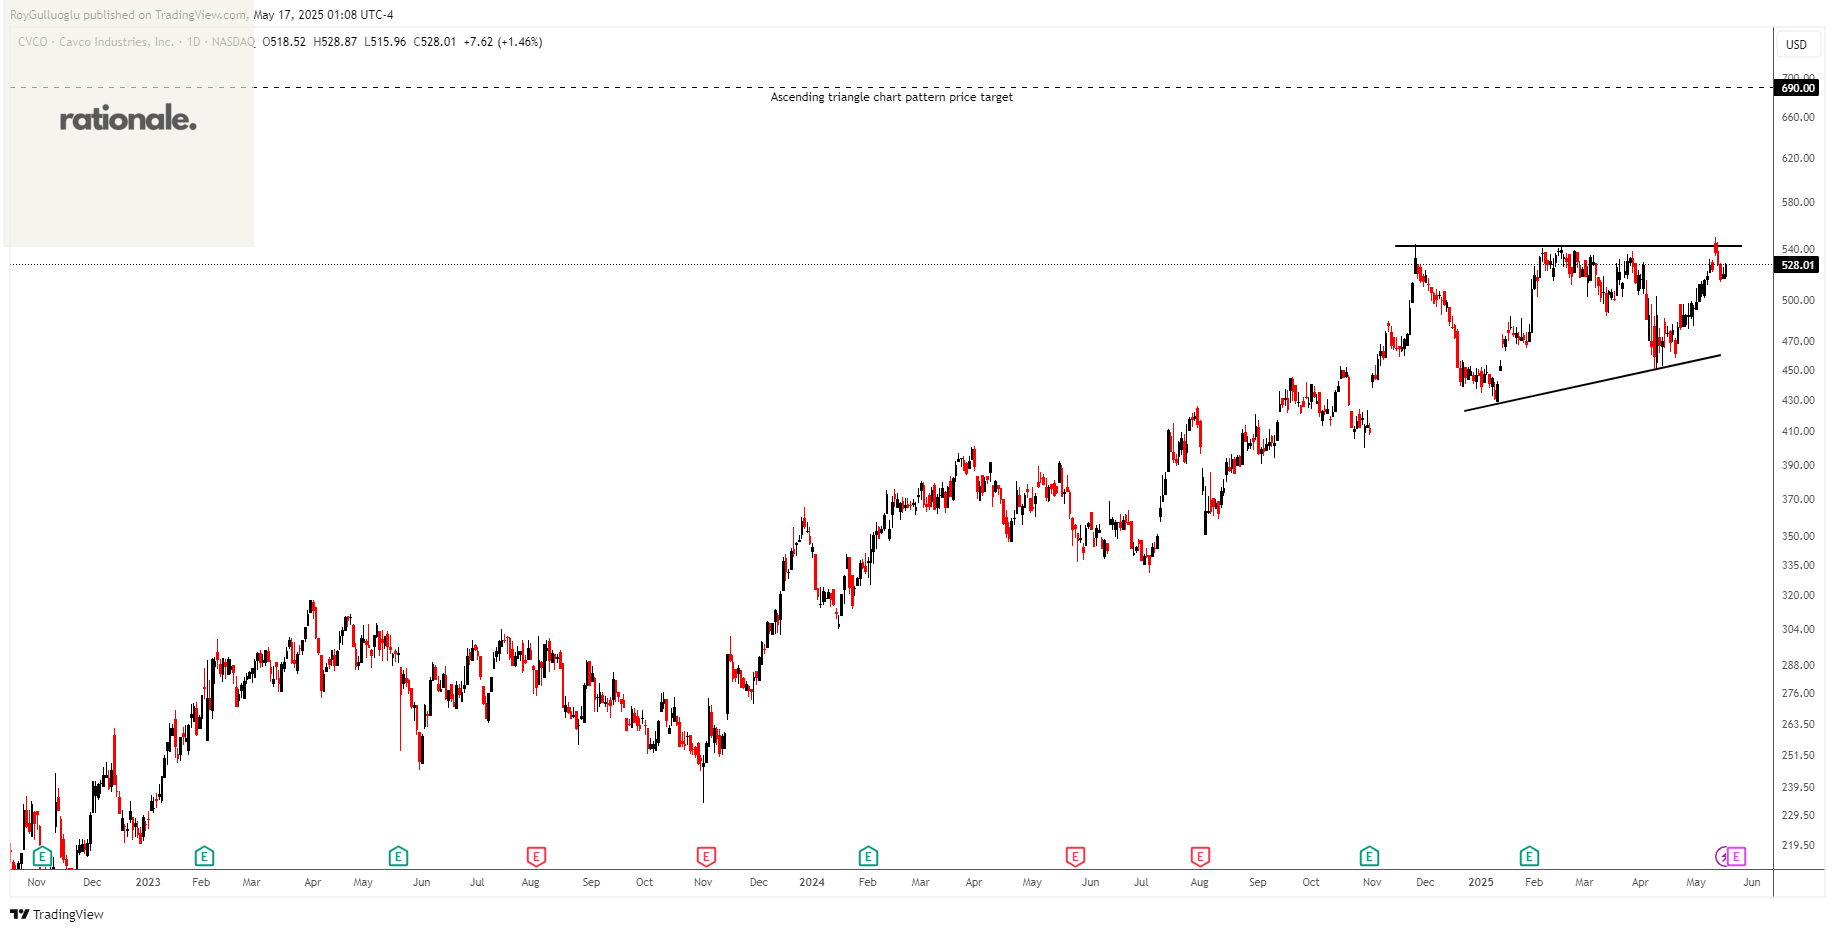
Cavco Industries, Inc. designs, produces, and retails factory-built homes primarily in the United States.
The above daily chart formed an approximately 4-month-long ascending triangle chart pattern as a bullish continuation after an uptrend.
The horizontal boundary at 543.1 levels acts as a resistance within this pattern.
A daily close above 559.4 levels would validate the breakout from the 4-month-long ascending triangle chart pattern.
Based on this chart pattern, the potential price target is 690 levels.
CVCO, classified under the "consumer cyclical" sector, falls under the “Mid Cap - Growth” stock category.
J-Lease Co.,Ltd.-(7187/TSE)-Long Idea
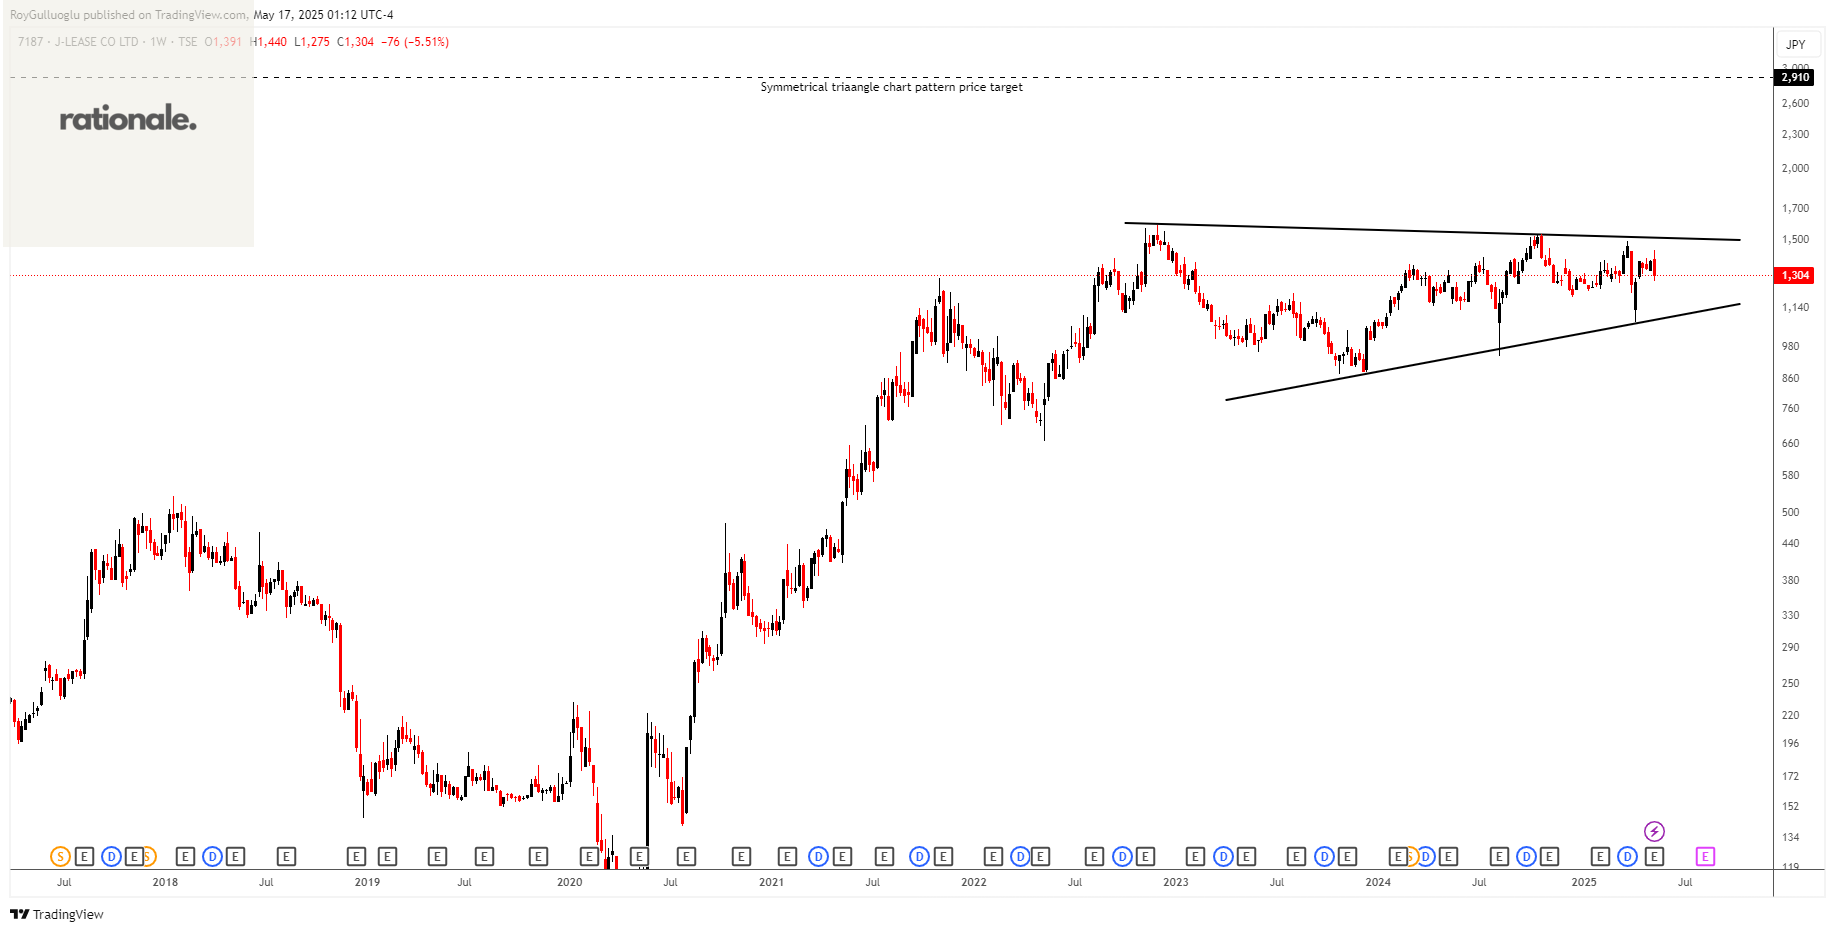
J-Lease Co.,Ltd. engages in guarantor-related business. The company offers rent liability guarantee, medical expenses guarantee, and child support guarantee services.
The above weekly chart formed an approximately 30-month-long symmetrical triangle chart pattern as a bullish continuation after an uptrend.
A daily close above 1586 levels would validate the breakout from the 3-month-long rectangle chart pattern.
Based on this chart pattern, the potential price target is 2910 levels.
7187, classified under the "real estate" sector, falls under the “Small Cap-Income” stock category.
Tencent Music Entertainment Group-(1698/HKEX)-Long Idea
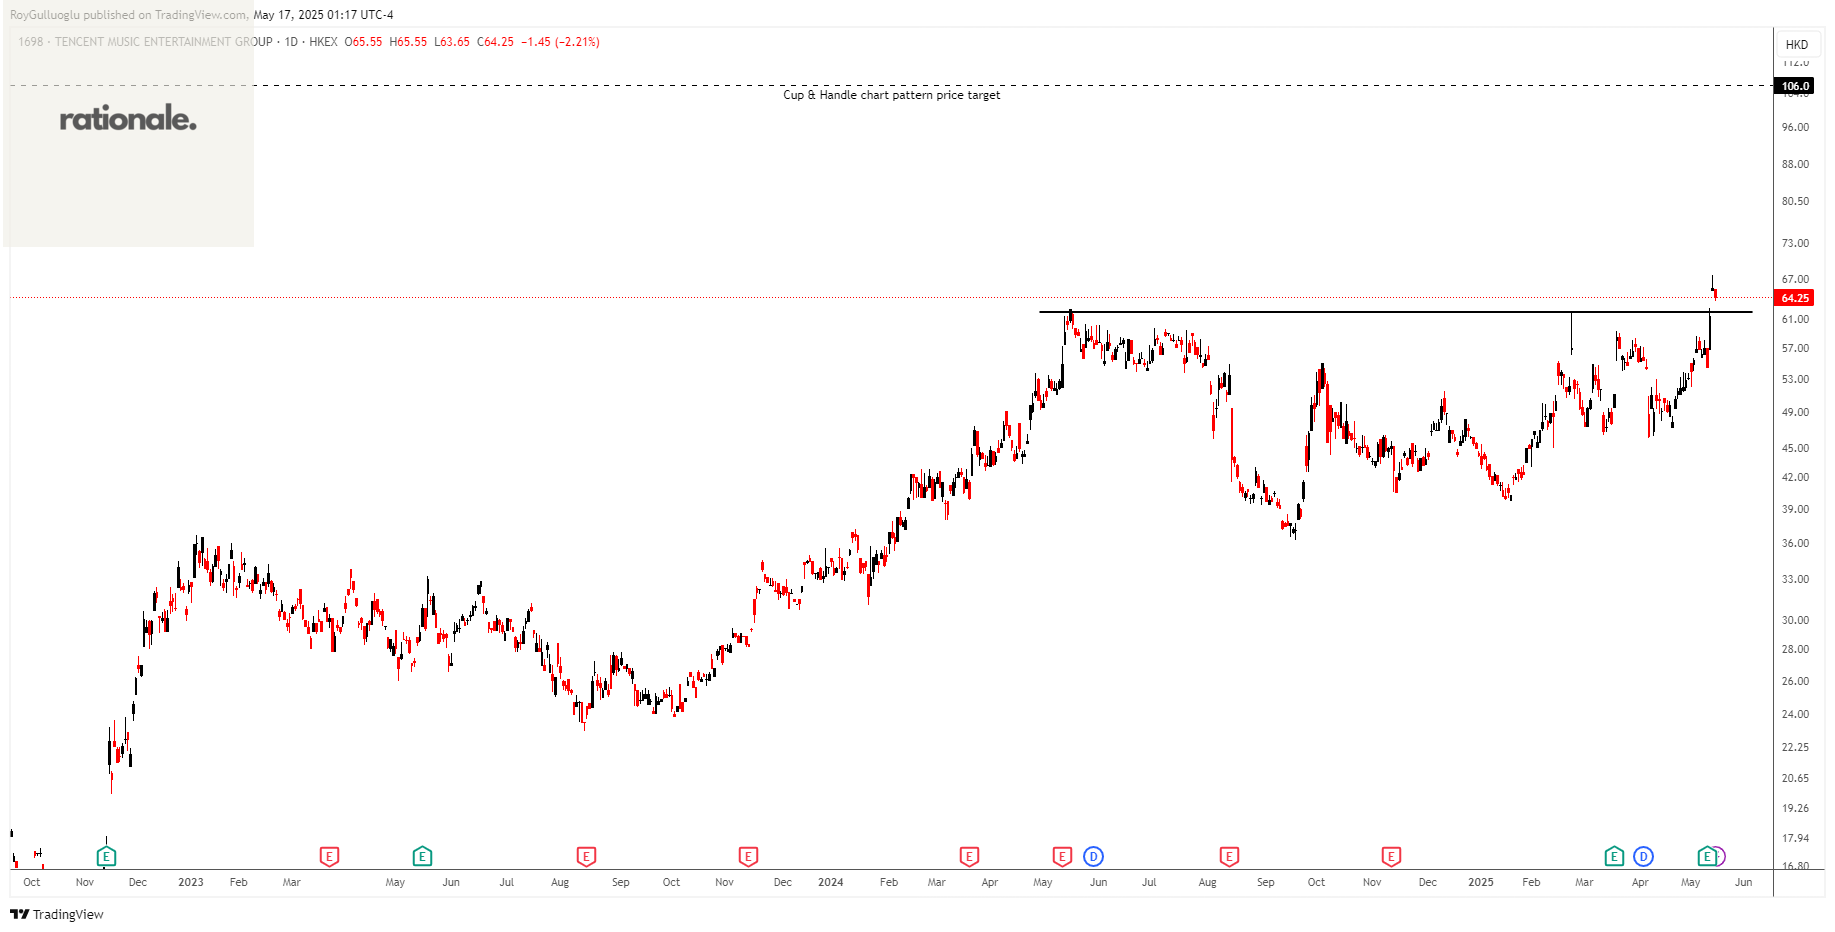
Tencent Music Entertainment Group operates online music entertainment platforms that provides music streaming, online karaoke, and live streaming services in the People's Republic of China
The above daily chart formed an approximately 8-month-long cup & handle chart pattern as a bullish continuation after an uptrend.
The horizontal boundary at 62 levels acted as a resistance within this pattern.
A daily close above 63.86 levels validated the breakout from the 8-month-long cup & handle chart pattern.
Based on this chart pattern, the potential price target is 106 levels.
1698, classified under the "communication services" sector, falls under the “Large Cap - Growth” stock category.
Elecom Co., Ltd.-(6750/TSE)-Long Idea
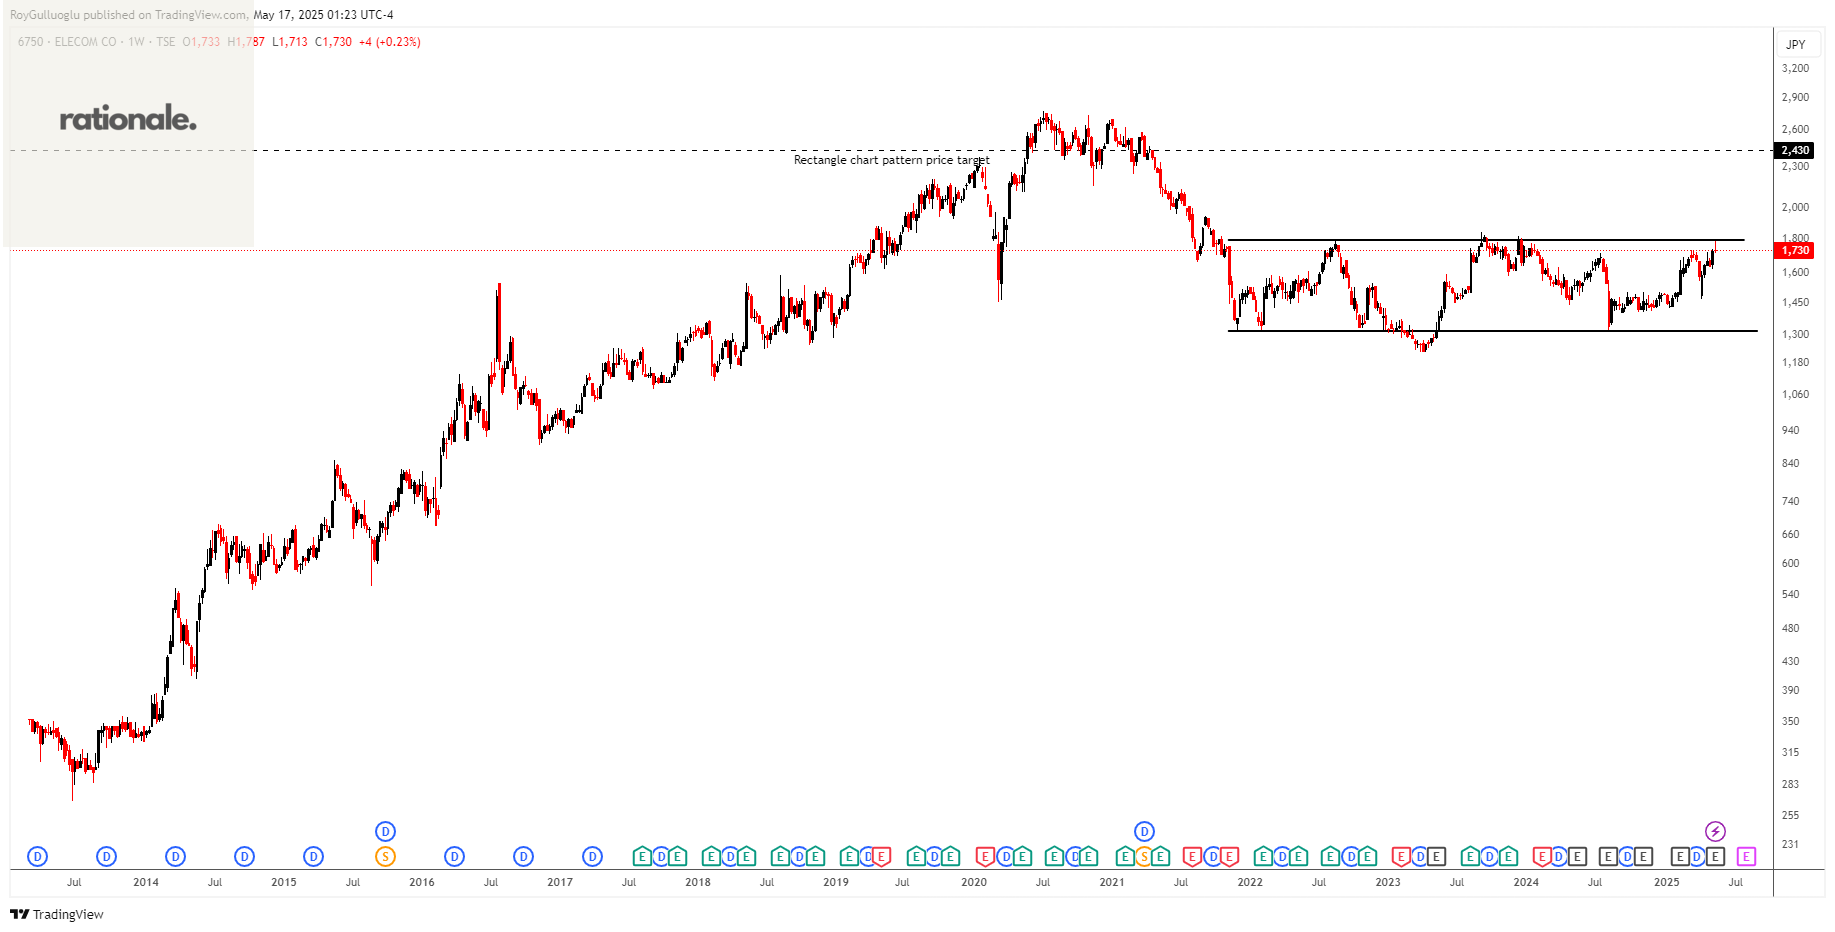
Elecom Co., Ltd. engages in the development, manufacturing, and sale of personal computers and digital equipment related products in Japan and internationally.
The above weekly chart formed an approximately 40-month-long rectangle chart pattern as a bullish reversal after a downtrend.
The horizontal boundary at 1792 levels acts as a resistance within this pattern.
A daily close above 1845 levels would validate the breakout from the 40-month-long rectangle chart pattern.
Based on this chart pattern, the potential price target is 2430 levels.
6750, classified under the "technology" sector, falls under the “Small Cap - Growth” stock category.
Mærsk A/S-(MAERSK/OMXCOP)-Long Idea
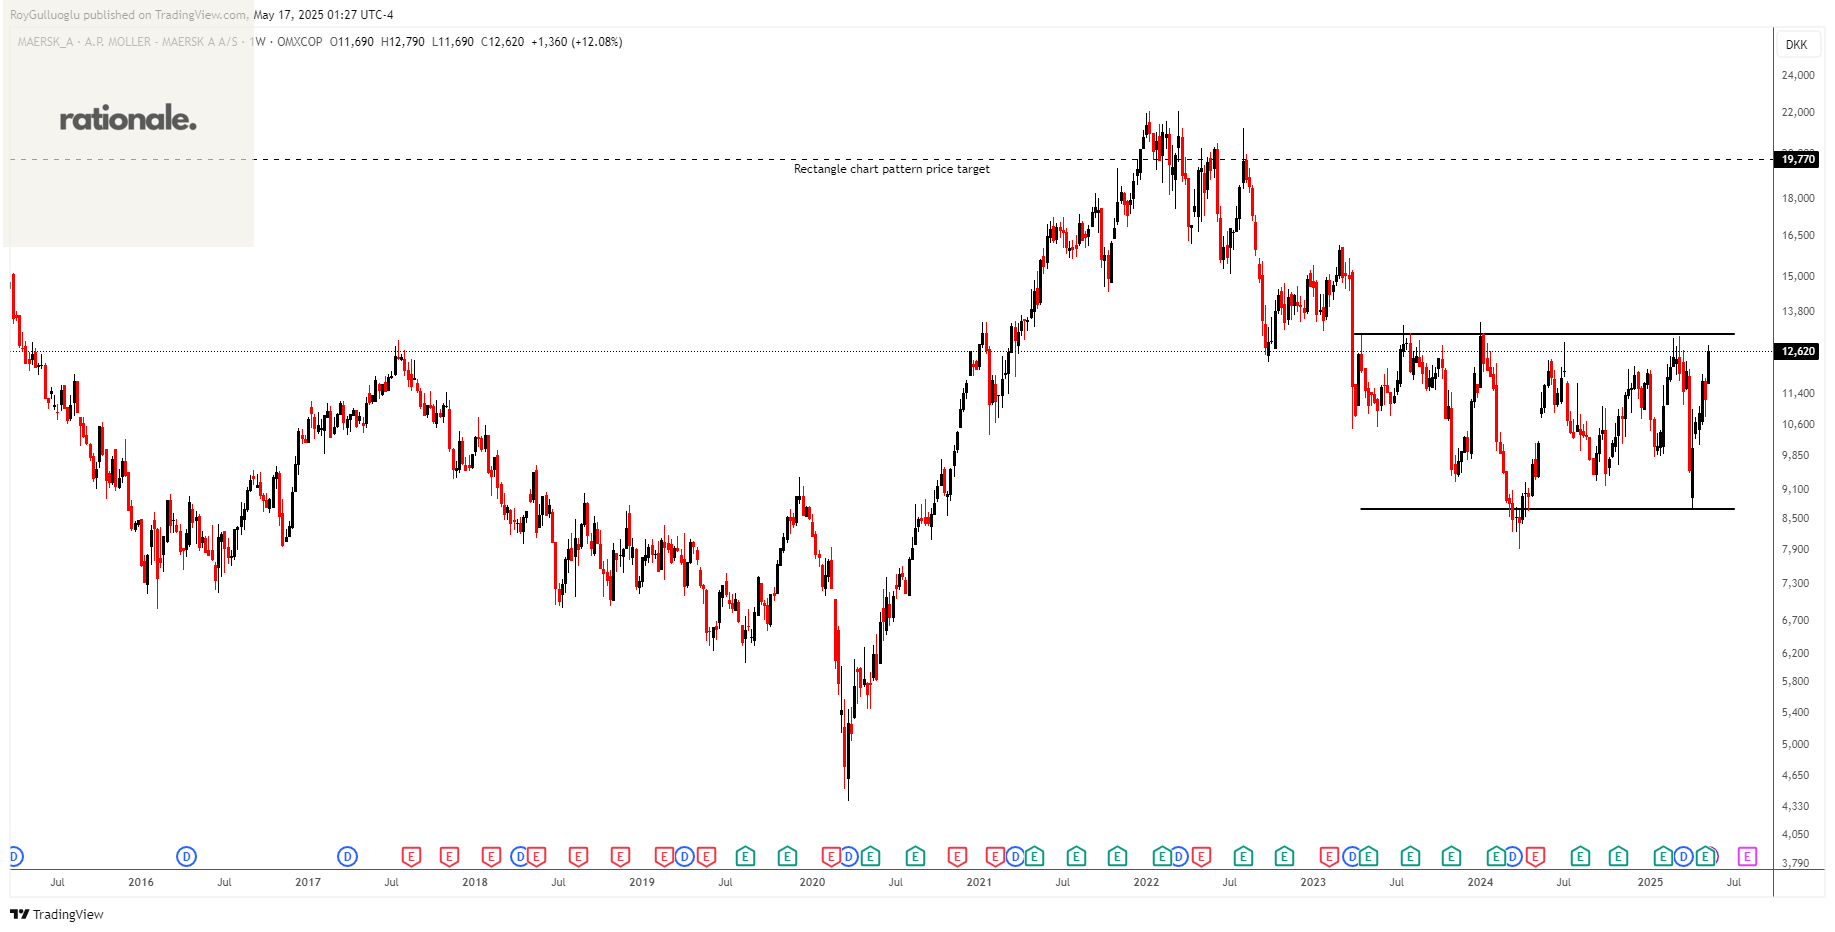
Mærsk A/S, together with its subsidiaries, operates as an integrated logistics company in Denmark and internationally.
The above weekly chart formed an approximately 25-month-long rectangle chart pattern as a bullish reversal after a downtrend.
The horizontal boundary at 13120 levels acts as a resistance within this pattern.
A daily close above 13550 levels would validate the breakout from the 25-month-long rectangle chart pattern.
Based on this chart pattern, the potential price target is 19770 levels.
MAERSK, classified under the "industrials" sector, falls under the “Large Cap - Value” stock category.
Margün Enerji Üretim Sanayi ve Ticaret A.S.-(MAGEN/BIST)-Long Idea
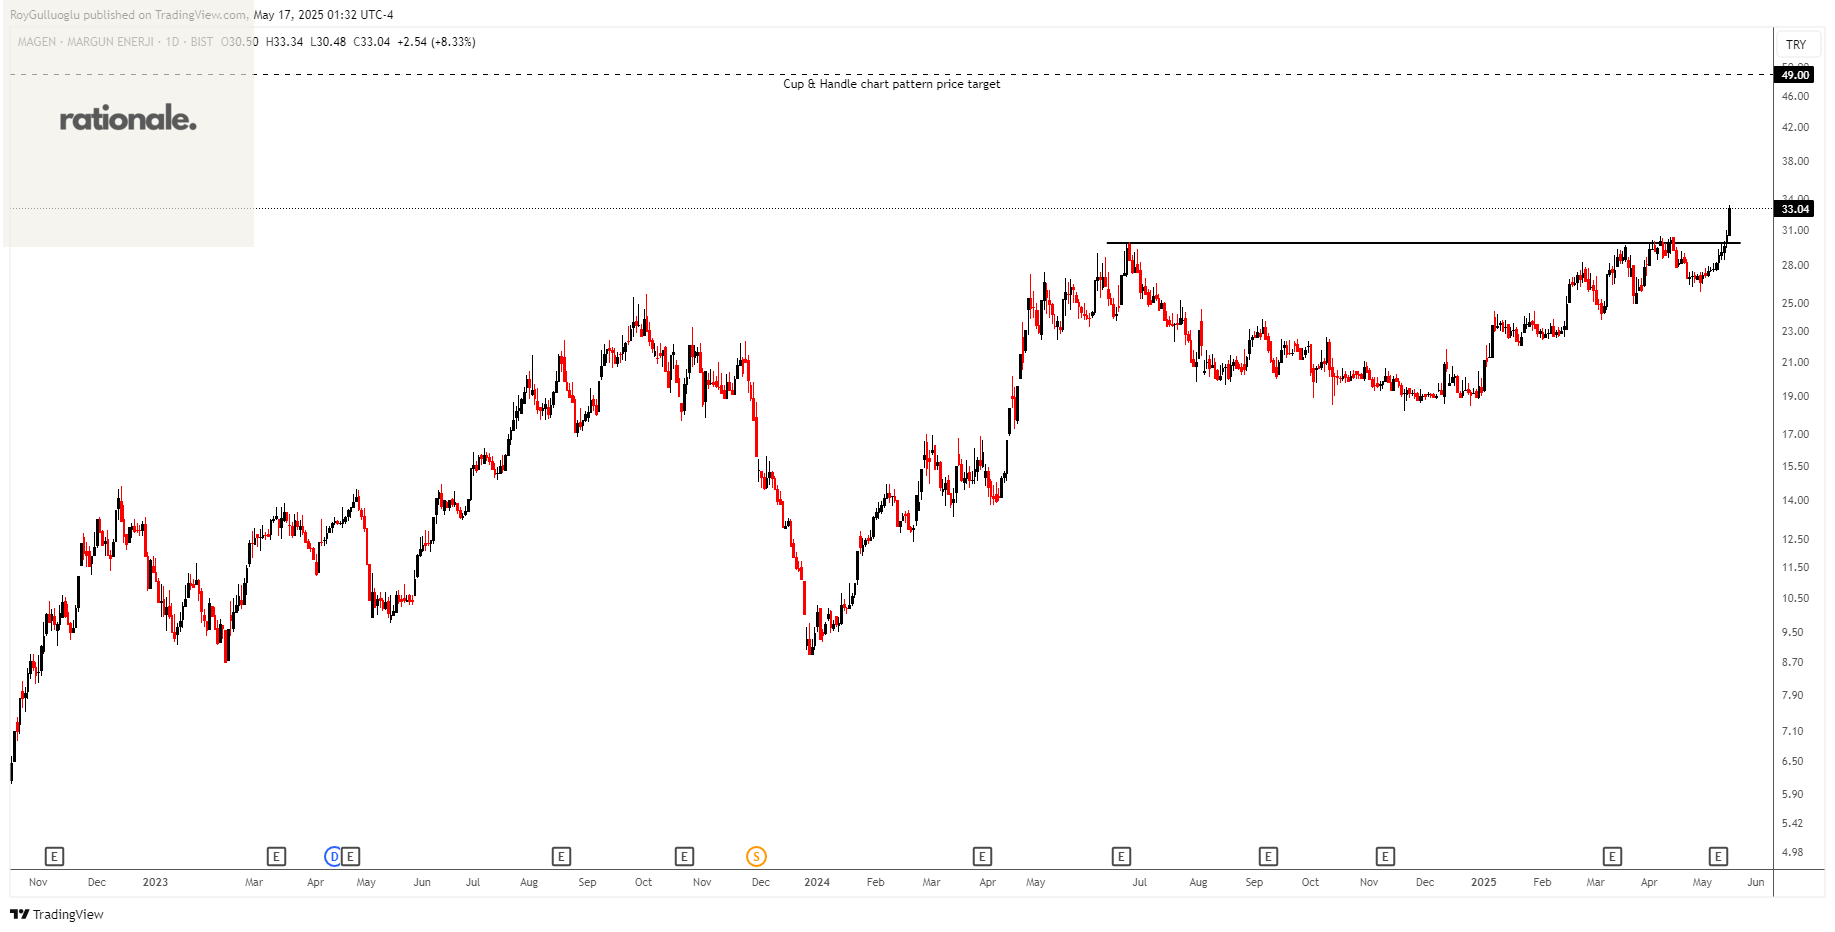
Margün Enerji Üretim Sanayi ve Ticaret A.S. engages in the establishment and commissioning of solar power plants to generate electricity from renewable energy sources in Turkey and internationally.
The above daily chart formed an approximately 7-month-long cup & handle chart pattern as a bullish continuation after an uptrend.
The horizontal boundary at 29.86 levels acted as a resistance within this pattern.
A daily close above 30.75 levels validated the breakout from the 8-month-long cup & handle chart pattern.
Based on this chart pattern, the potential price target is 49 levels.
Teşekkürler Roy