


TCM Group A/S-(TCM/OMXCOP)-Long Idea
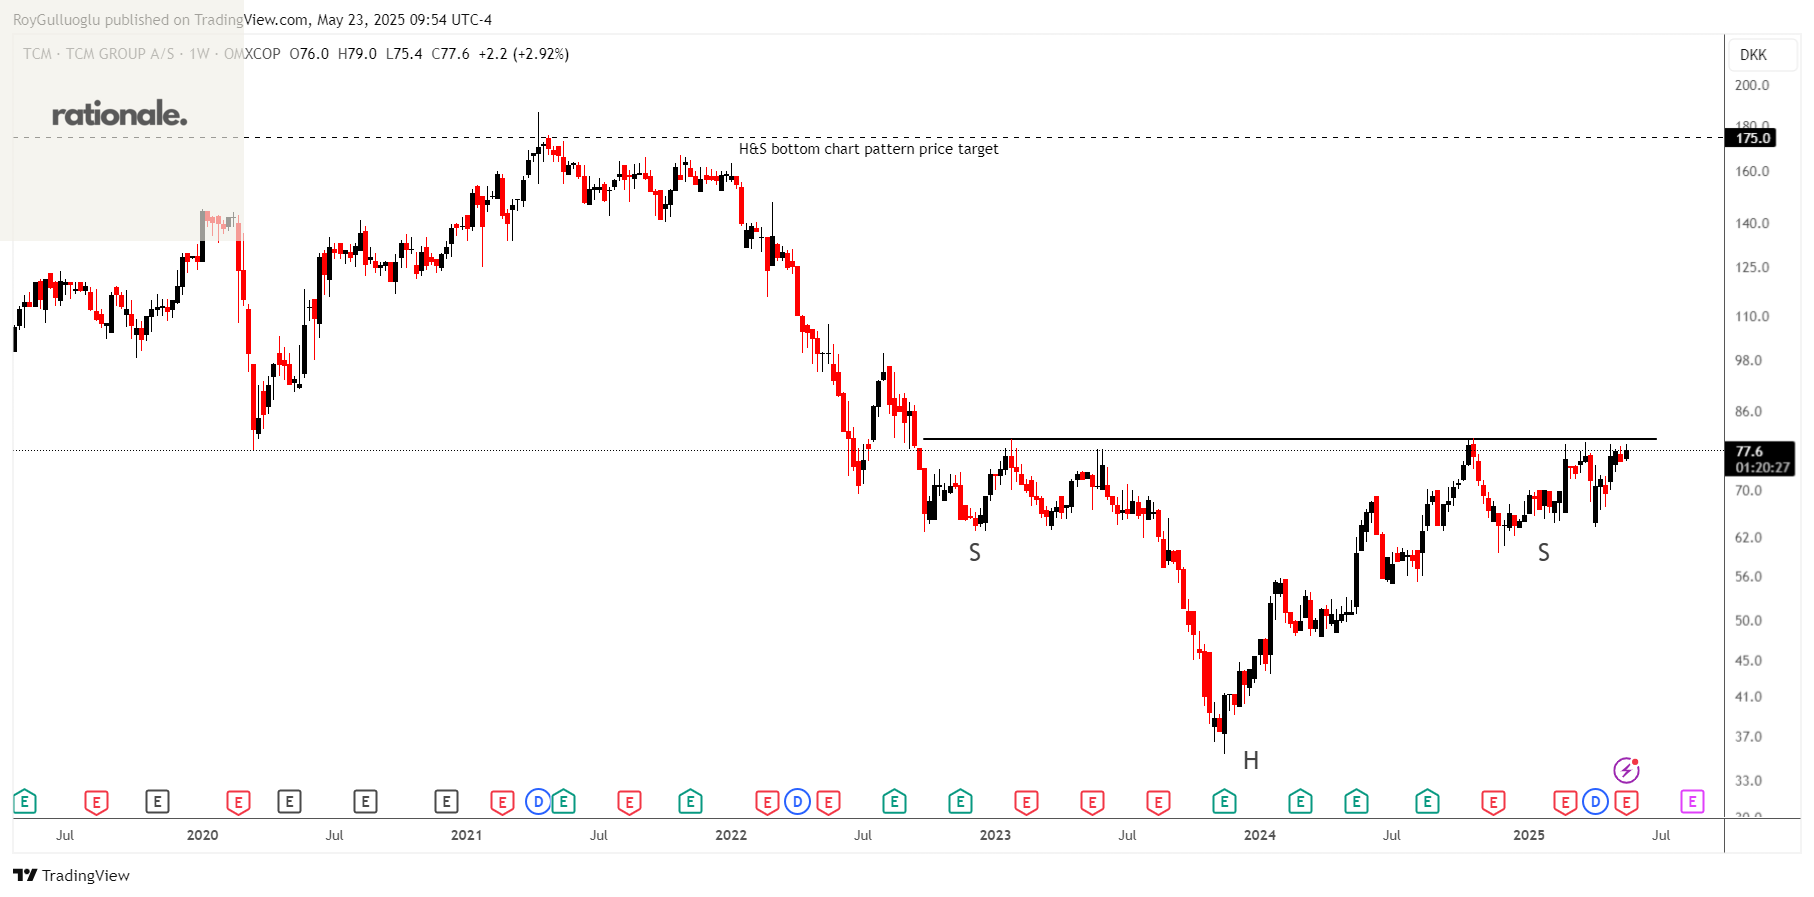
TCM Group A/S manufactures and sells kitchen and furniture products for bathrooms and storage in Denmark, Norway, and internationally.
The above weekly chart formed an approximately 30-month-long H&S bottom chart pattern as a bullish reversal after a downtrend.
The horizontal boundary at 80 levels acts as a resistance within this pattern.
A daily close above 82.4 levels would validate the breakout from the 30-month-long H&S bottom chart pattern.
Based on this chart pattern, the potential price target is 175 levels.
TCM, classified under the "consumer cyclicals" sector, falls under the “Small Cap - Growth” stock category.
Continental Aktiengesellschaft-(CON/XETR)-Long Idea
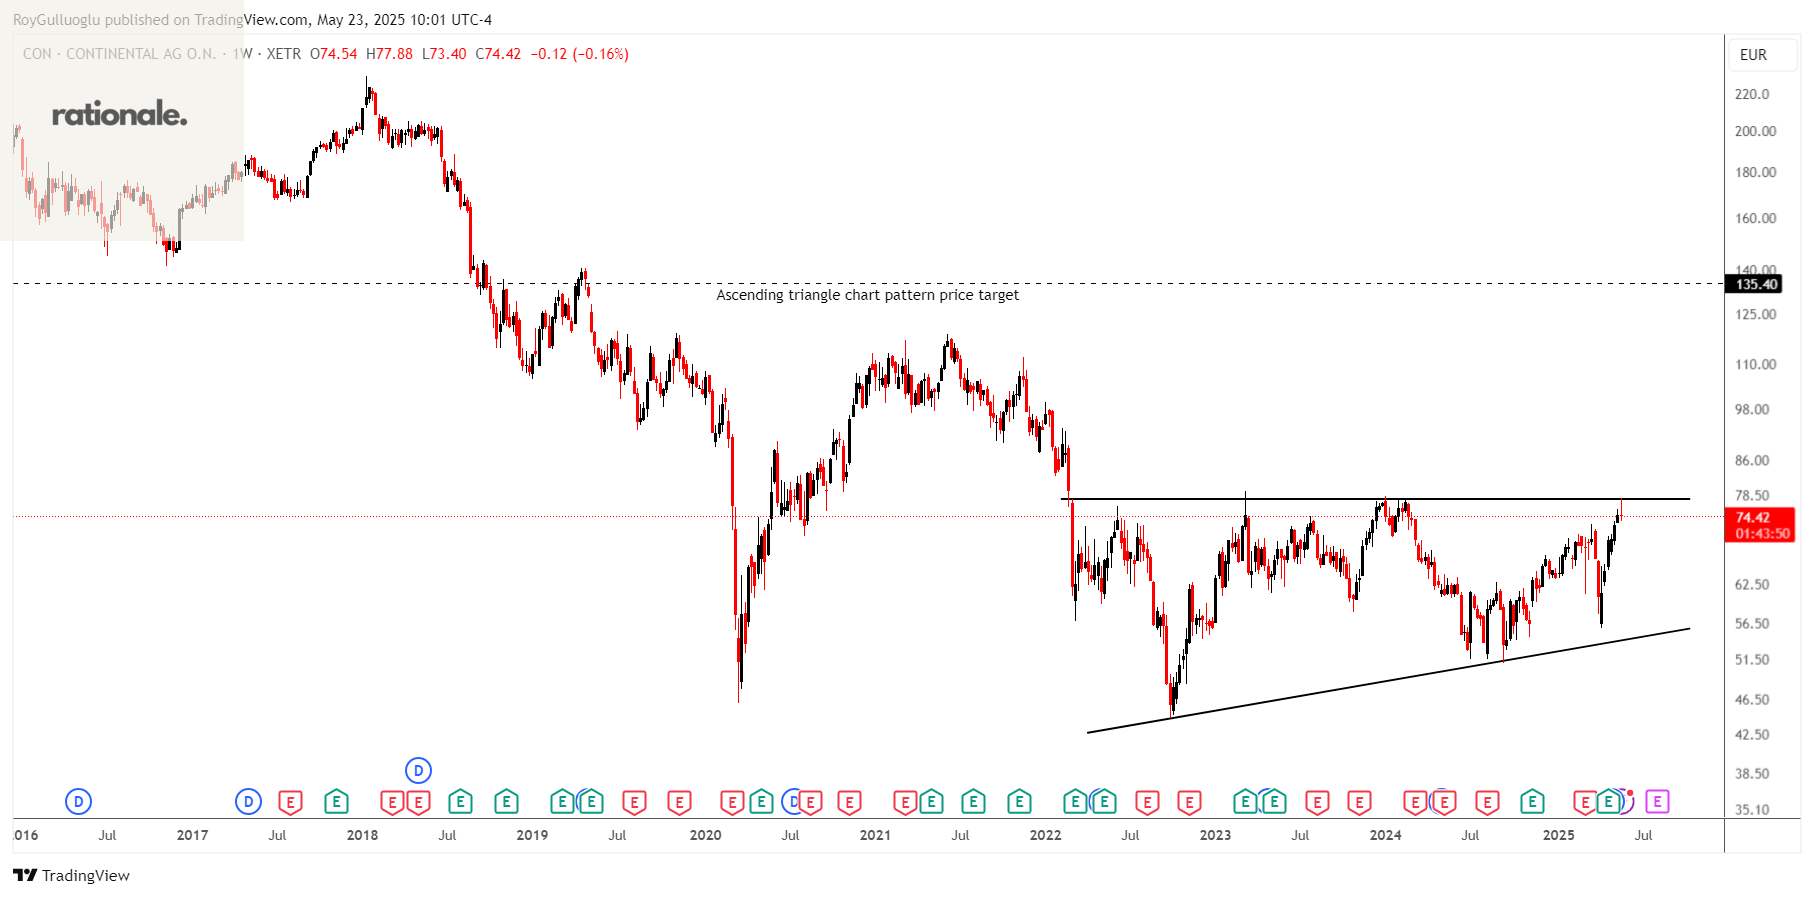
Continental Aktiengesellschaft, a technology company, provides solutions for vehicles, machines, traffic, and transportation worldwide.
The above weekly chart formed an approximately 40-month-long ascending triangle chart pattern as a bullish continuation after an uptrend.
The horizontal boundary at 77.64 levels acts as a resistance within this pattern.
A daily close above 79.9 levels would validate the breakout from the 40-month-long ascending triangle chart pattern.
Based on this chart pattern, the potential price target is 135.4 levels.
CON, classified under the "healthcare" sector, falls under the “Mid Cap - Value” stock category.
Eckert & Ziegler SE-(EUZ/XETR)-Long Idea
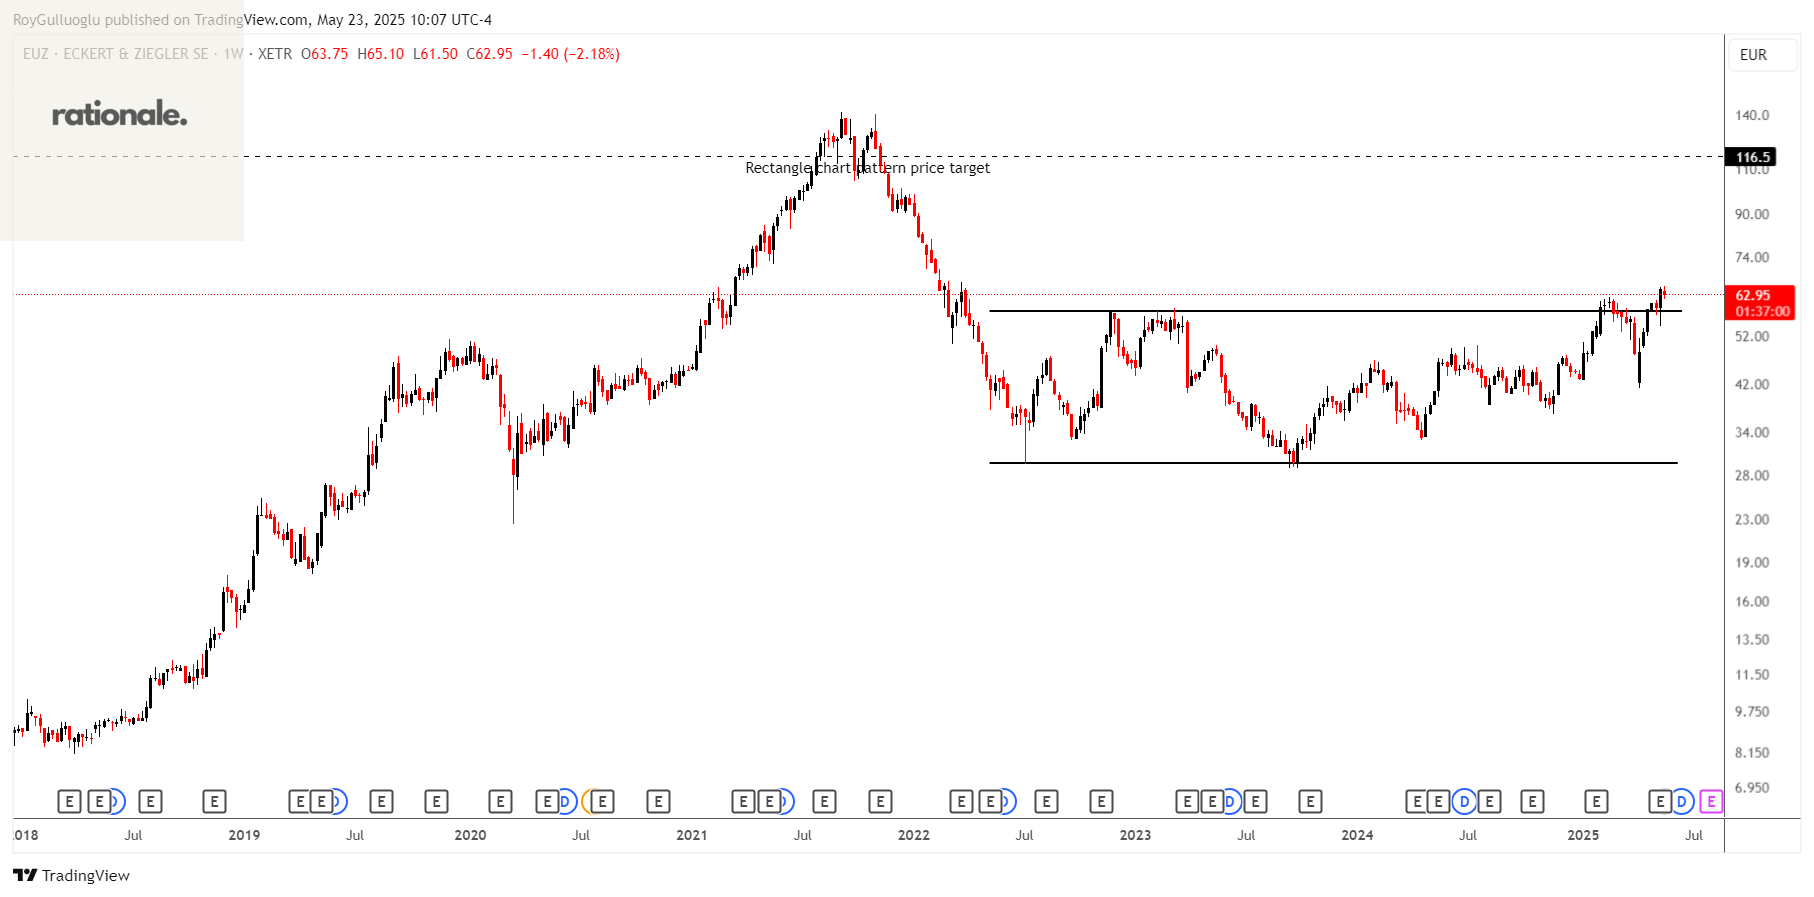
Eckert & Ziegler SE manufactures and sells isotope technology components worldwide. It operates through two segments, Medical and Isotope Products.
The above weekly chart formed an approximately 37-month-long rectangle triangle chart pattern as a bullish reversal after a downtrend.
The horizontal boundary at 58.35 levels acts as a resistance within this pattern.
A daily close above 60.1 levels would validate the breakout from the 37-month-long rectangle triangle chart pattern.
Based on this chart pattern, the potential price target is 116.5 levels.
EUZ, classified under the "healthcare" sector, falls under the “Small Cap - Value” stock category.
Tryg A/S-(TRYG/OMXCOP)-Long Idea
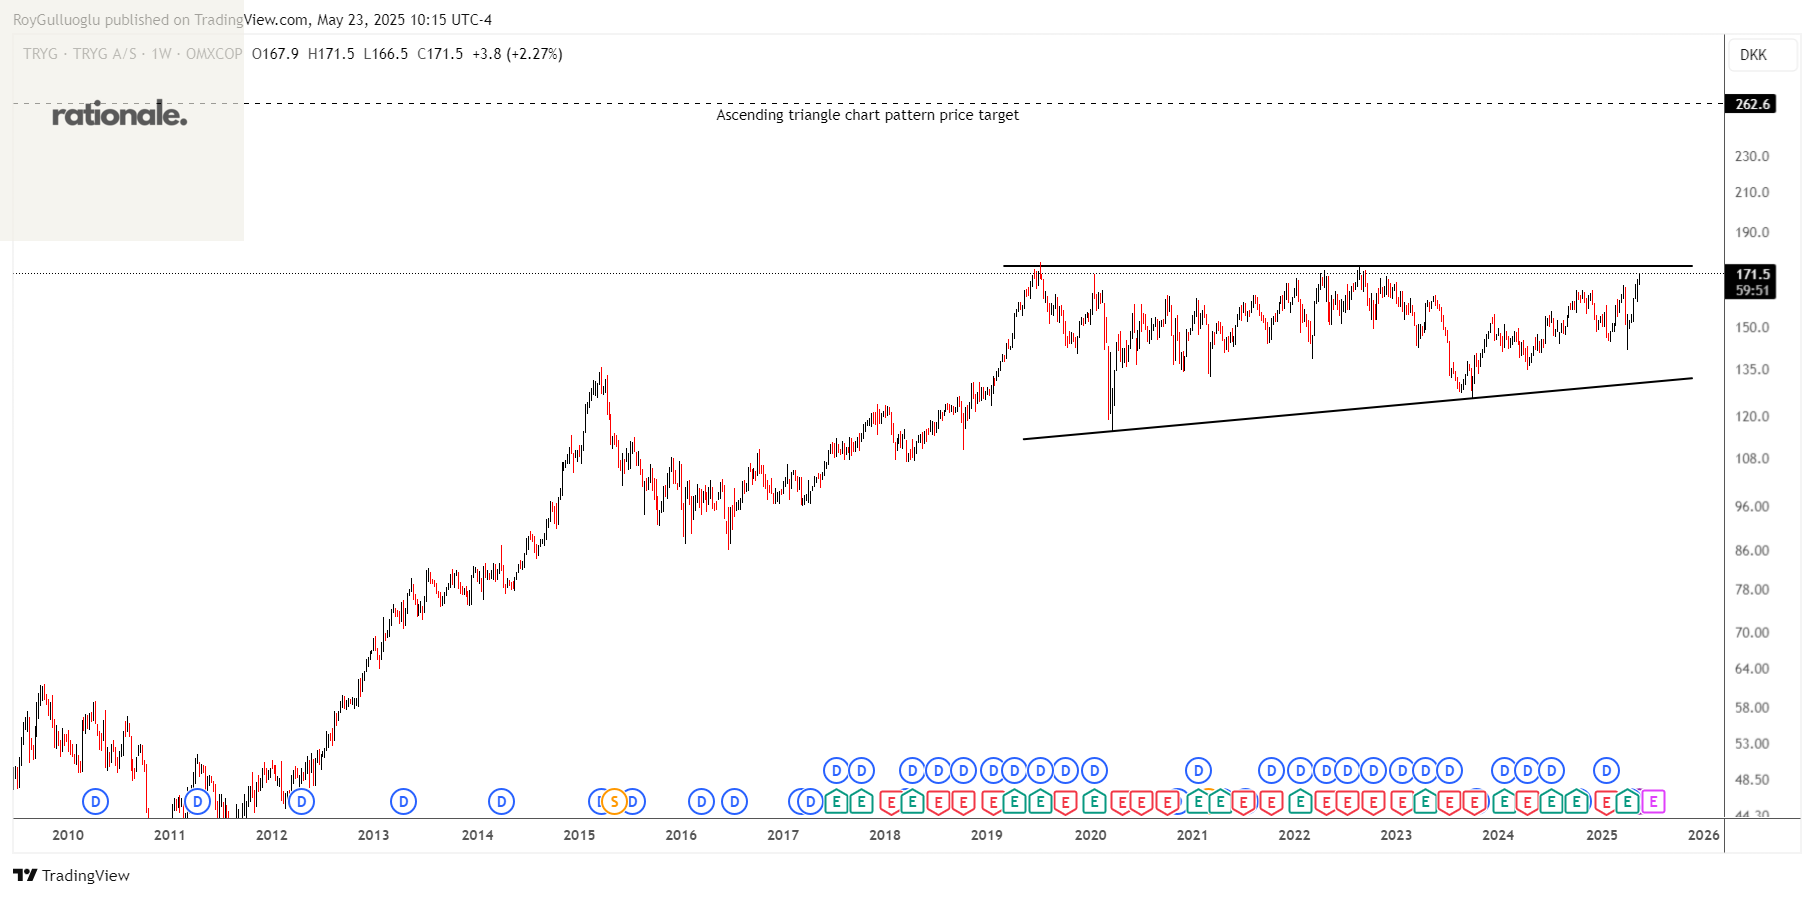
Tryg A/S, together with its subsidiaries, provides insurance products and services for private and corporate customers, and small and medium-sized businesses in Denmark, Sweden, the United Kingdom, and Norway.
The above weekly chart formed an approximately 75-month-long ascending triangle chart pattern as a bullish continuation after an uptrend.
The horizontal boundary at 174.9 levels acted as a resistance within this pattern.
A daily close above 180.15 levels validated the breakout from the 75-month-long ascending triangle chart pattern.
Based on this chart pattern, the potential price target is 262.6 levels.
TRYG, classified under the "financial services" sector, falls under the “Large Cap - Income” stock category.
Teşekkürler Roy