

Trade Ideas Equities
WRLD(NASDAQ), TBBB(NASDAQ), MCY(NYSE), UAN(NYSE), OI(NYSE), KTOS(NASDAQ)

World Acceptance Corporation-(WRLD/NASDAQ)-Long Idea
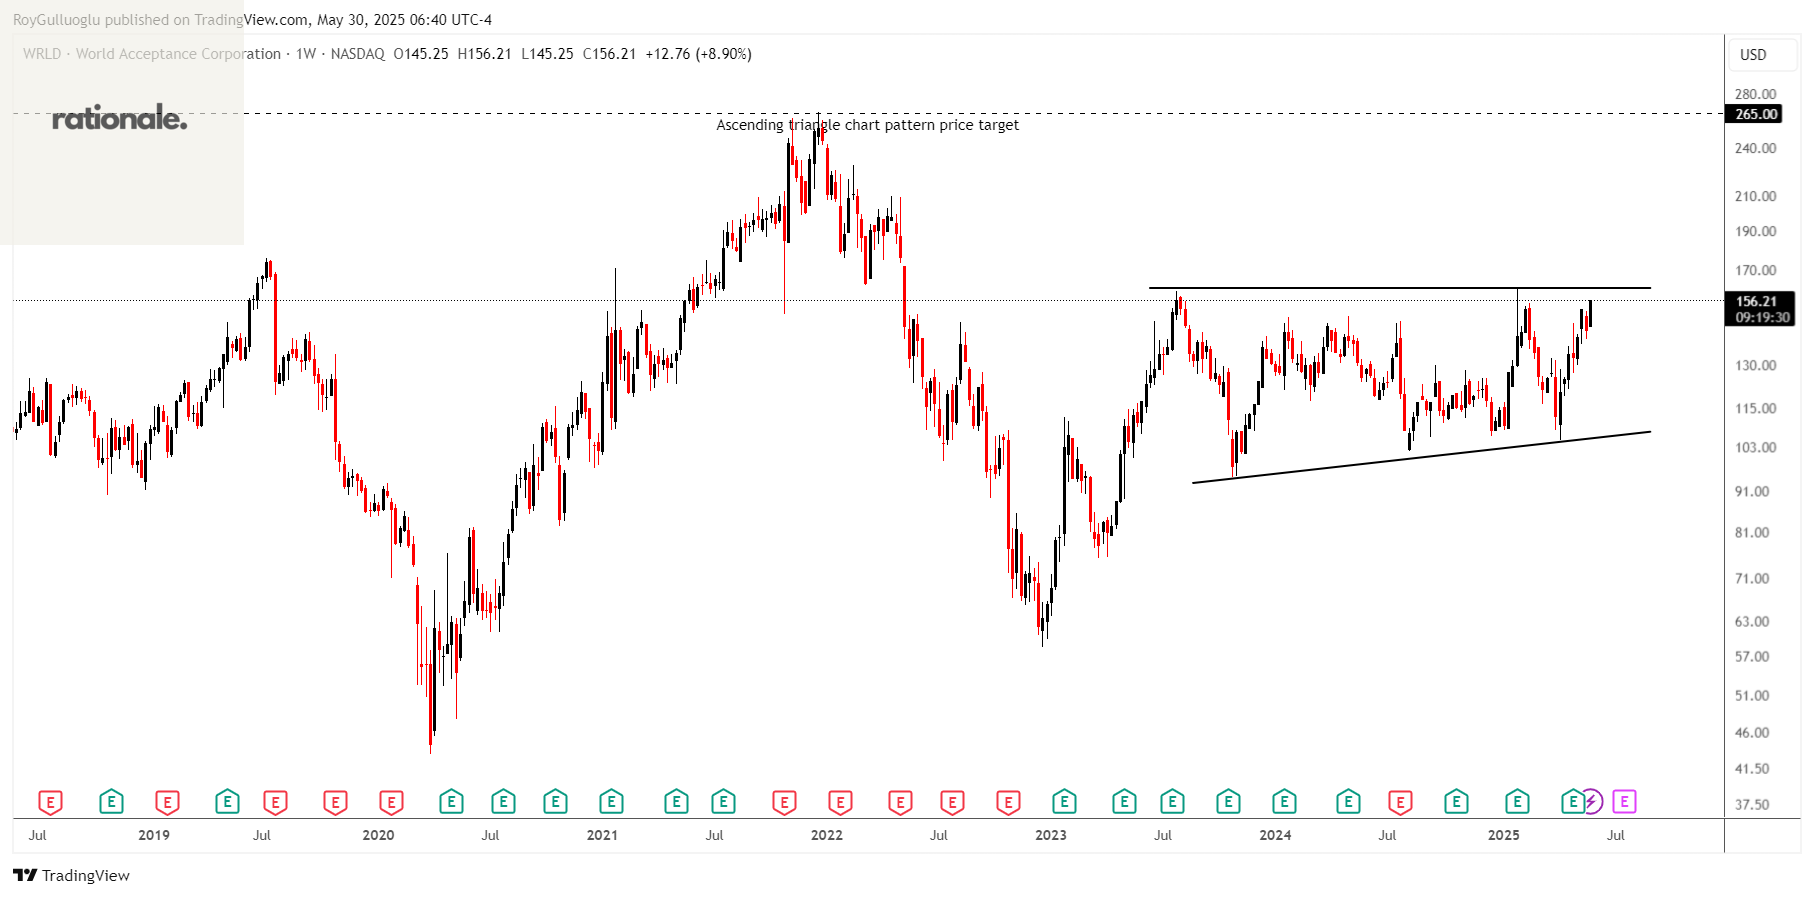
World Acceptance Corporation engages in consumer finance business in the United States. The company offers short-term small installment loans, medium-term larger installment loans, related credit insurance, and ancillary products and services to individuals.
The above weekly chart formed an approximately 25-month-long ascending triangle chart pattern as a bullish continuation after an uptrend.
The horizontal boundary at 161.6 levels acts as a resistance within this pattern.
A daily close above 166.44 levels would validate the breakout from the 25-month-long ascending triangle chart pattern.
Based on this chart pattern, the potential price target is 265 levels.
WRLD, classified under the "financial services" sector, falls under the “Small Cap - Income” stock category.
BBB Foods Inc.-(TBBB/NASDAQ)-Long Idea
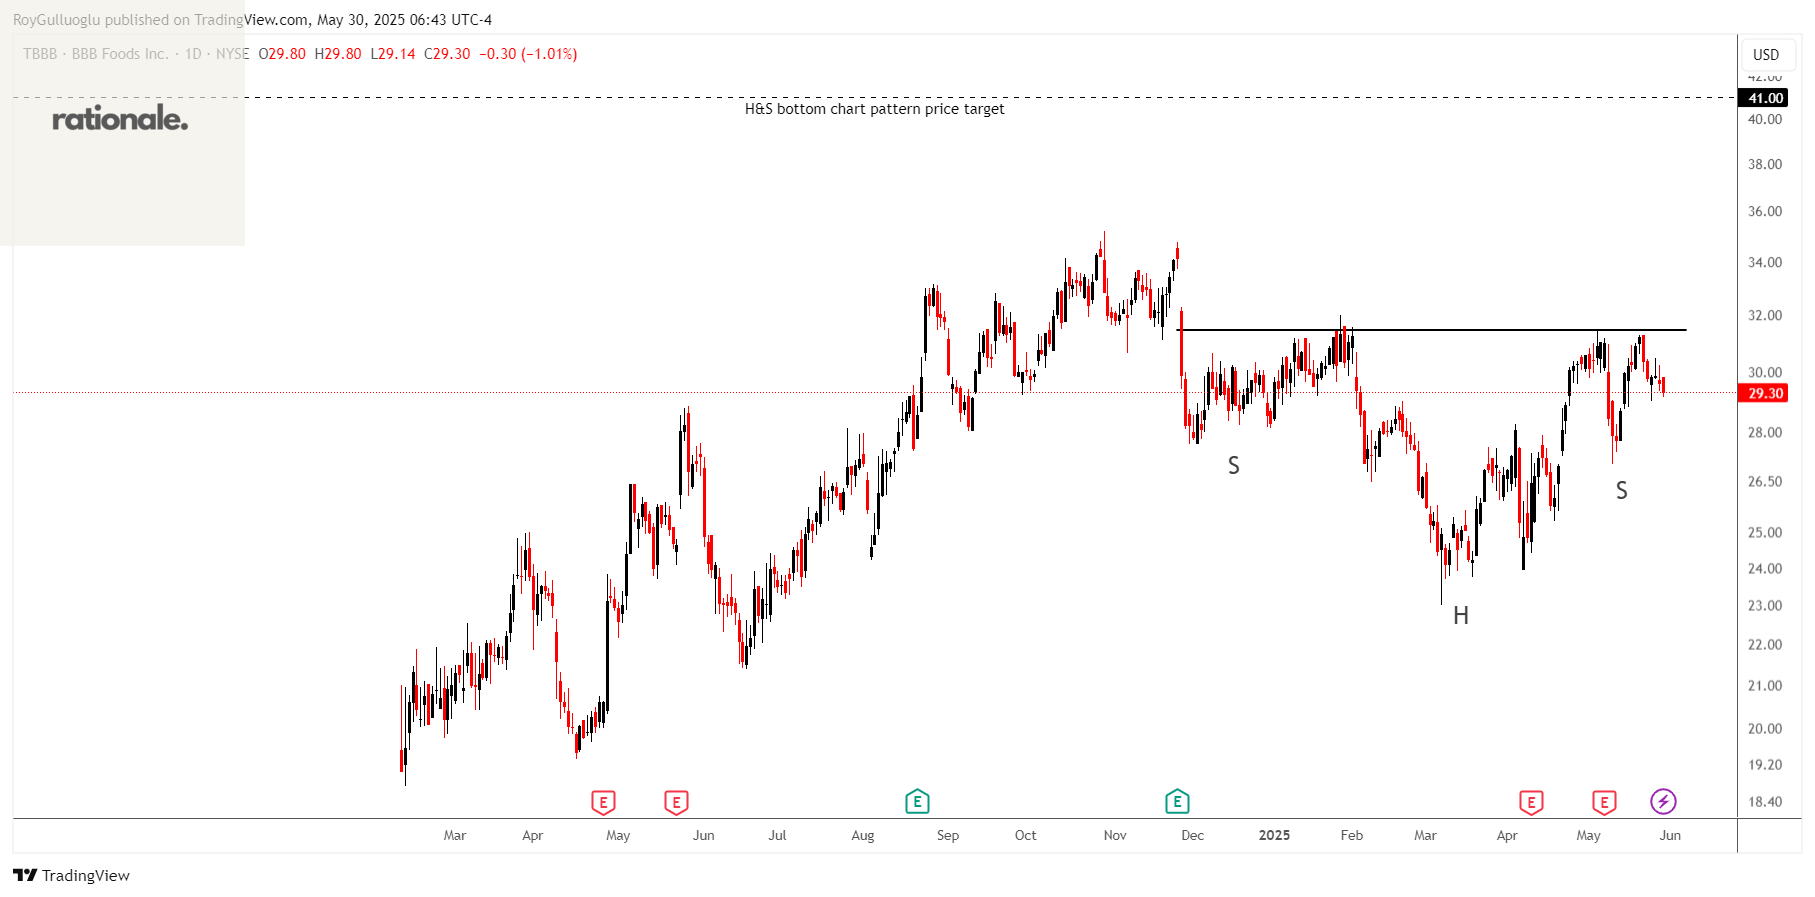
BBB Foods Inc., through its subsidiaries, operates a chain of grocery retail stores in Mexico. The company offers spot products comprising food and non-food products such as clothing, electronics, household goods, and others.
The above daily chart formed an approximately 4-month-long H&S bottom chart pattern as a bullish reversal after a downtrend.
The horizontal boundary at 31.47 levels acts as a resistance within this pattern.
A daily close above 32.41 levels would validate the breakout from the 4-month-long H&S bottom chart pattern.
Based on this chart pattern, the potential price target is 41 levels.
TBBB, classified under the "consumer defensive" sector, falls under the “Mid Cap - Value” stock category.
Mercury General Corporation-(MCY/NYSE)-Long Idea
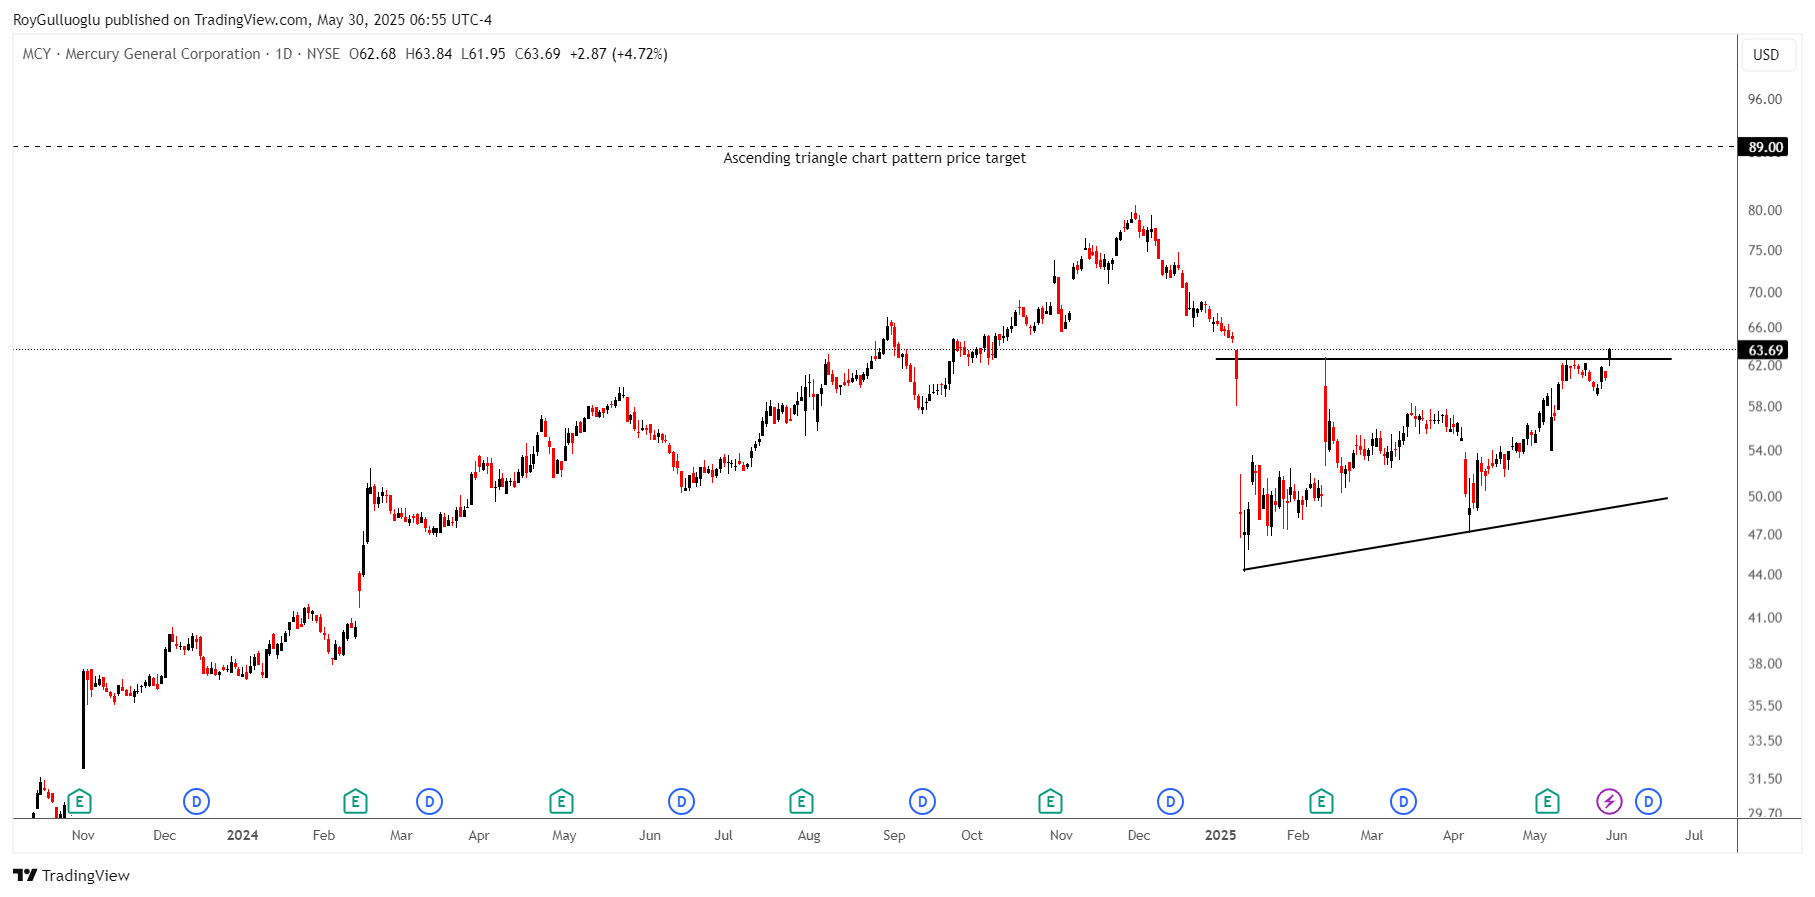
Mercury General Corporation, together with its subsidiaries, engages in writing personal automobile insurance in the United States.
The above daily chart formed an approximately 3-month-long ascending triangle chart pattern as a bullish reversal after a downtrend.
The horizontal boundary at 62.67 levels acts as a resistance within this pattern.
A daily close above 64.55 levels would validate the breakout from the 3-month-long ascending triangle chart pattern.
Based on this chart pattern, the potential price target is 89 levels.
MCY, classified under the "financial services" sector, falls under the “Mid Cap - Income” stock category.
CVR Partners, LP-(UAN/NYSE)-Long Idea
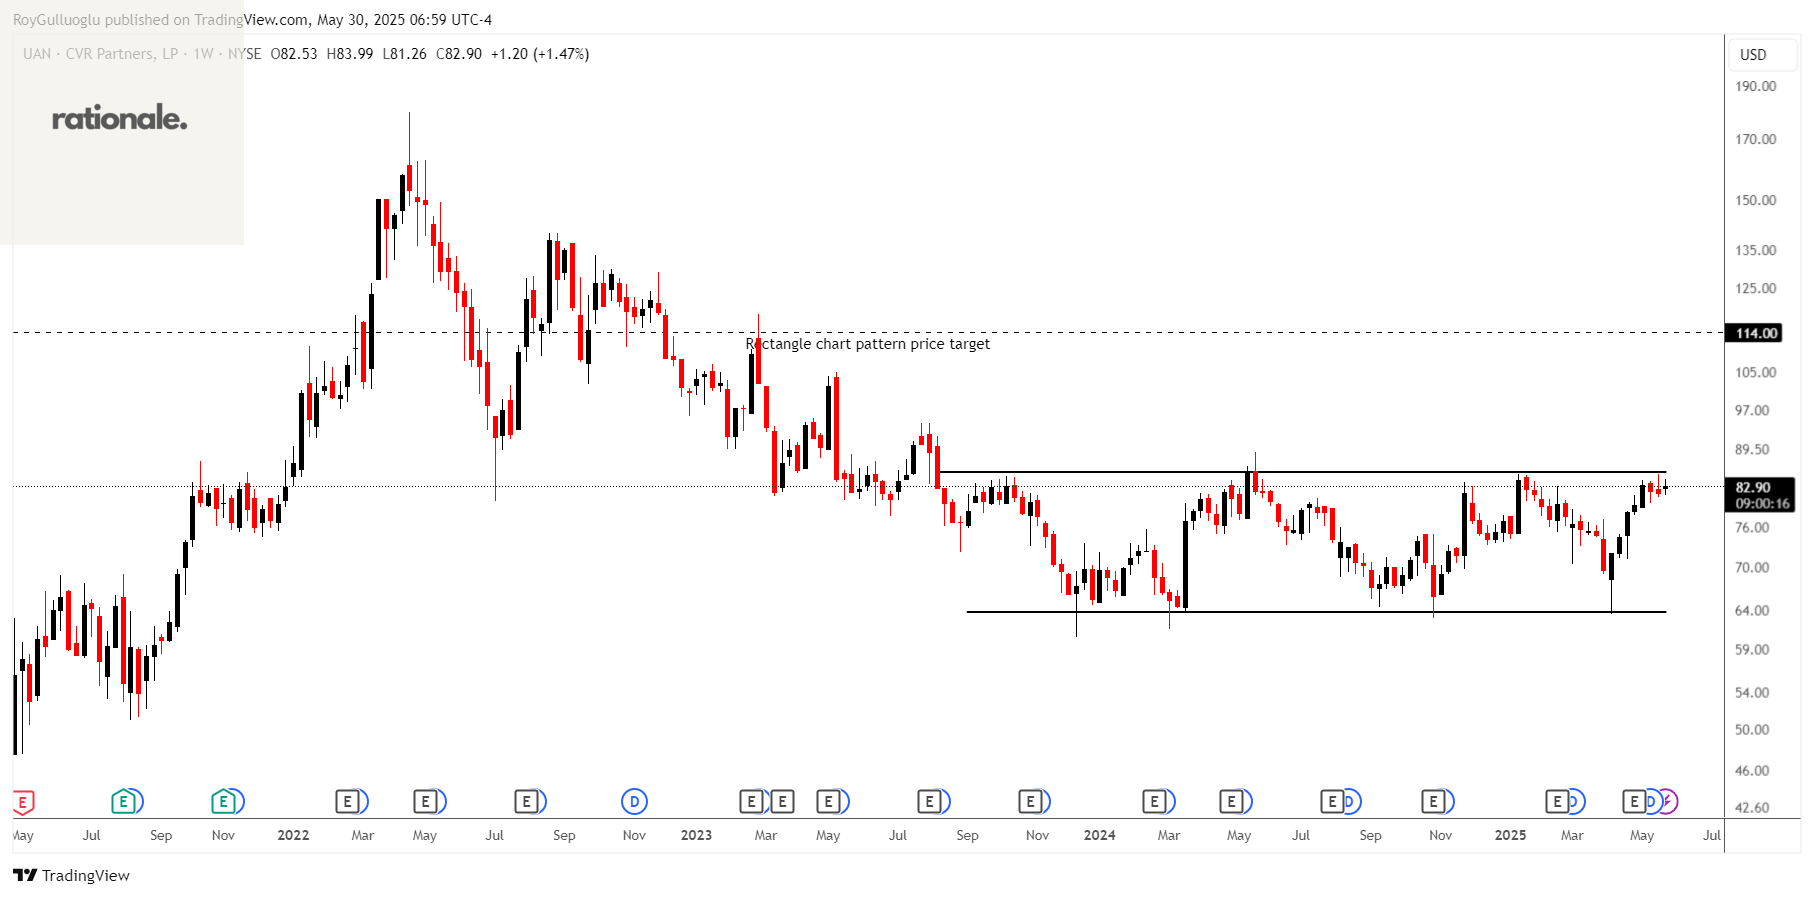
CVR Partners, LP, together with its subsidiaries, engages in the production and sale of nitrogen fertilizer in the United States.
The above weekly chart formed an approximately 20-month-long rectangle chart pattern as a bullish reversal after a downtrend.
The horizontal boundary at 85.18 levels acts as a resistance within this pattern.
A daily close above 87.73 levels would validate the breakout from the 20-month-long rectangle chart pattern.
Based on this chart pattern, the potential price target is 114 levels.
UAN, classified under the "basic materials" sector, falls under the “Small Cap - Value” stock category.
O-I Glass, Inc.-(OI/NYSE)-Long Idea
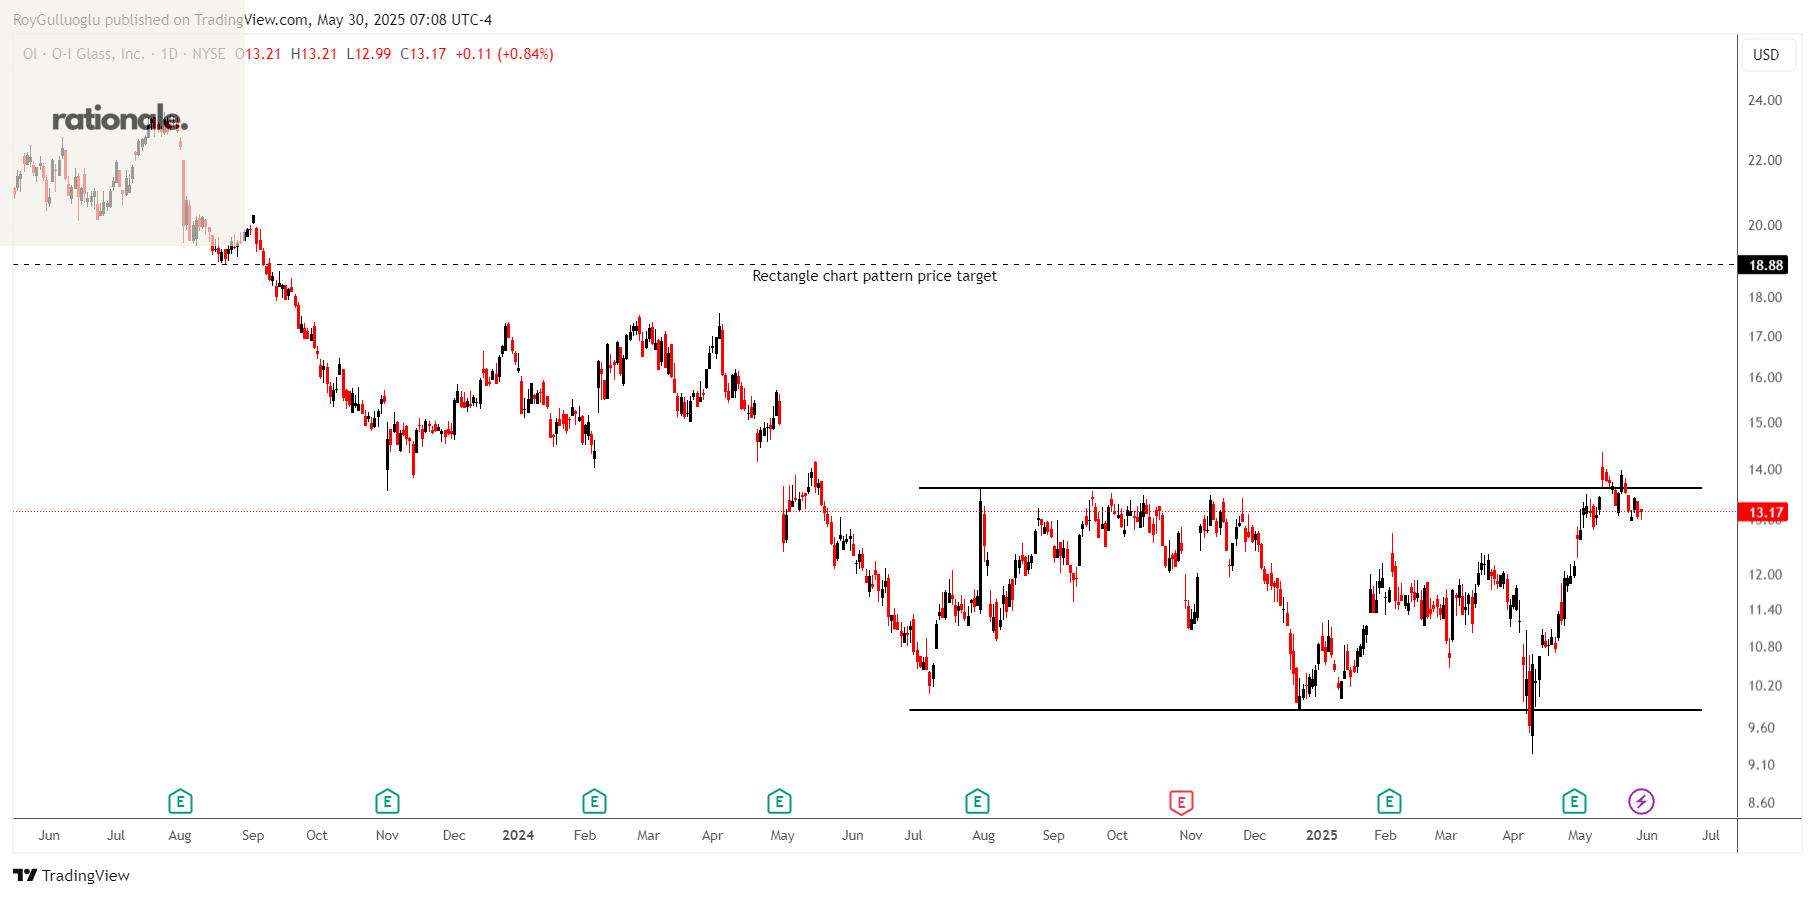
O-I Glass, Inc., through its subsidiaries, engages in the manufacture and sale of glass containers to food and beverage manufacturers primarily in the Americas, Europe, and internationally
The above daily chart formed an approximately 7-month-long rectangle chart pattern as a bullish reversal after a downtrend.
The horizontal boundary at 13.61 levels acts as a resistance within this pattern.
A daily close above 14 levels would validate the breakout from the 7-month-long rectangle chart pattern.
Based on this chart pattern, the potential price target is 18.88 levels.
OI, classified under the "consumer cyclical" sector, falls under the “Mid Cap - Growth” stock category.
Kratos Defense & Security Solutions, Inc.-(KTOS/NASDAQ)-Long Idea
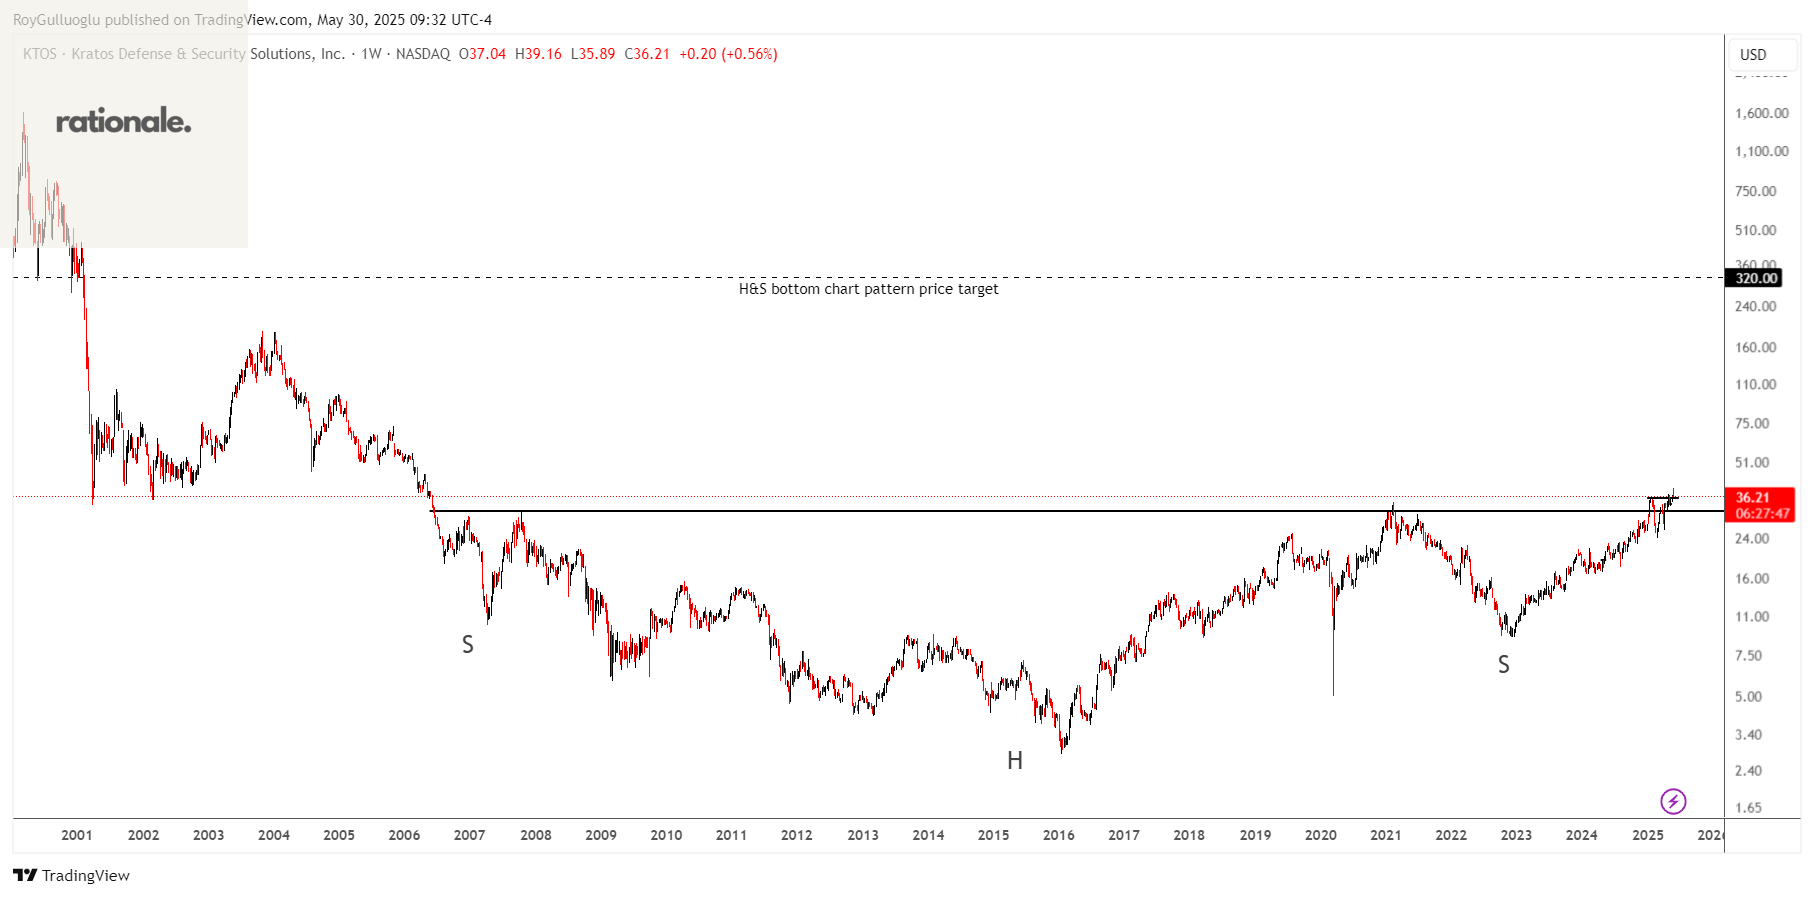
Kratos Defense & Security Solutions, Inc., a technology company, provides technology, products, and system and software for the defense, national security, and commercial markets in the United States, other North America, the Asia Pacific, the Middle East, Europe, and Internationally.
The above weekly chart formed an approximately 18-year-long H&S bottom chart pattern as a bullish reversal after a downtrend.
The horizontal boundary at 31 levels acted as a resistance within this pattern.
A daily close above 32 levels validated the breakout from the 18-year-long H&S bottom chart pattern.
Based on this chart pattern, the potential price target is 320 levels.
KTOS, classified under the "industrials" sector, falls under the “Mid Cap - Value” stock category.