

Trade Ideas Equities
MRCY(NASDAQ), SFM(NASDAQ), HIMS(NYSE), CGNT(NASDAQ), KNSA(NASDAQ), CALM(NASDAQ)

Mercury Systems, Inc.-(MRCY/NASDAQ)-Long Idea
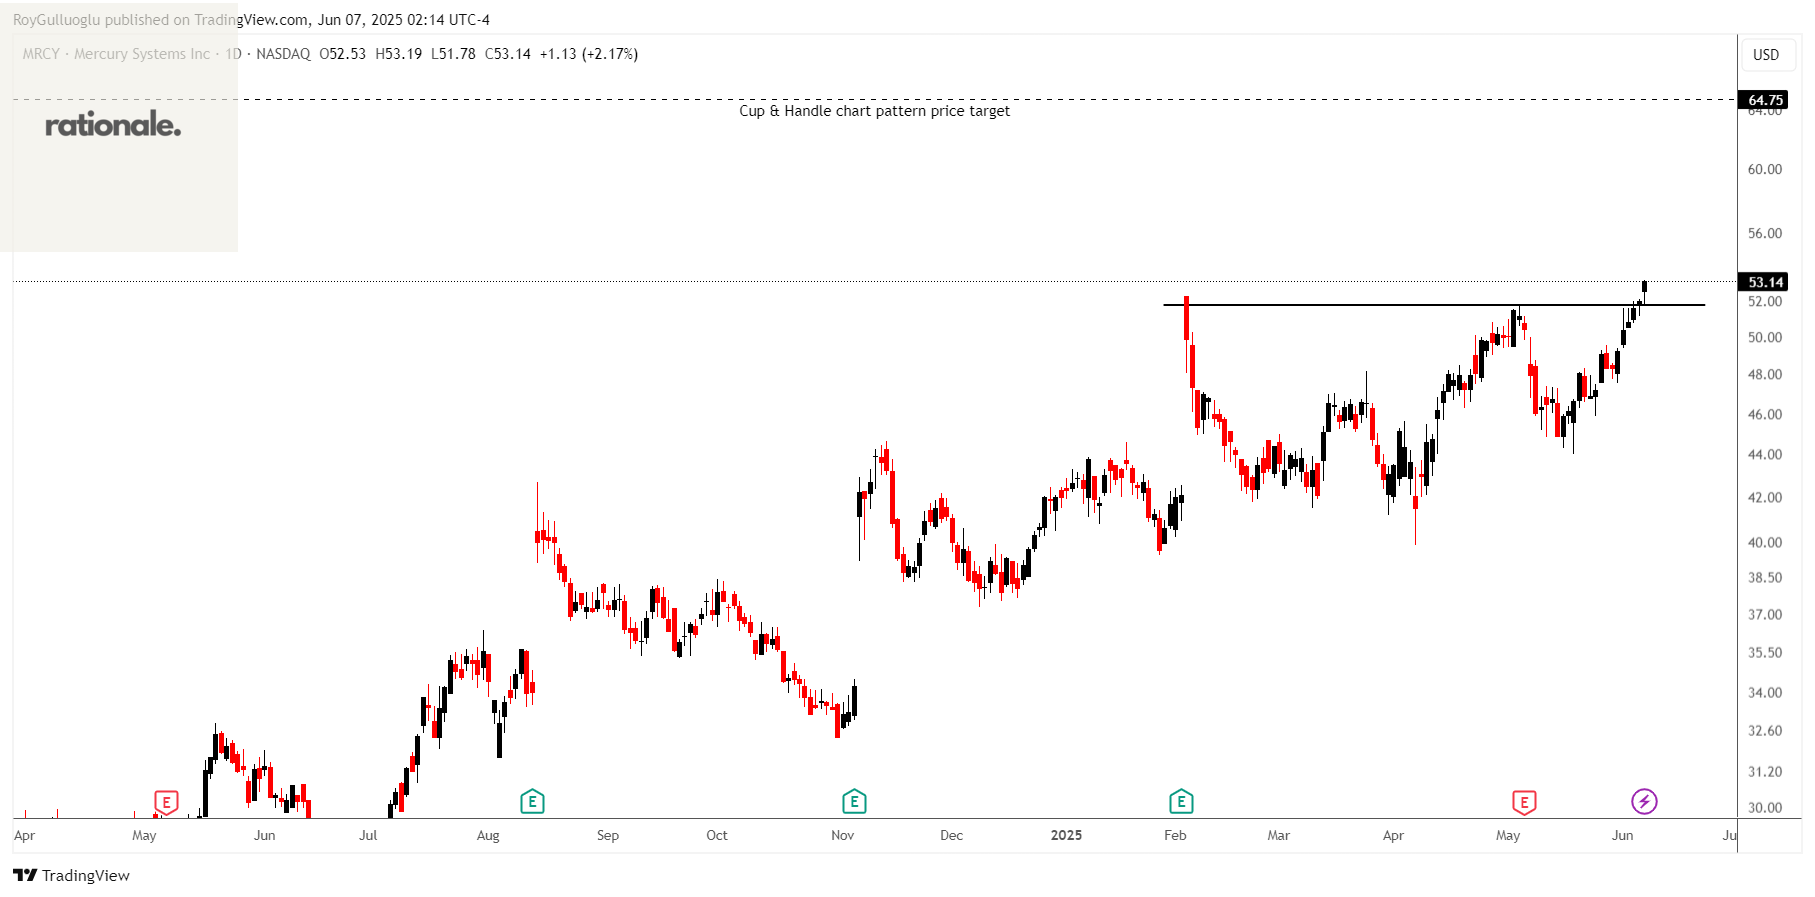
Mercury Systems, Inc., a technology company, manufactures and sells components, products, modules, and subsystems for defense prime contractors, the U.S. government, and original equipment manufacturers commercial aerospace companies.
The above daily chart formed an approximately 3-month-long cup & handle chart pattern as a bullish continuation after an uptrend.
The horizontal boundary at 51.74 levels acts as a resistance within this pattern.
A daily close above 53.3 levels would validate the breakout from the 3-month-long cup & handle chart pattern.
Based on this chart pattern, the potential price target is 64.75 levels.
MRCY, classified under the "industrials" sector, falls under the “Mid Cap - Value” stock category.
Sprouts Farmers Market, Inc.-(SFM/NASDAQ)-Long Idea
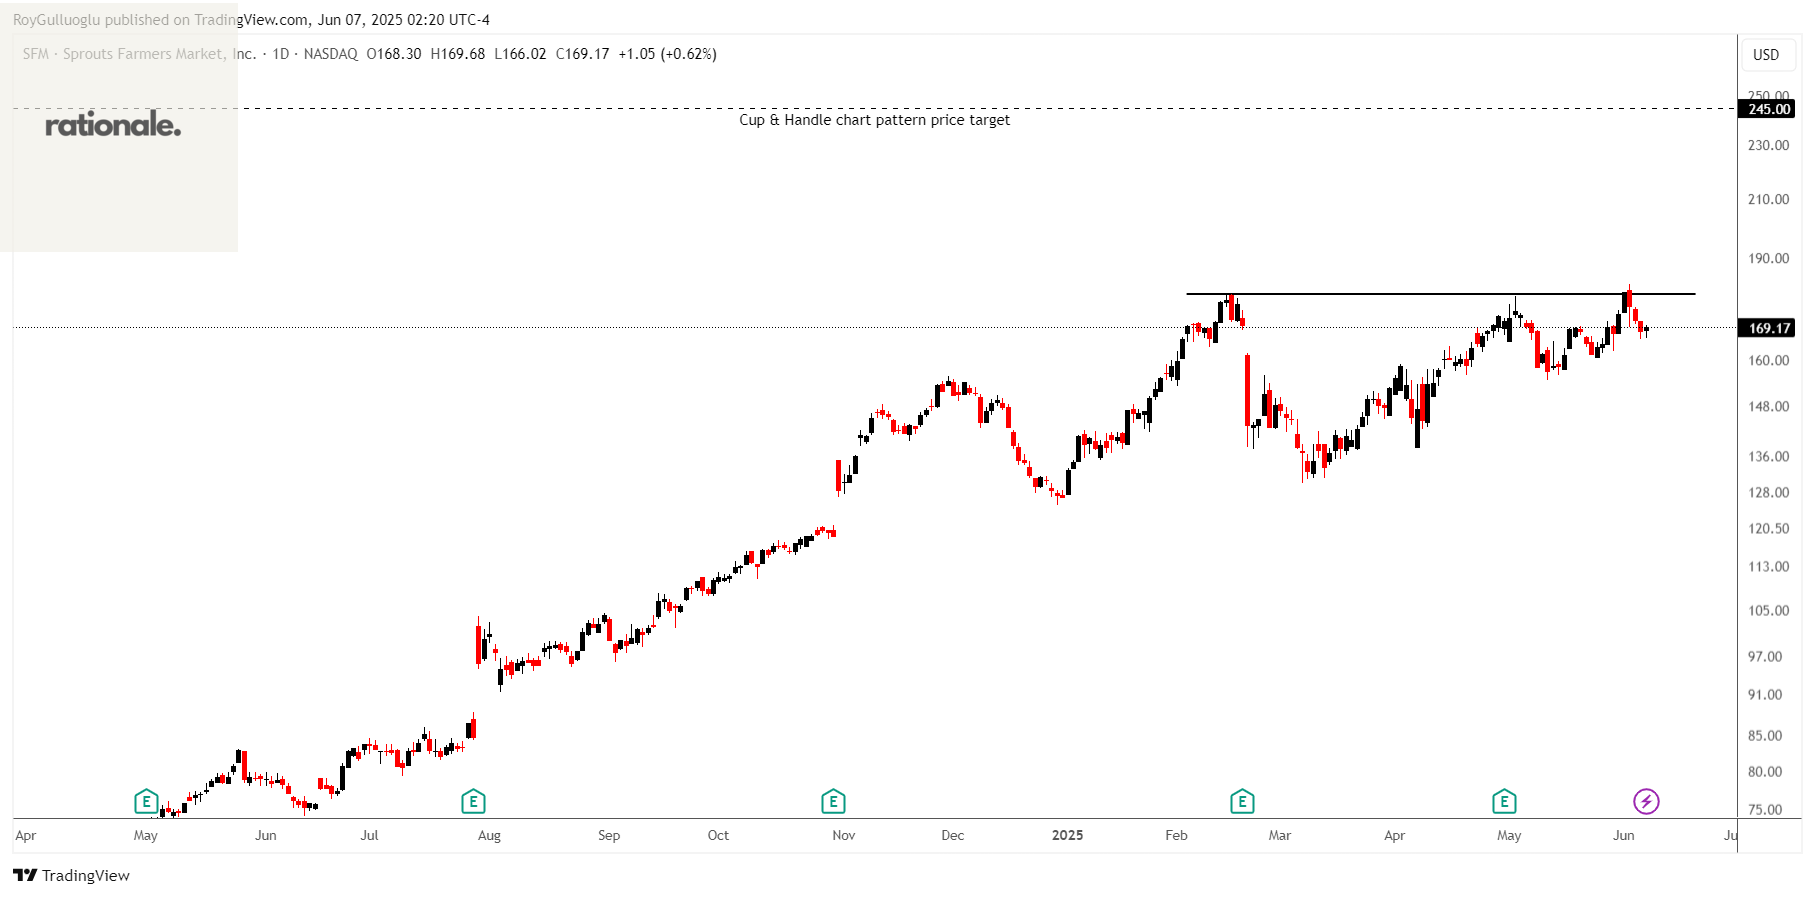
Sprouts Farmers Market, Inc., together with its subsidiaries, engages in the retailing of fresh, natural, and organic food products in the United States.
The above daily chart formed an approximately 3-month-long cup & handle chart pattern as a bullish continuation after an uptrend.
The horizontal boundary at 178.8 levels acts as a resistance within this pattern.
A daily close above 184.15 levels would validate the breakout from the 3-month-long cup & handle chart pattern.
Based on this chart pattern, the potential price target is 245 levels.
SFM, classified under the "consumer defensive" sector, falls under the “Large Cap - Value” stock category.
Hims & Hers Health, Inc.-(HIMS/NYSE)-Long Idea
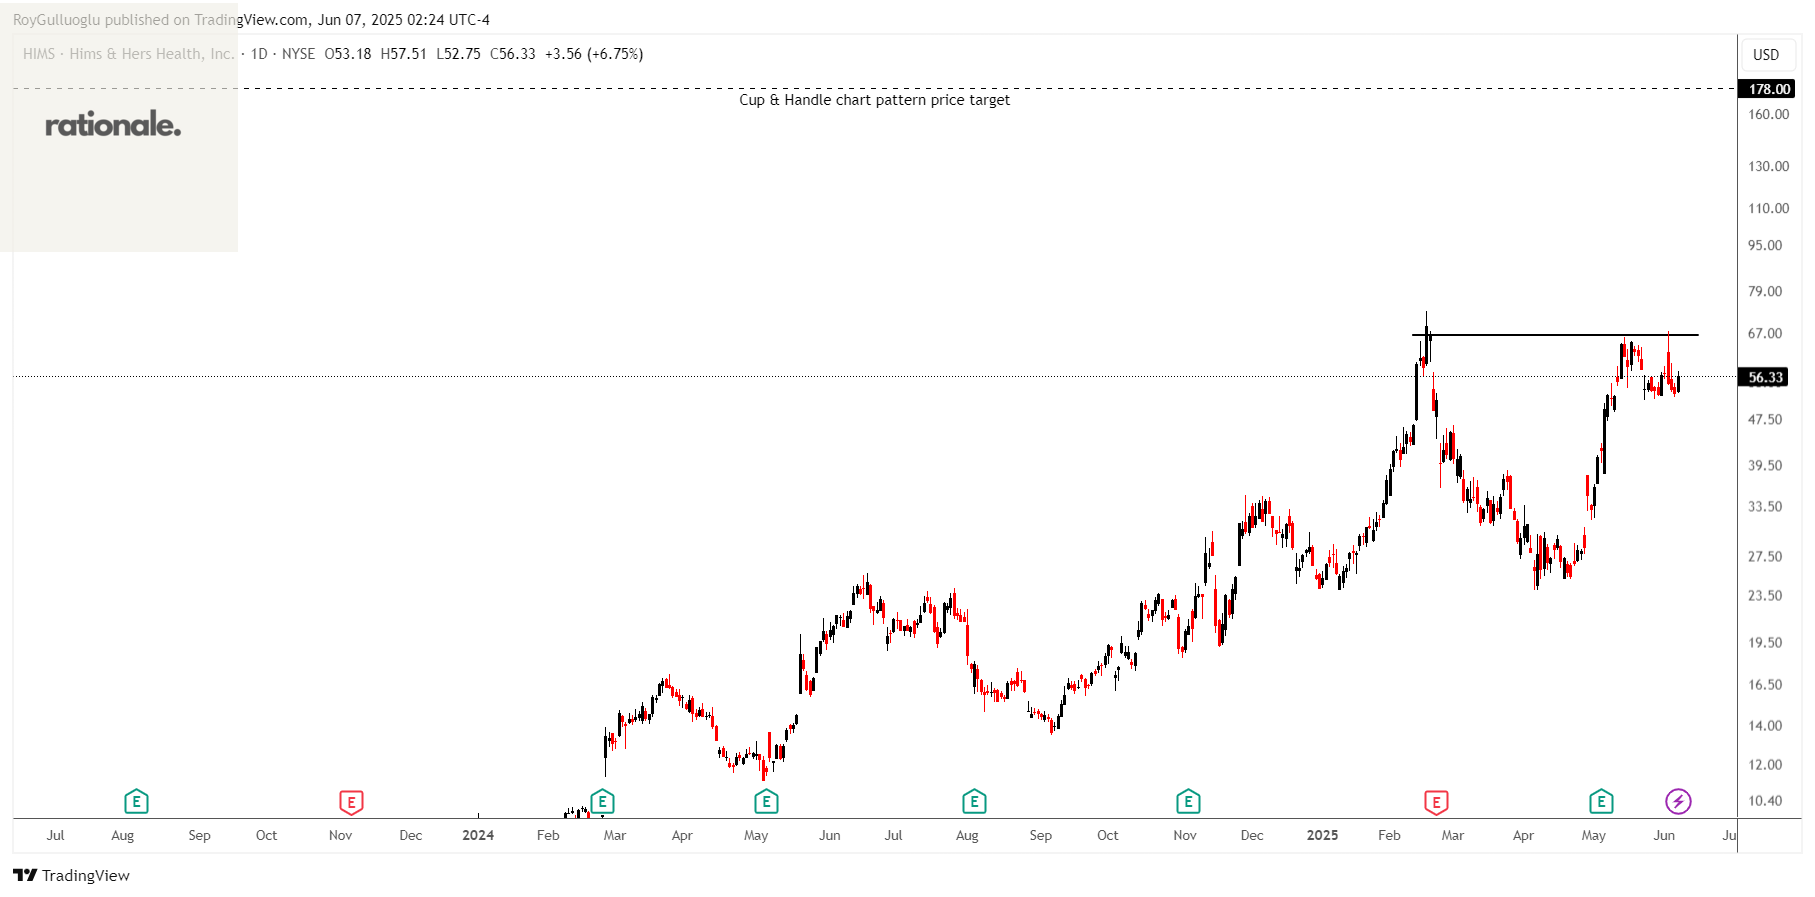
Mercury General Corporation, together with its subsidiaries, engages in writing personal automobile insurance in the United States.
The above daily chart formed an approximately 3-month-long cup & handle chart pattern as a bullish continuation after an uptrend.
The horizontal boundary at 66.3 levels acts as a resistance within this pattern.
A daily close above 68.3 levels would validate the breakout from the 3-month-long cup & handle chart pattern.
Based on this chart pattern, the potential price target is 178 levels.
HIMS, classified under the "consumer defensive" sector, falls under the “Large Cap-Value” stock category.
Cognyte Software Ltd.-(CGNT/NASDAQ)-Long Idea
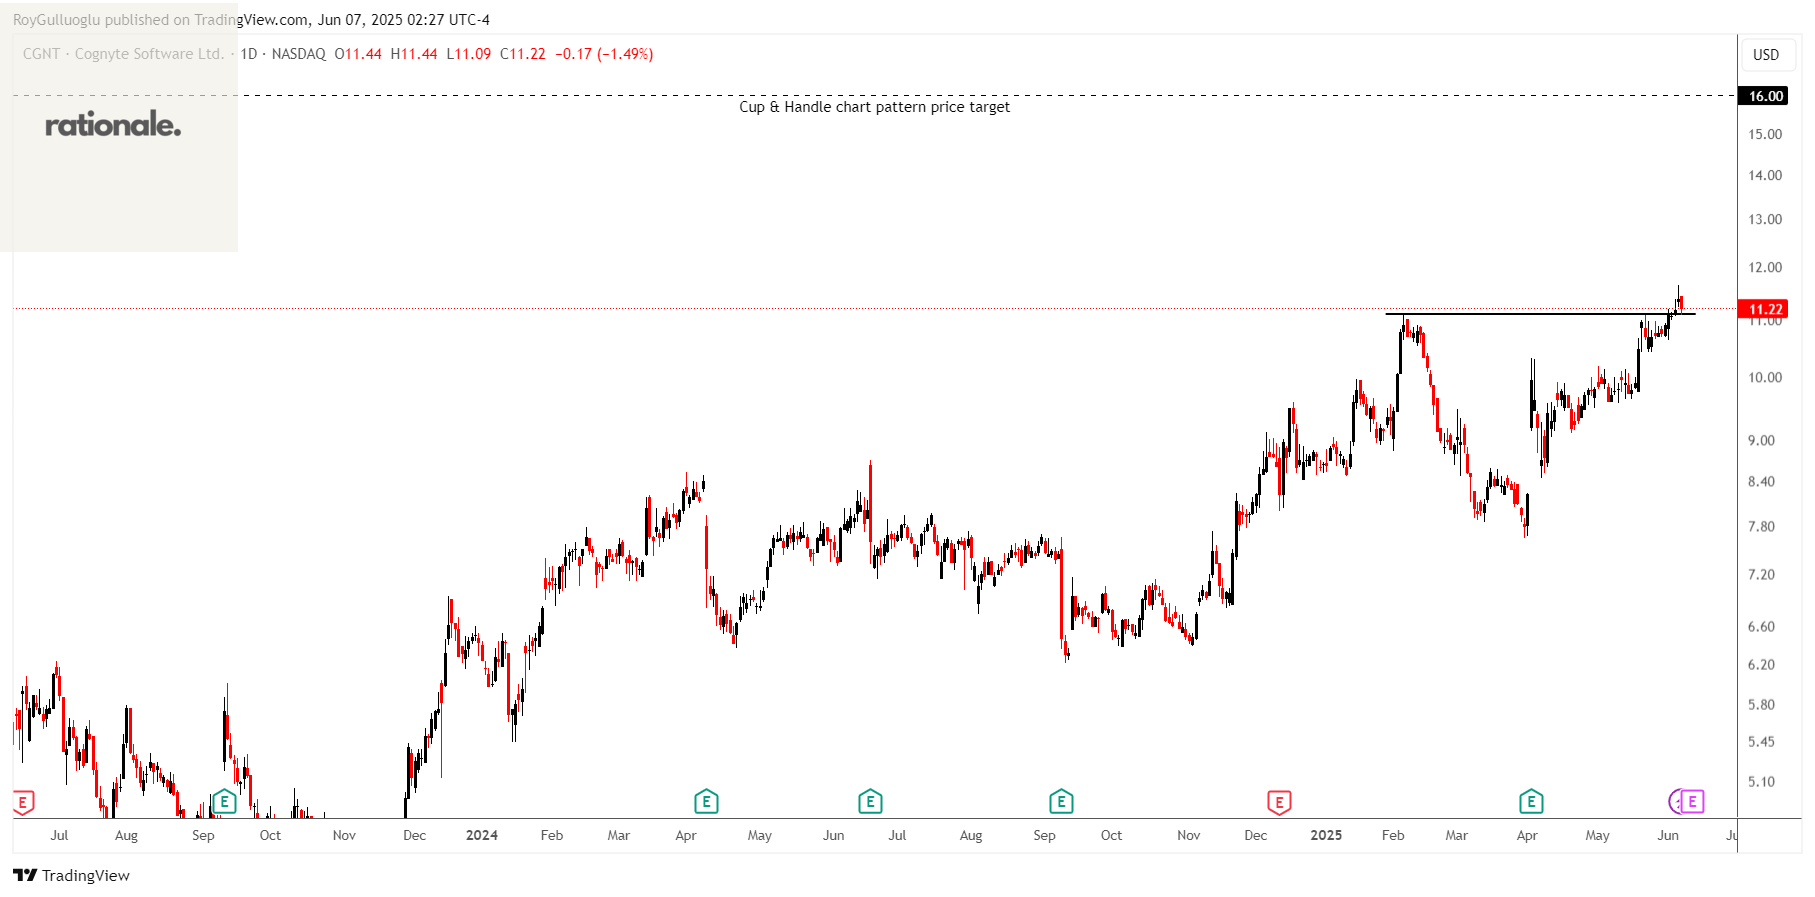
Cognyte Software Ltd., a software-led technology company, focuses on solutions for data processing and analytics worldwide.
The above daily chart formed an approximately 3-month-long cup & handle chart pattern as a bullish continuation after an uptrend.
The horizontal boundary at 11.1 levels acts as a resistance within this pattern.
A daily close above 11.43 levels would validate the breakout from the 3-month-long ascending triangle chart pattern.
Based on this chart pattern, the potential price target is 16 levels.
CGNT, classified under the "technology" sector, falls under the “Small Cap-Growth” stock category.
Kiniksa Pharmaceuticals International, plc-(KNSA/NASDAQ)-Long Idea
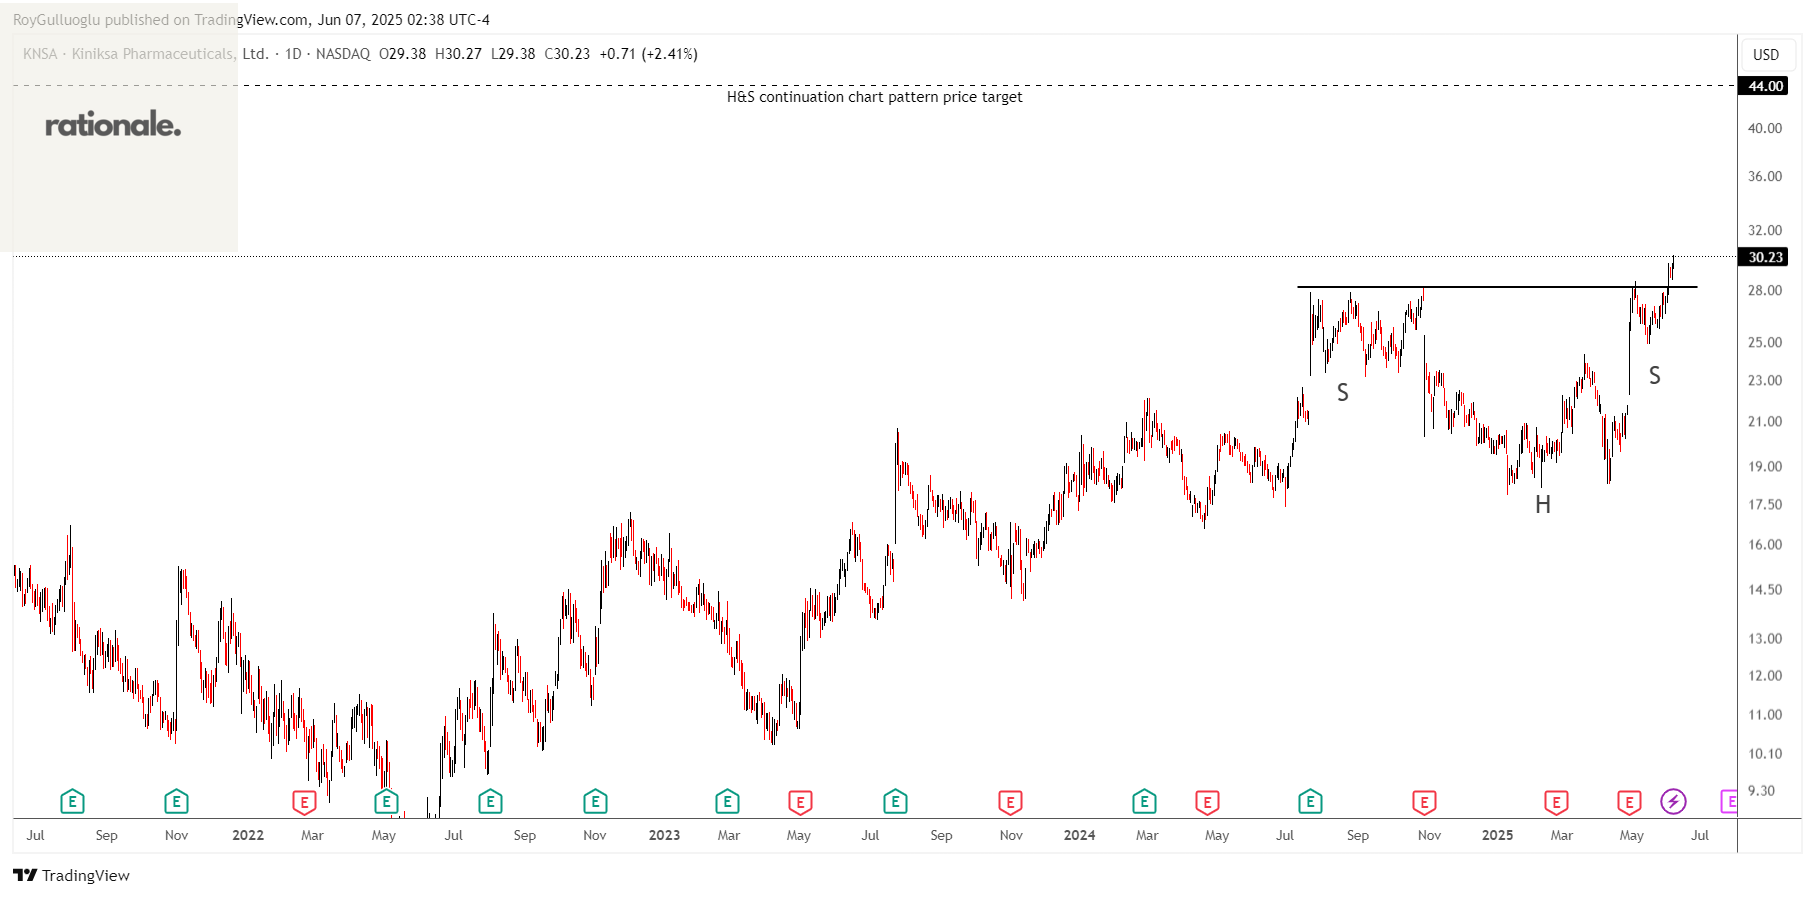
Kiniksa Pharmaceuticals International, plc, a biopharmaceutical company, developing and commercializing novel therapies for diseases with unmet need and focuses on cardiovascular indications worldwide.
The above daily chart formed an approximately 7-month-long H&S continuation chart pattern as a bullish continuation after an uptrend.
The horizontal boundary at 28.2 levels acteds as a resistance within this pattern.
A daily close above 29 levels validated the breakout from the 7-month-long H&S continuation chart pattern.
Based on this chart pattern, the potential price target is 44 levels.
KNSA, classified under the "healthcare" sector, falls under the “Mid Cap-Value” stock category.
Cal-Maine Foods, Inc.-(CALM/NASDAQ)-Long Idea
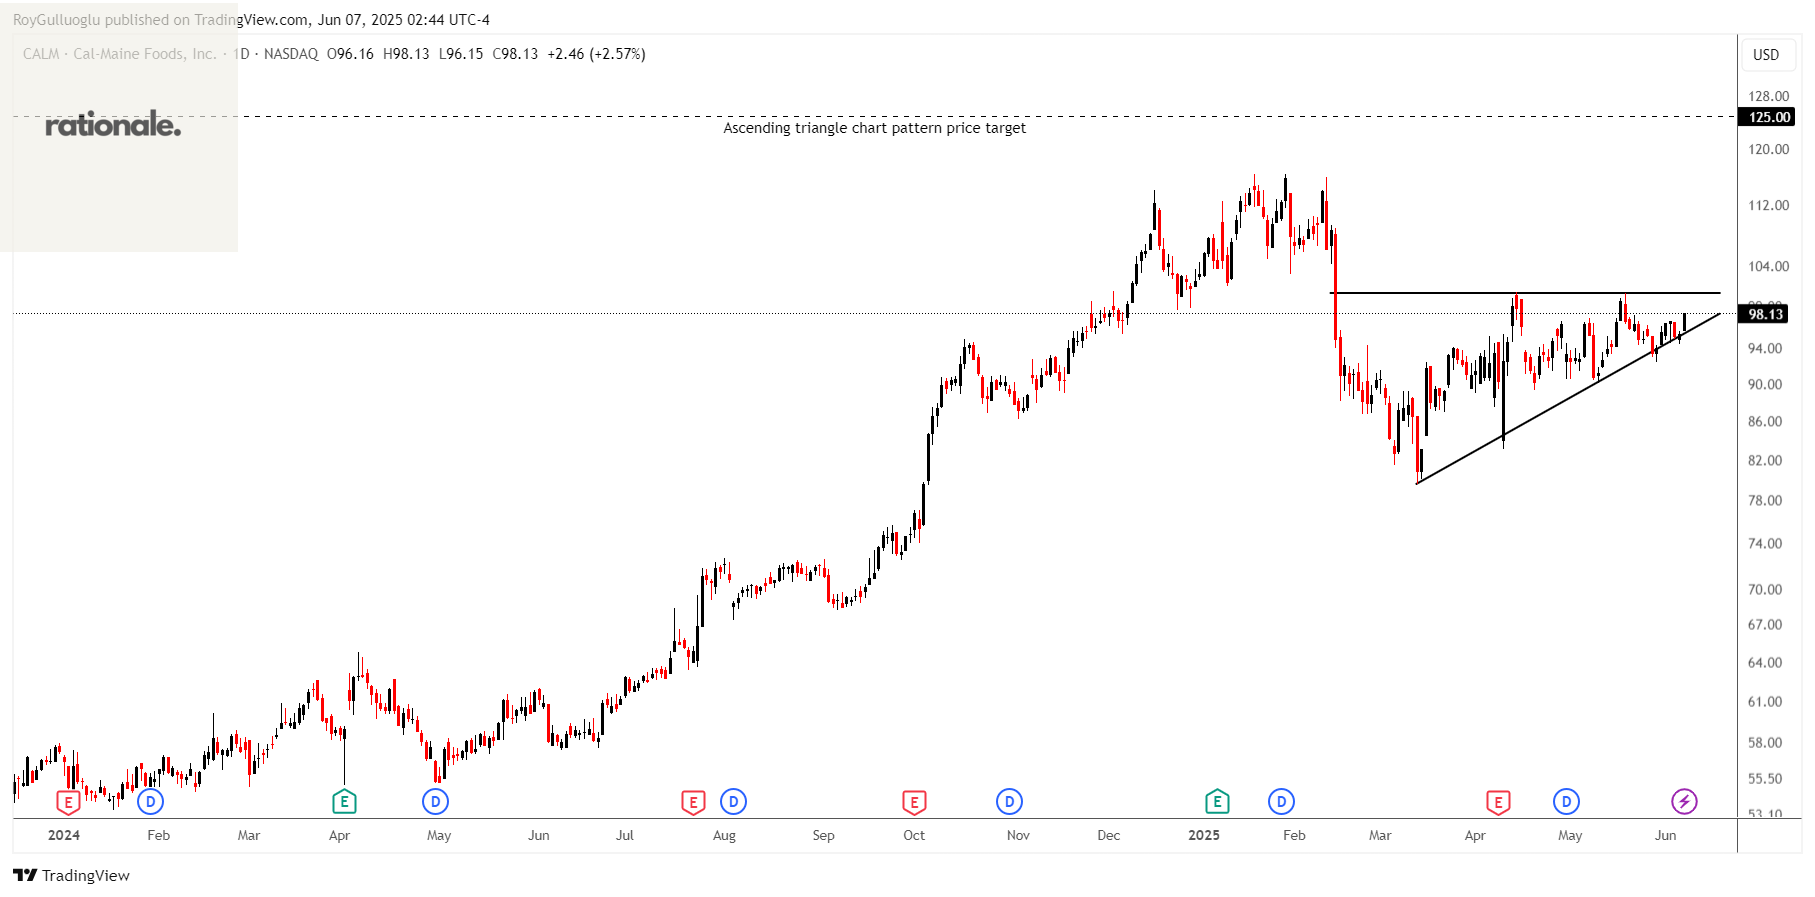
Cal-Maine Foods, Inc., together with its subsidiaries, engages in the production, grading, packaging, marketing, and distribution of shell eggs and egg products.
The above daily chart formed an approximately 3-month-long ascending triangle chart pattern as a bullish continuation after an uptrend.
The horizontal boundary at 100.59 levels acts as a resistance within this pattern.
A daily close above 103.6 levels would validate the breakout from the 3-month-long ascending triangle chart pattern.
Based on this chart pattern, the potential price target is 125 levels.
CALM, classified under the "consumer defensive" sector, falls under the “Mid Cap-Value” stock category.
Dear Roy
I'am writing for HIMS. Is this graph true? It's price is about 34.31 S now.