

Trade Ideas Equities
FSV(NASDAQ), TBPH(NYSE), OZK(NASDAQ), PHR(NYSE), 7745(TSE), ORA(EURONEXT), EL(EURONEXT), MRN(EURONEXT)

FirstService Corporation-(FSV/NASDAQ)-Long Idea
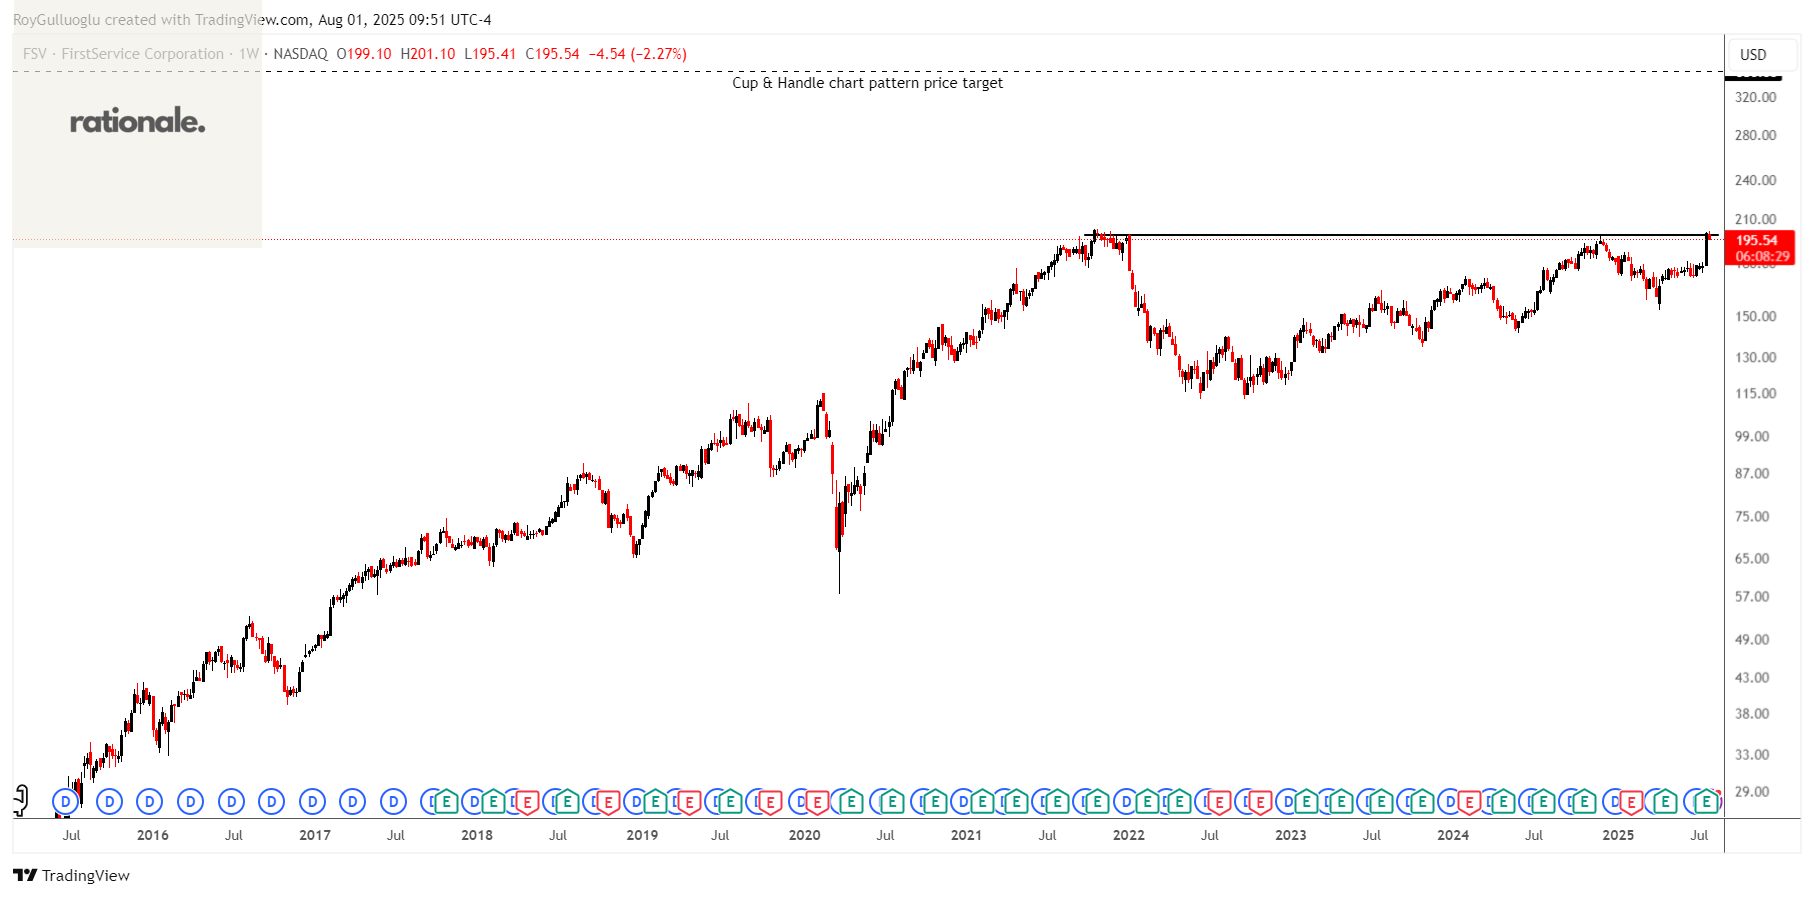
FirstService Corporation, together with its subsidiaries, provides residential property management and other essential property services to residential and commercial customers in the United States and Canada.
The above weekly chart formed an approximately 50-month-long cup & handle chart pattern as a bullish continuation after an uptrend.
The horizontal boundary at 198.2 levels acts as a resistance within this pattern.
A daily close above 204.14 levels would validate the breakout from the 50-month-long cup & handle chart pattern.
Based on this chart pattern, the potential price target is 350 levels.
FSV, classified under the "real estate" sector, falls under the “Mid Cap - Income” stock category.
Theravance Biopharma, Inc.-(TBPH/NASDAQ)-Long Idea
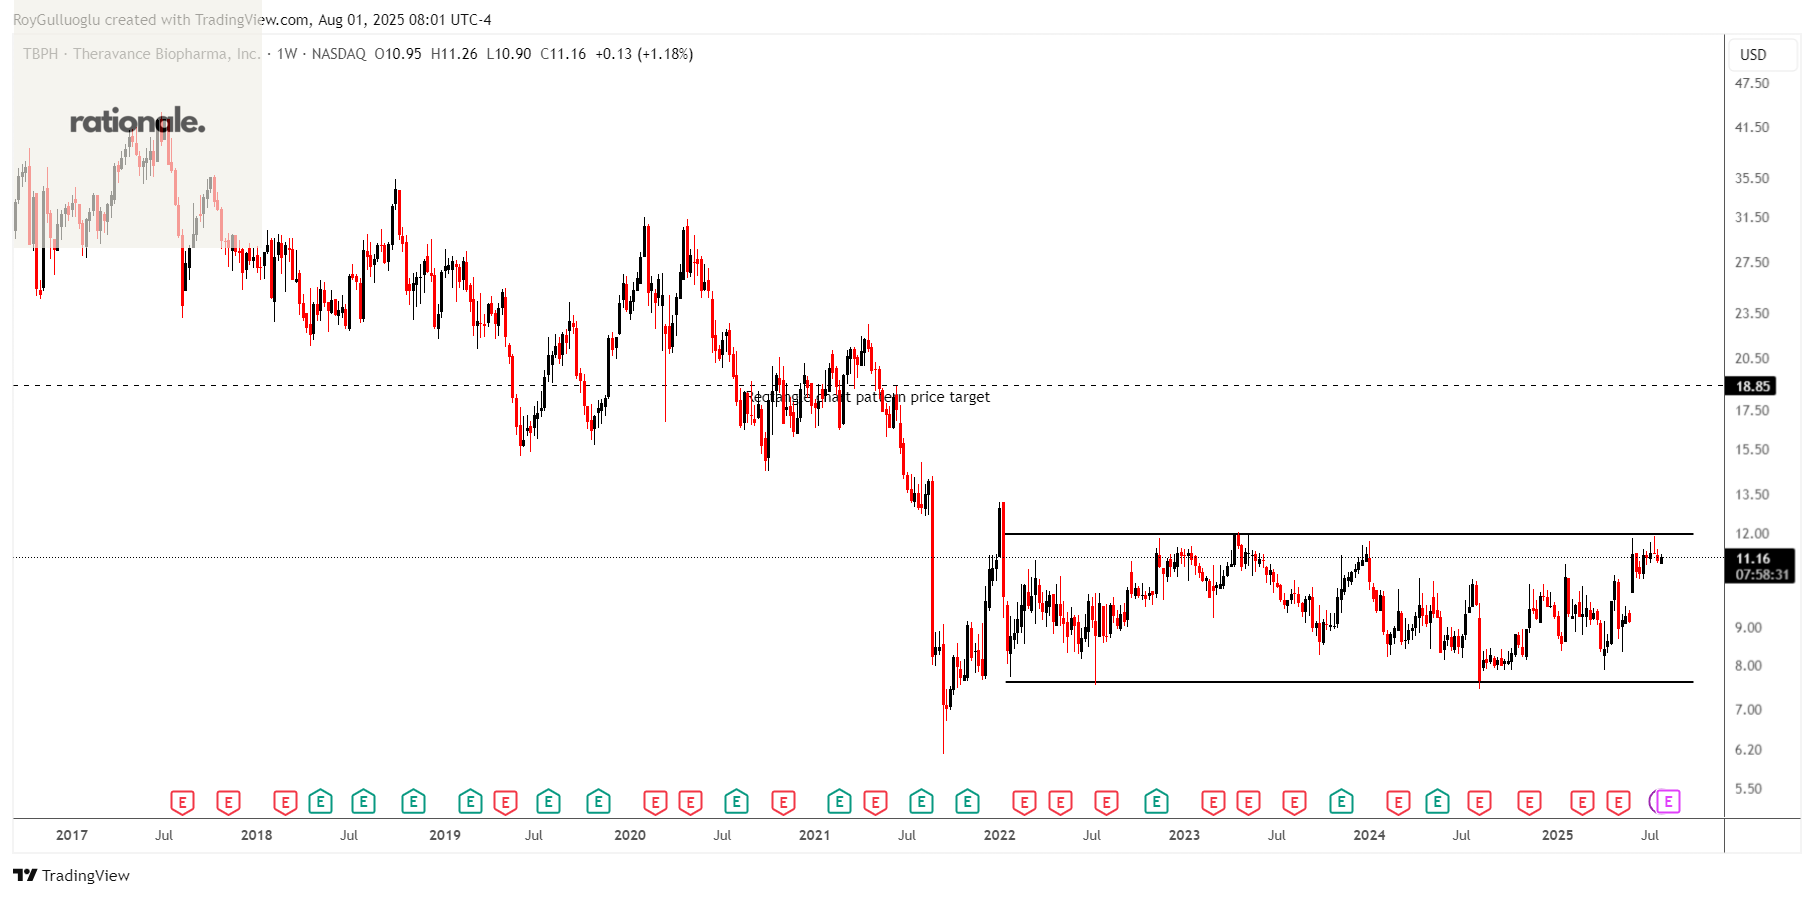
Theravance Biopharma, Inc., a biopharmaceutical company, develops and commercializes of medicines in the United States.
The above weekly chart formed an approximately 45-month-long rectangle chart pattern as a bullish reversal after a downtrend.
The horizontal boundary at 11.94 levels acts as a resistance within this pattern.
A daily close above 12.3 levels would validate the breakout from the 45-month-long rectangle chart pattern.
Based on this chart pattern, the potential price target is 18.85 levels.
TBPH, classified under the "healthcare" sector, falls under the “Small Cap - Value” stock category.
Bank OZK-(OZK/NASDAQ)-Long Idea
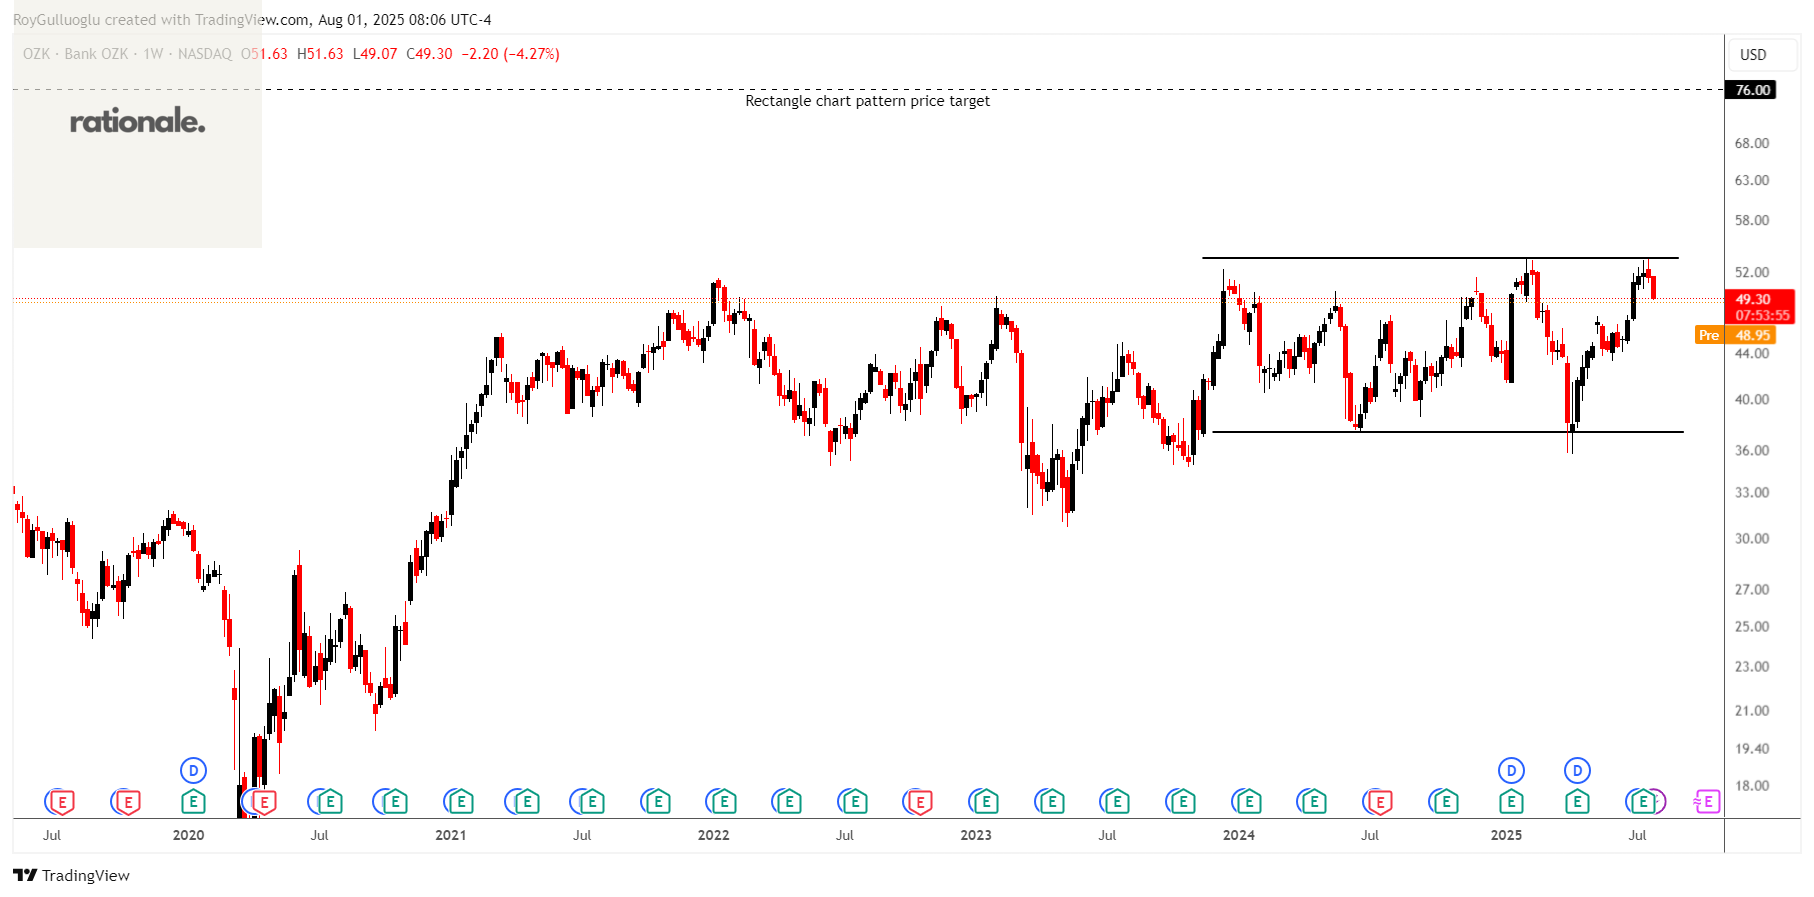
Bank OZK operates as a full-service Arkansas state-chartered bank that provides retail and commercial banking services in the United States
The above weekly chart formed an approximately 20-month-long rectangle chart pattern as a bullish reversal after a downtrend.
The horizontal boundary at 53.6 levels acts as a resistance within this pattern.
A daily close above 55.2 levels would validate the breakout from the 6-month-long H&S bottom chart pattern.
Based on this chart pattern, the potential price target is 160 levels.
OZK, classified under the "financial services" sector, falls under the “Mid Cap - Income” stock category.
Phreesia, Inc.-(PHR/NYSE)-Long Idea
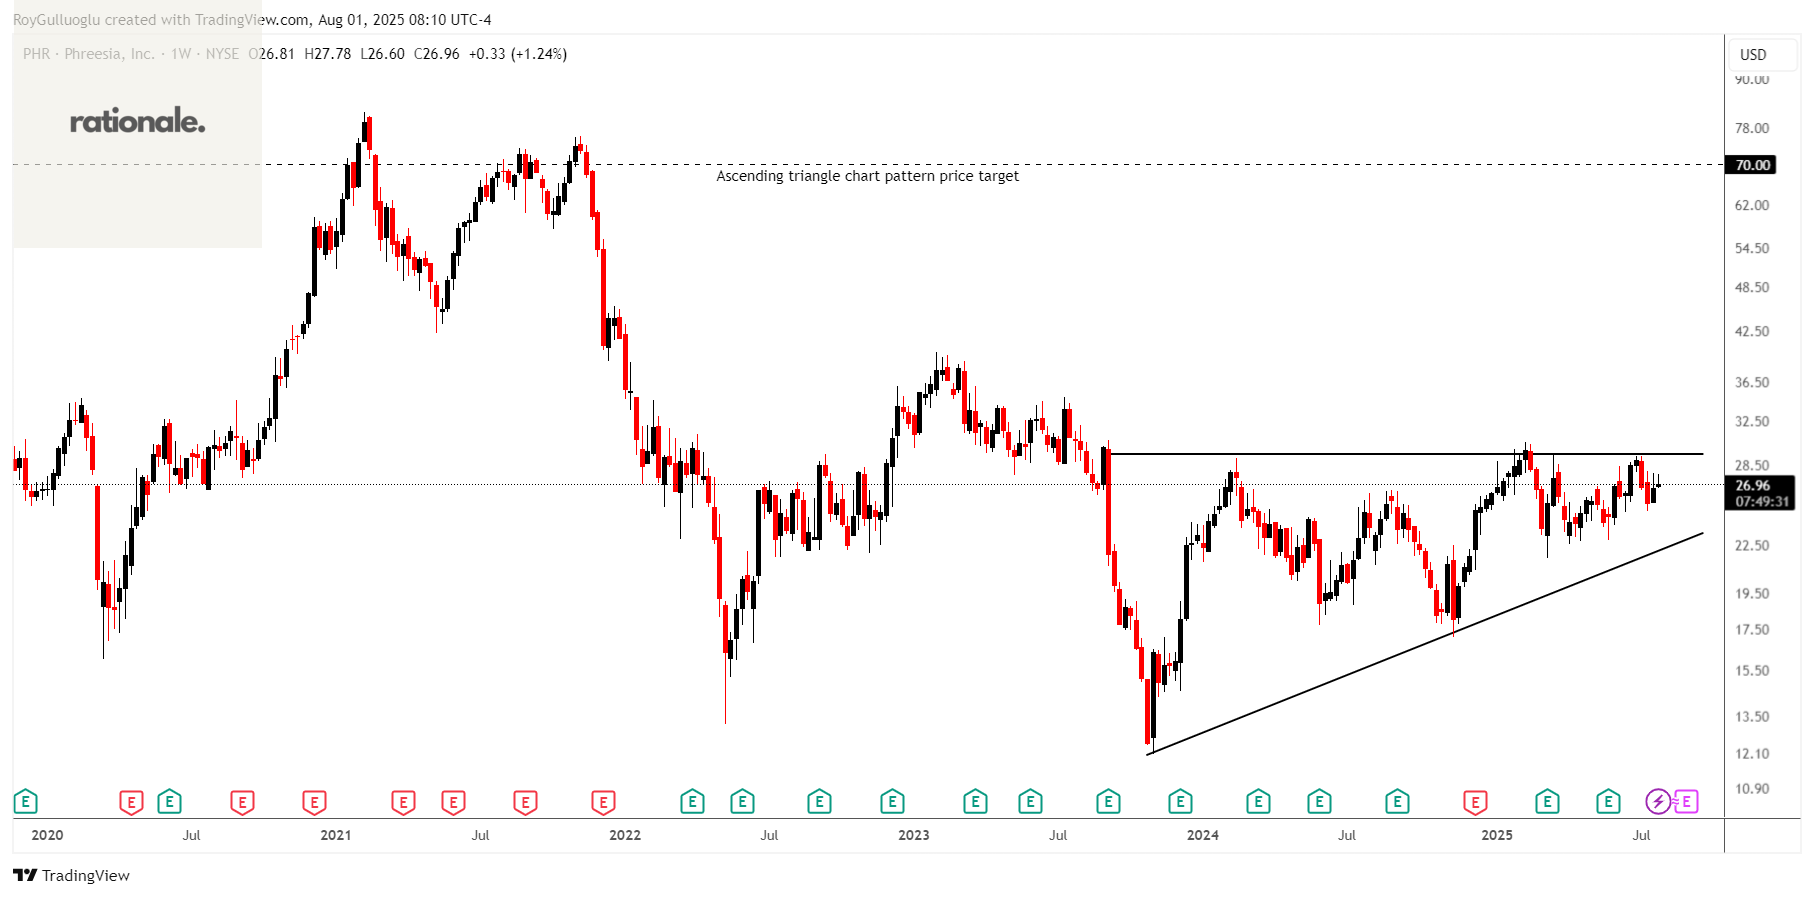
Phreesia, Inc. provides an integrated SaaS-based software and payment platform for the healthcare industry in the United States and Canada.
The above weekly chart formed an approximately 22-month-long ascending triangle chart pattern as a bullish reversal after a downtrend.
The horizontal boundary at 29.5 levels acts as a resistance within this pattern.
A daily close above 30.38 levels would validate the breakout from the 22-month-long ascending triangle chart pattern.
Based on this chart pattern, the potential price target is 70 levels.
PHR, classified under the "healthcare" sector, falls under the “Small Cap - Value” stock category.
A&D HOLON Holdings Company, Limited-(7745/TSE)-Long Idea
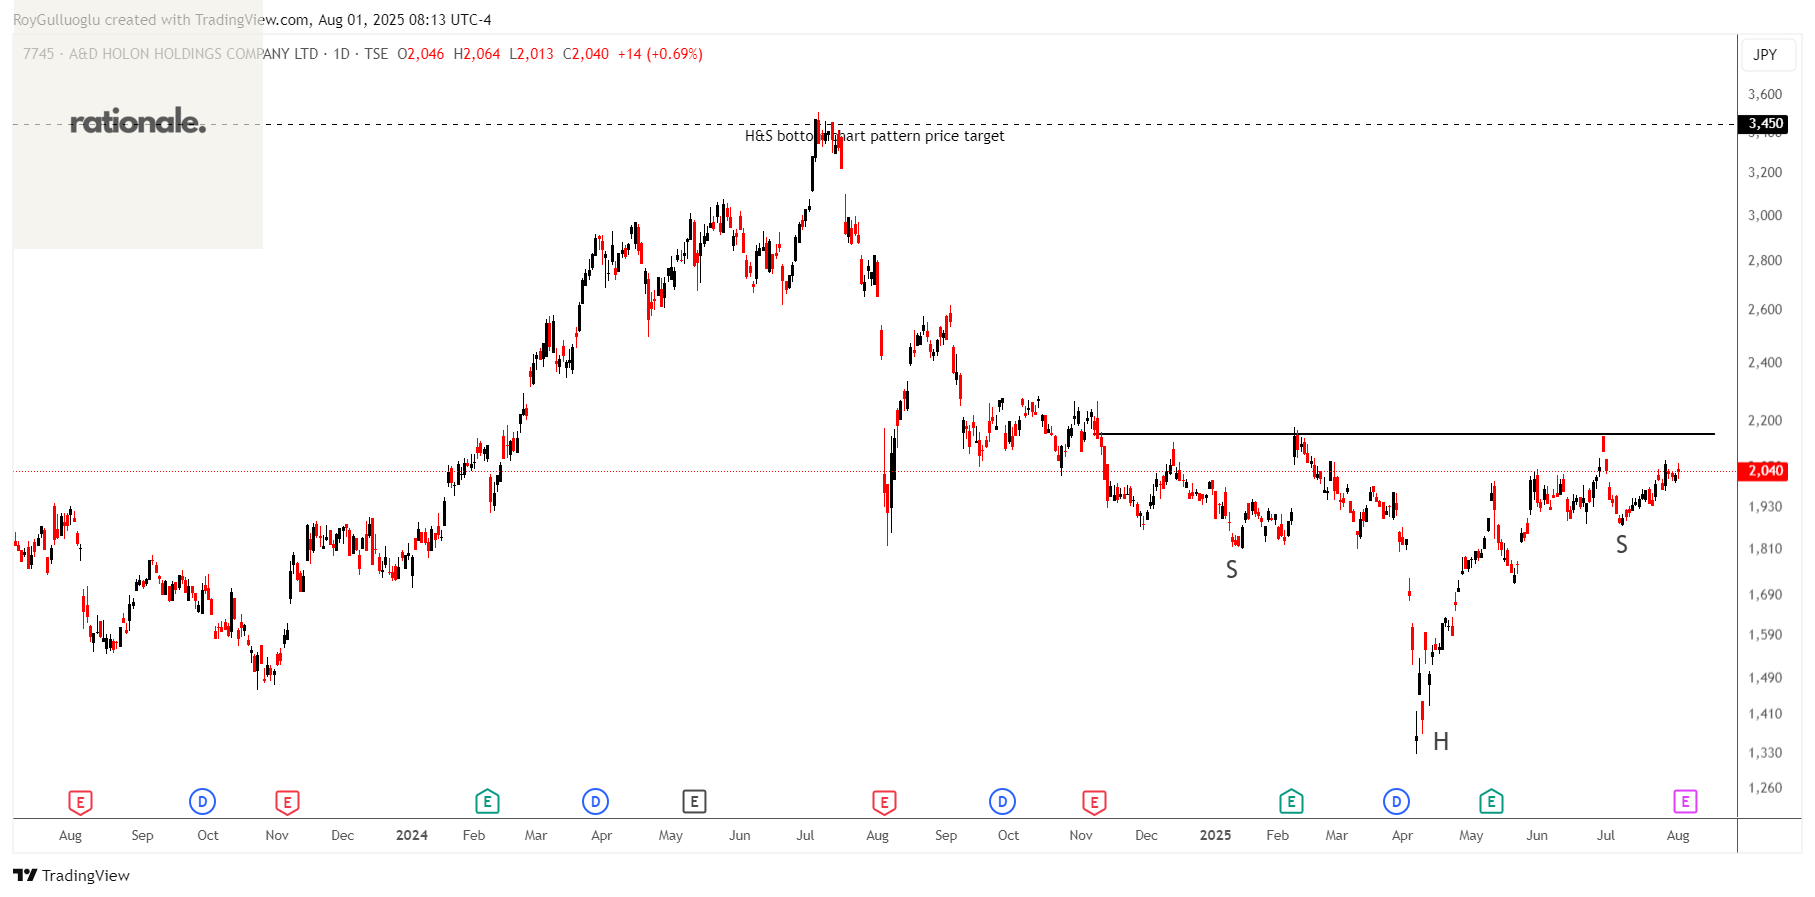
A&D HOLON Holdings Company, Limited provides measurement technologies and products.
The above daily chart formed an approximately 6-month-long H&S bottom chart pattern as a bullish reversal after a downtrend.
The horizontal boundary at 2156 levels acts as a resistance within this pattern.
A daily close above 2220 levels would validate the breakout from the 4-month-long H&S bottom chart pattern.
Based on this chart pattern, the potential price target is 3450 levels.
7745, classified under the "technology" sector, falls under the “Small Cap - Growth” stock category.
Orange-(ORA/EURONEXT)-Long Idea
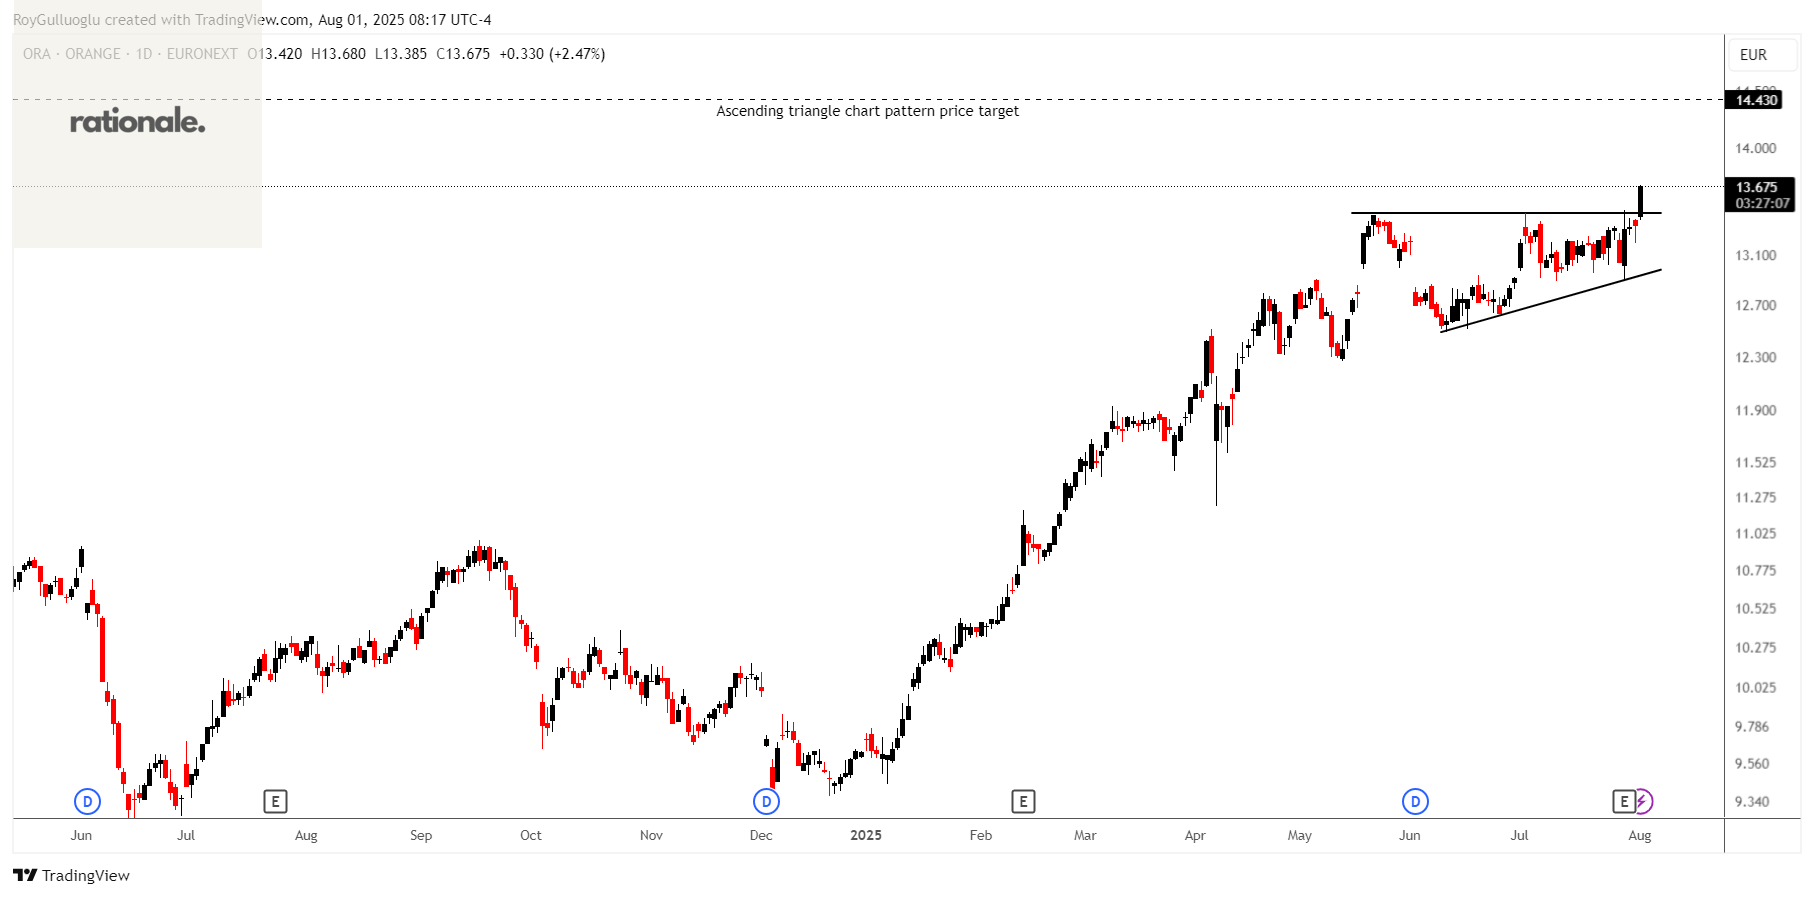
Orange is a France-based multiservice telecommunications operator.
The above daily chart formed an approximately 2-month-long ascending triangle chart pattern as a bullish continuation after an uptrend.
The horizontal boundary at 13.440 levels acted as a resistance within this pattern.
A daily close above 13.84 levels validated the breakout from the 2-month-long ascending triangle chart pattern.
Based on this chart pattern, the potential price target is 14.43 levels.
EssilorLuxottica Société anonyme-(EL/EURONEXT)-Long Idea
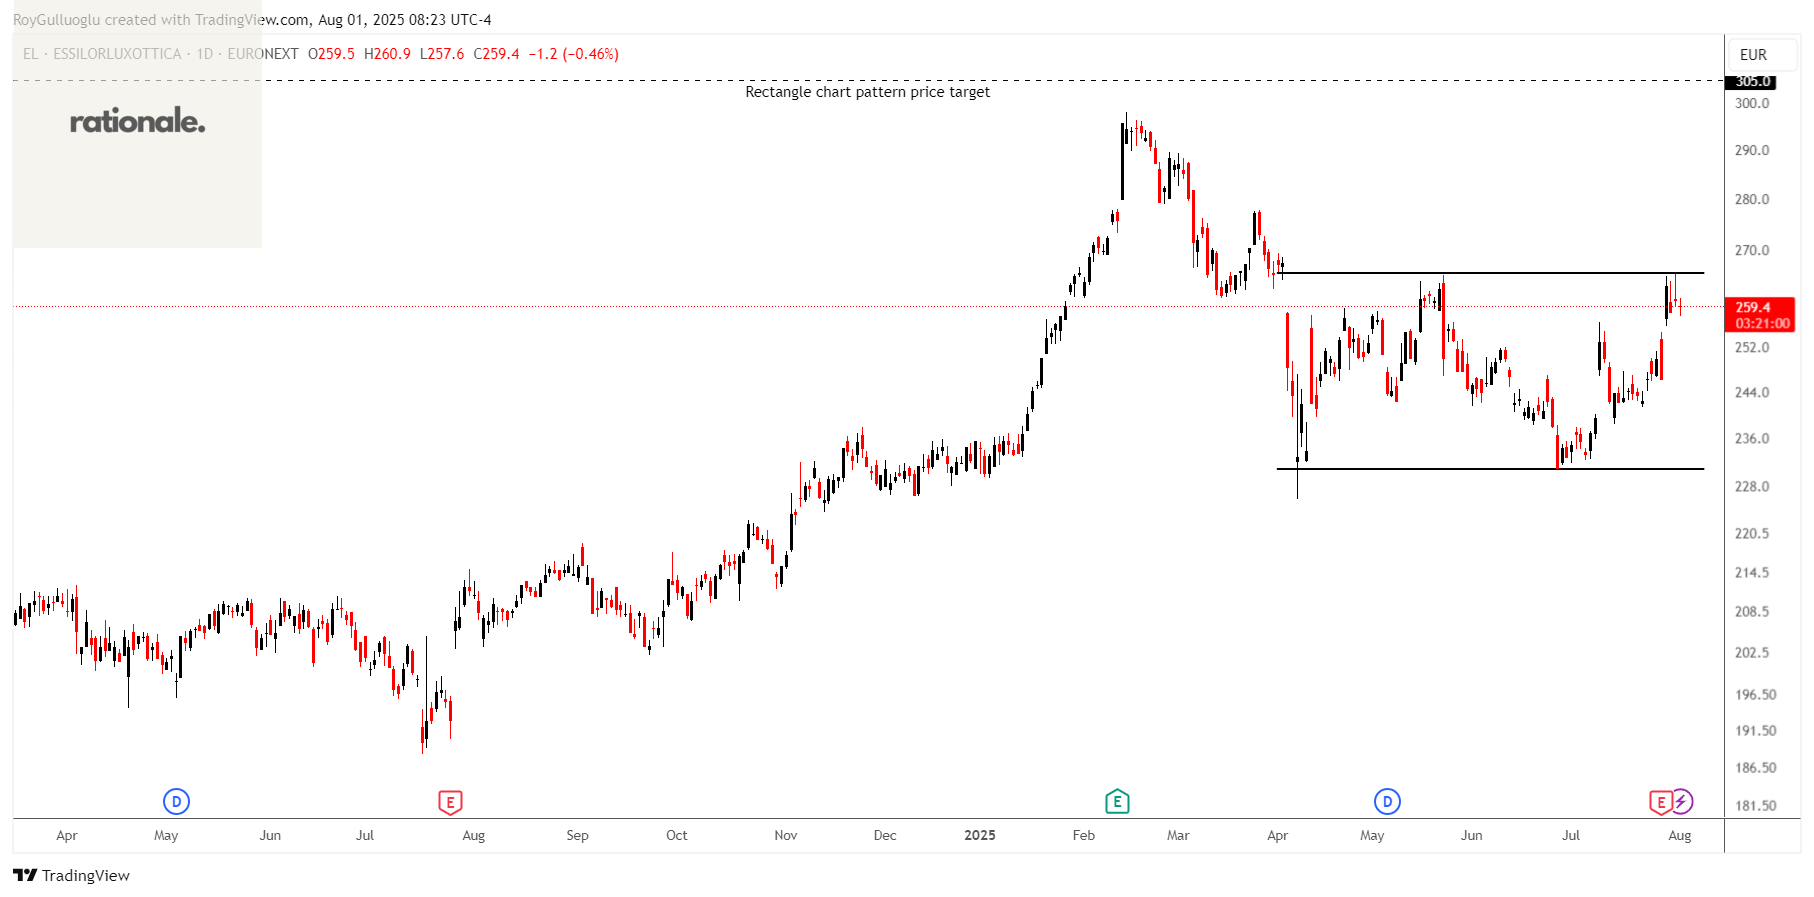
EssilorLuxottica Société anonyme designs, manufactures, and distributes ophthalmic lenses, frames, and sunglasses in North America, the Middle East, Africa, Europe, Latin America, and the Asia-Pacific.
The above daily chart formed an approximately 3-month-long rectangle chart pattern as a bullish reversal after a downtrend.
The horizontal boundary at 265.6 levels acts as a resistance within this pattern.
A daily close above 273.5 levels would validate the breakout from the 3-month-long rectangle chart pattern.
Based on this chart pattern, the potential price target is 305 levels.
Mersen S.A-(MRN/EURONEXT)-Long Idea

Mersen S.A. manufactures and sells electrical power products and advanced materials in France, North America, rest of Europe, the Asia-Pacific, and internationally.
The above daily chart formed an approximately 6-month-long H&S bottom chart pattern as a bullish reversal after a downtrend.
The horizontal boundary at 23.05 levels acted as a resistance within this pattern.
A daily close above 23.74 levels validated the breakout from the 6-month-long H&S bottom chart pattern.
Based on this chart pattern, the potential price target is 31.3 levels.
Teşekkürler Roy