


The Allstate Corporation-(ALL/NYSE)-Long Idea
The Allstate Corporation, together with its subsidiaries, provides property and casualty, and other insurance products in the United States and Canada.
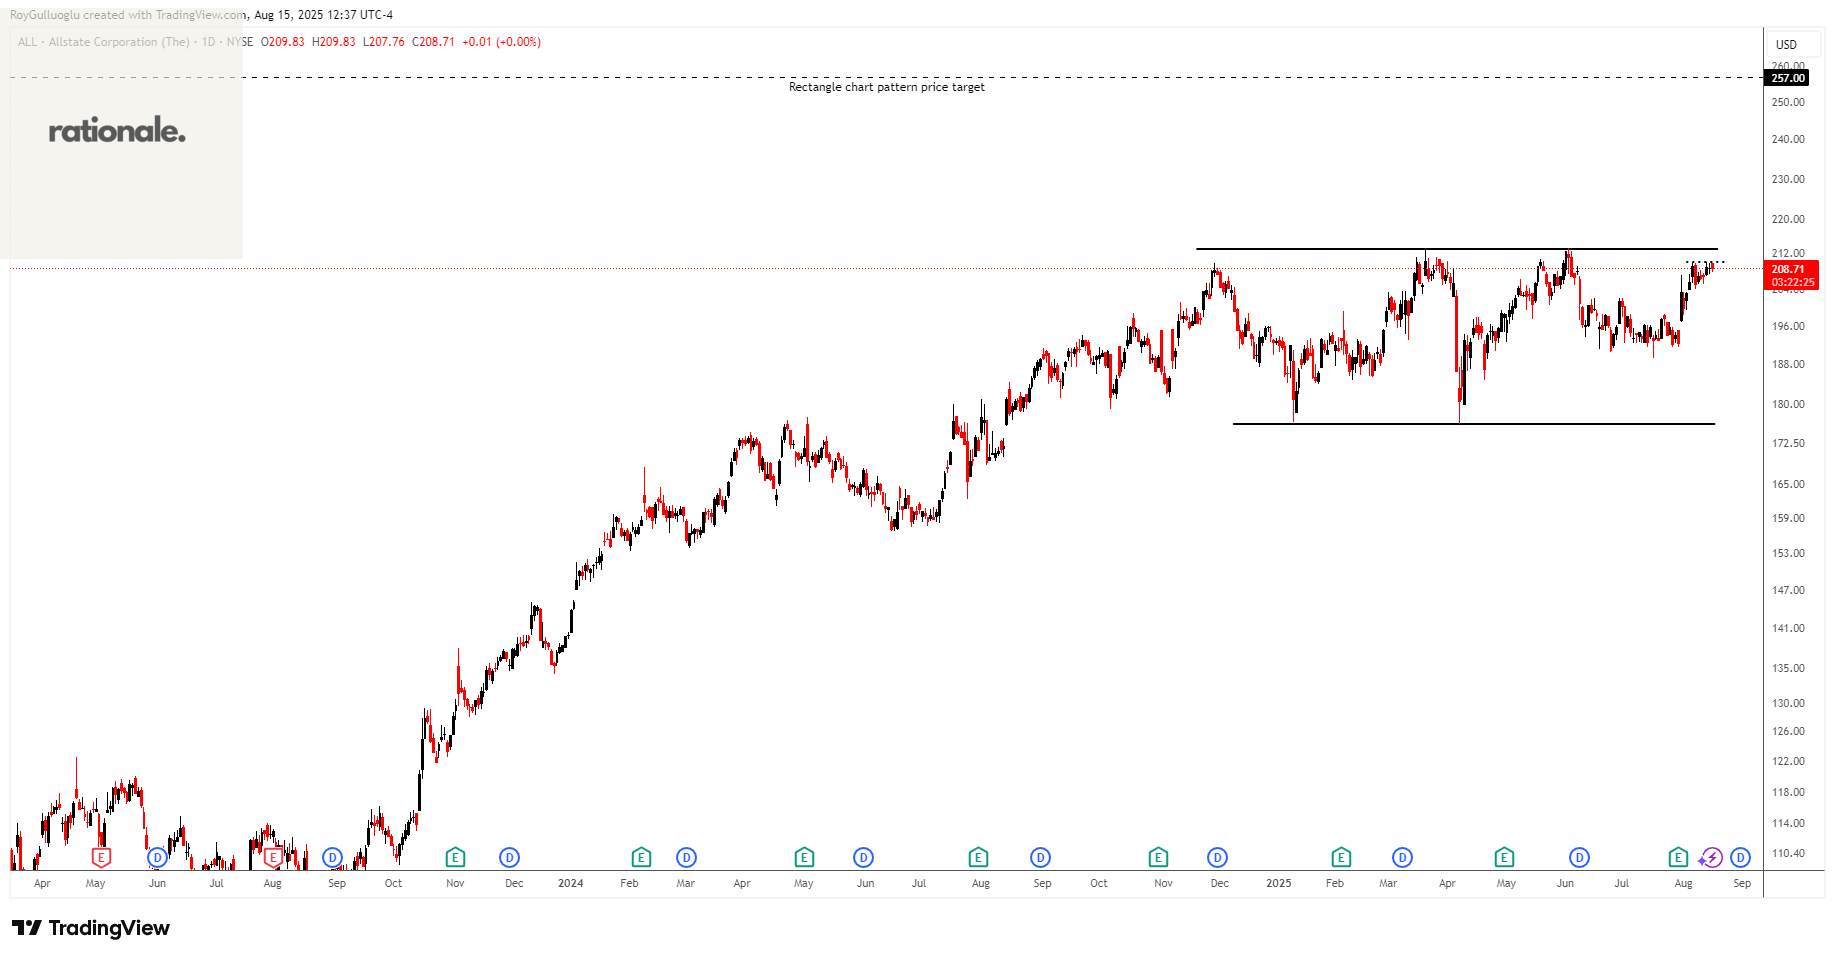
The above daily chart formed an approximately 6-month-long rectangle chart pattern as a bullish continuation after an uptrend.
The horizontal boundary at 213 levels acts as a resistance within this pattern.
A daily close above 219.4 levels would validate the breakout from the 6-month-long rectangle chart pattern.
Based on this chart pattern, the potential price target is 257 levels.
ALL, classified under the "financial services" sector, falls under the “Large Cap - Income” stock category.
Bristow Group Inc.-(VTOL/NYSE)-Long Idea
Bristow Group Inc. provides vertical flight solutions to integrated, national, and independent offshore energy companies and government agencies.
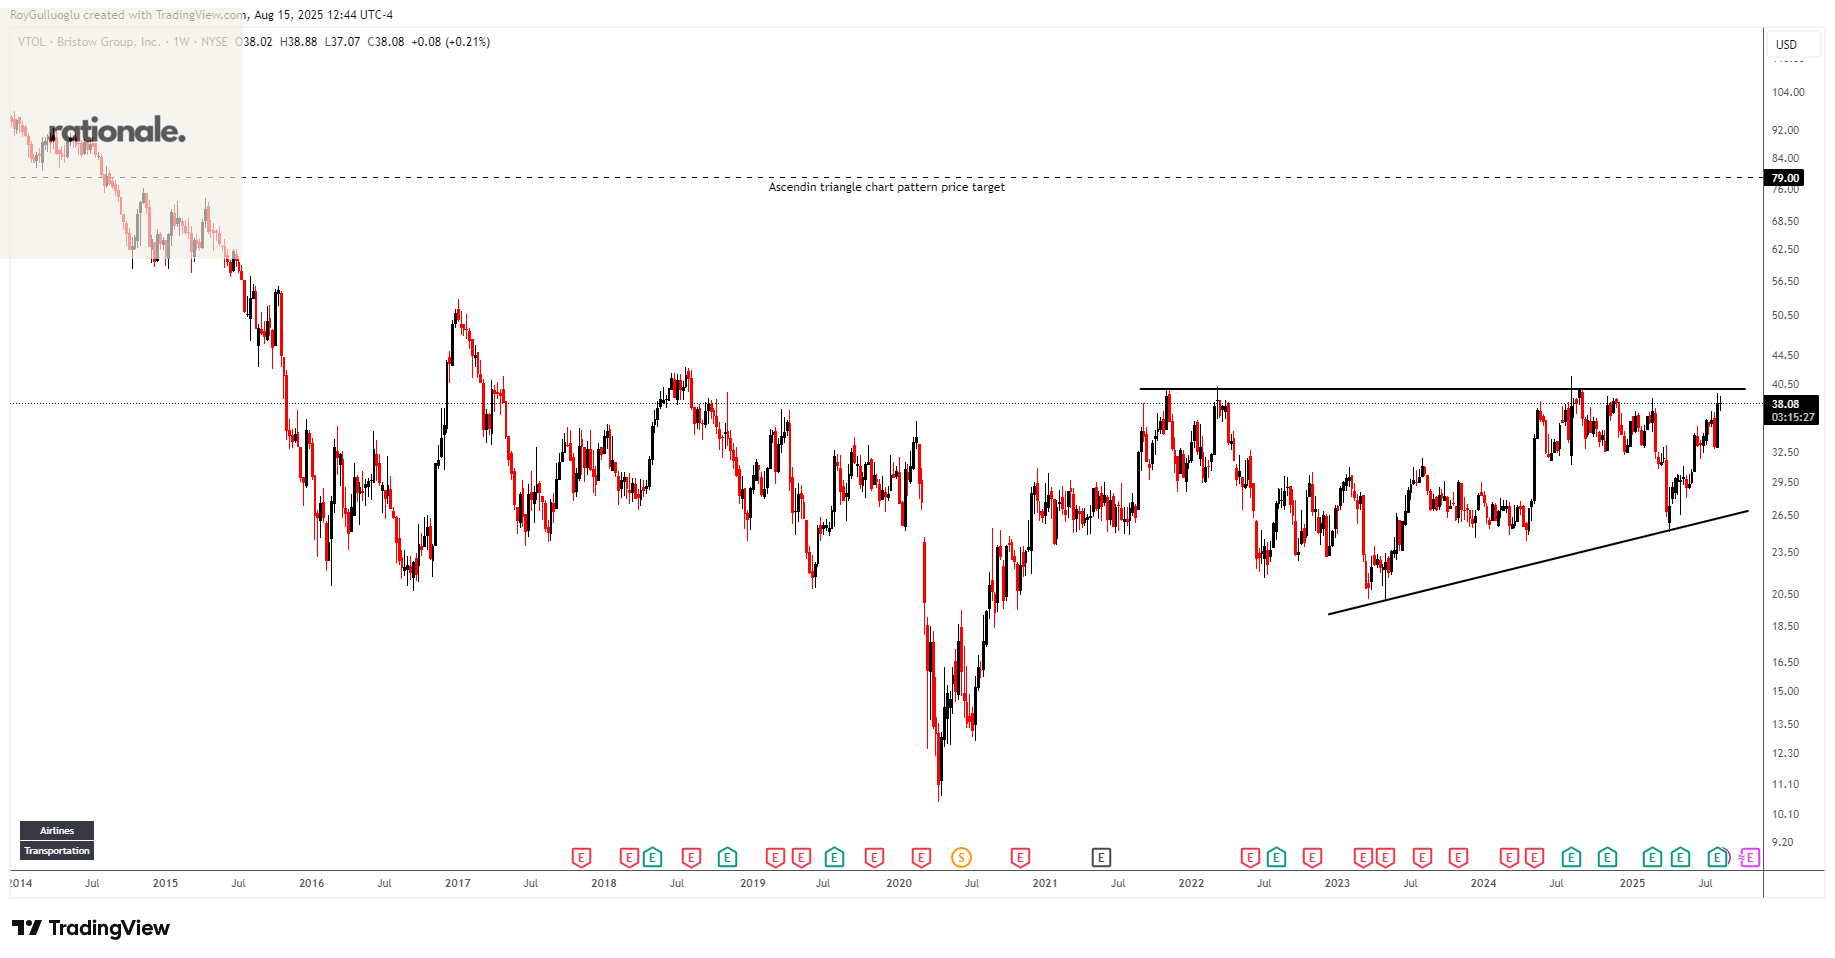
The above weekly chart formed an approximately 50-month-long ascending triangle chart pattern as a bullish continuation after an uptrend.
The horizontal boundary at 40 levels acts as a resistance within this pattern.
A daily close above 41.2 levels would validate the breakout from the 50-month-long ascending triangle chart pattern.
Based on this chart pattern, the potential price target is 79 levels.
VTOL, classified under the "energy" sector, falls under the “Income Cap - Small” stock category.
The Ensign Group, Inc.-(ENSG/NASDAQ)-Long Idea
The Ensign Group, Inc. provides skilled nursing, senior living, and rehabilitative services.
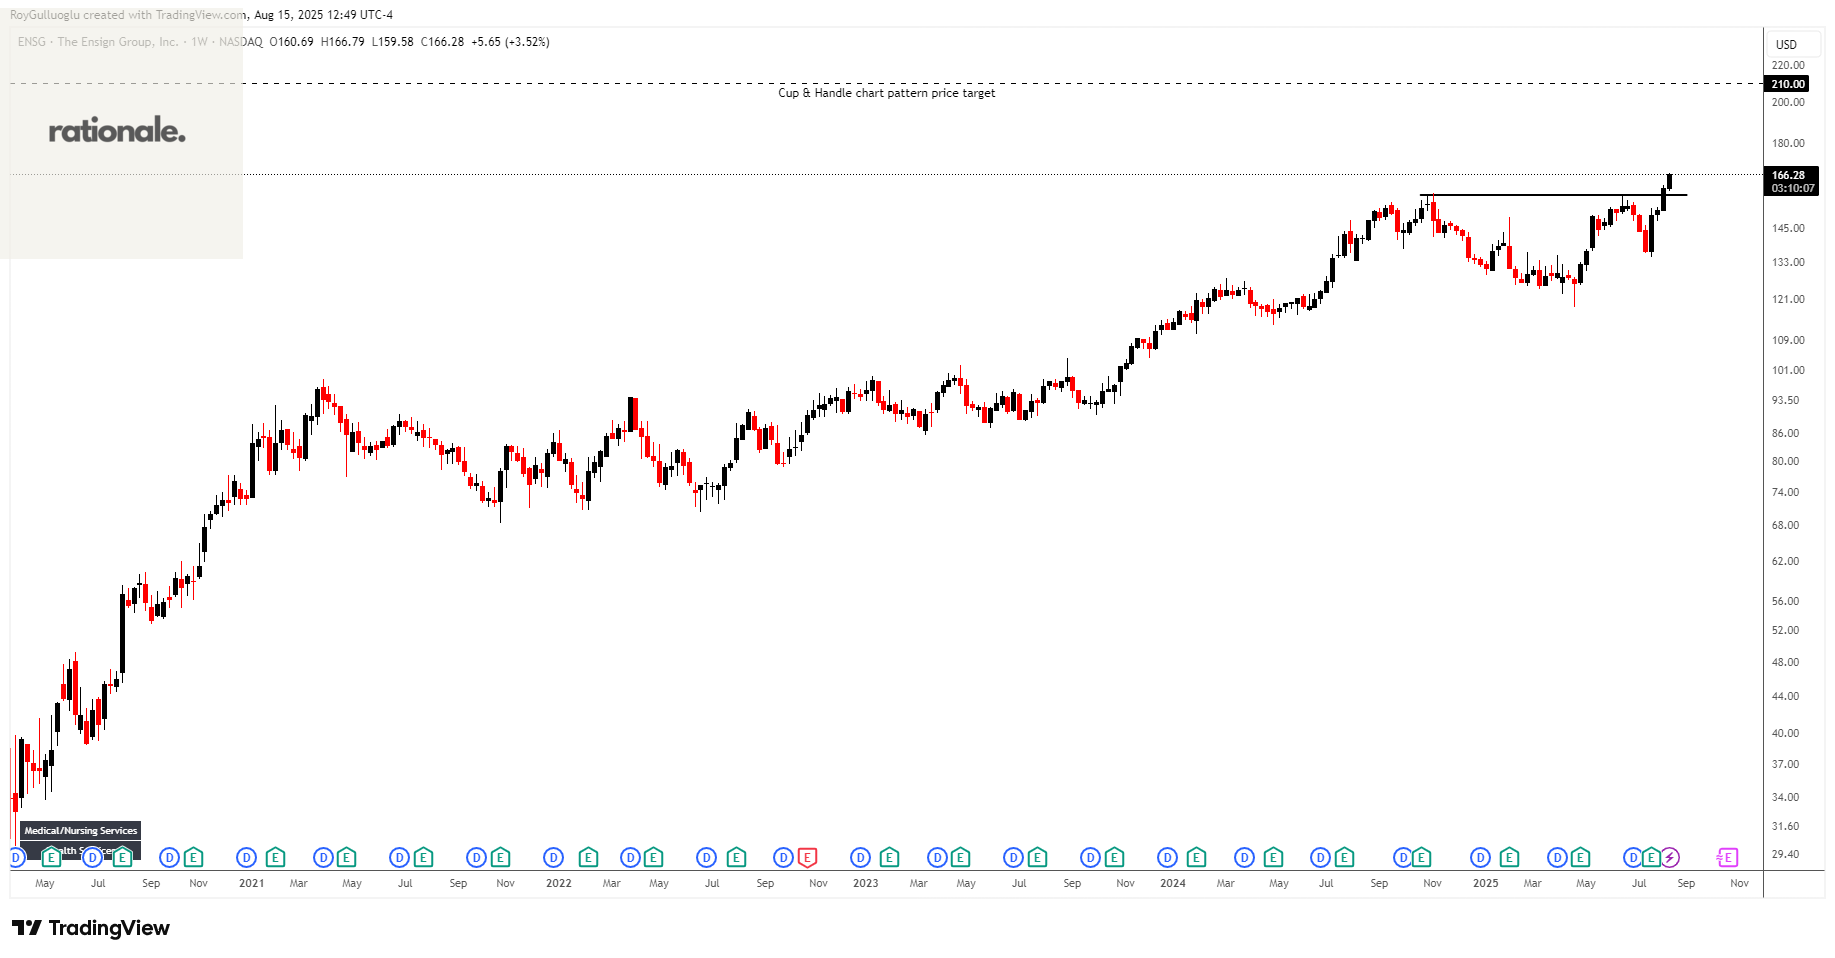
The above weekly chart formed an approximately 10-month-long cup & handle chart pattern as a bullish continuation after an uptrend.
The horizontal boundary at 157.68 levels acted as a resistance within this pattern.
A daily close above 162.4 levels validated the breakout from the 10-month-long cup & handle chart pattern.
Based on this chart pattern, the potential price target is 210 levels.
ENSG, classified under the "healthcare" sector, falls under the “Mid Cap - Value” stock category.
Old Republic International Corporation-(ORI/NYSE)-Long Idea
Old Republic International Corporation, through its subsidiaries, provides insurance underwriting and related services primarily in the United States and Canada.
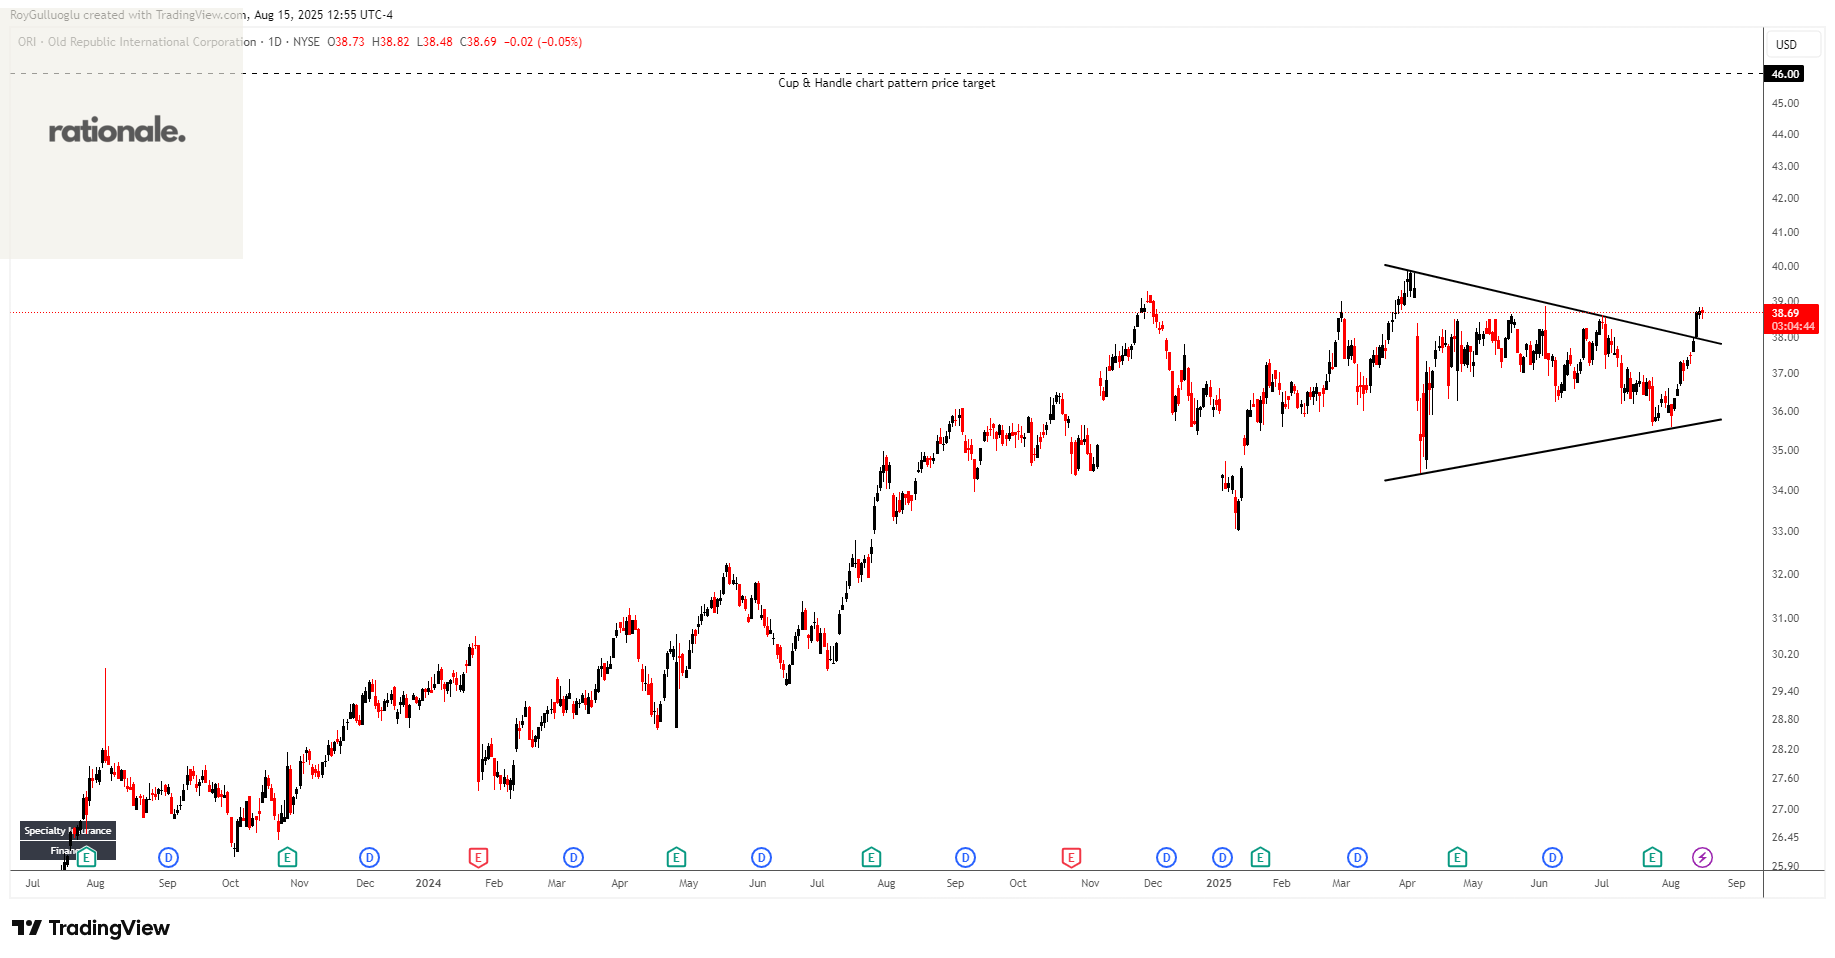
The above daily chart formed an approximately 3-month-long symmetrical triangle chart pattern as a bullish continuation after an uptrend.
A daily close above 39.14 levels would validate the breakout from the 3-month-long symmetrical triangle chart pattern.
Based on this chart pattern, the potential price target is 46 levels.
ORI, classified under the "financial services" sector, falls under the “Mid Cap - Income” stock category.
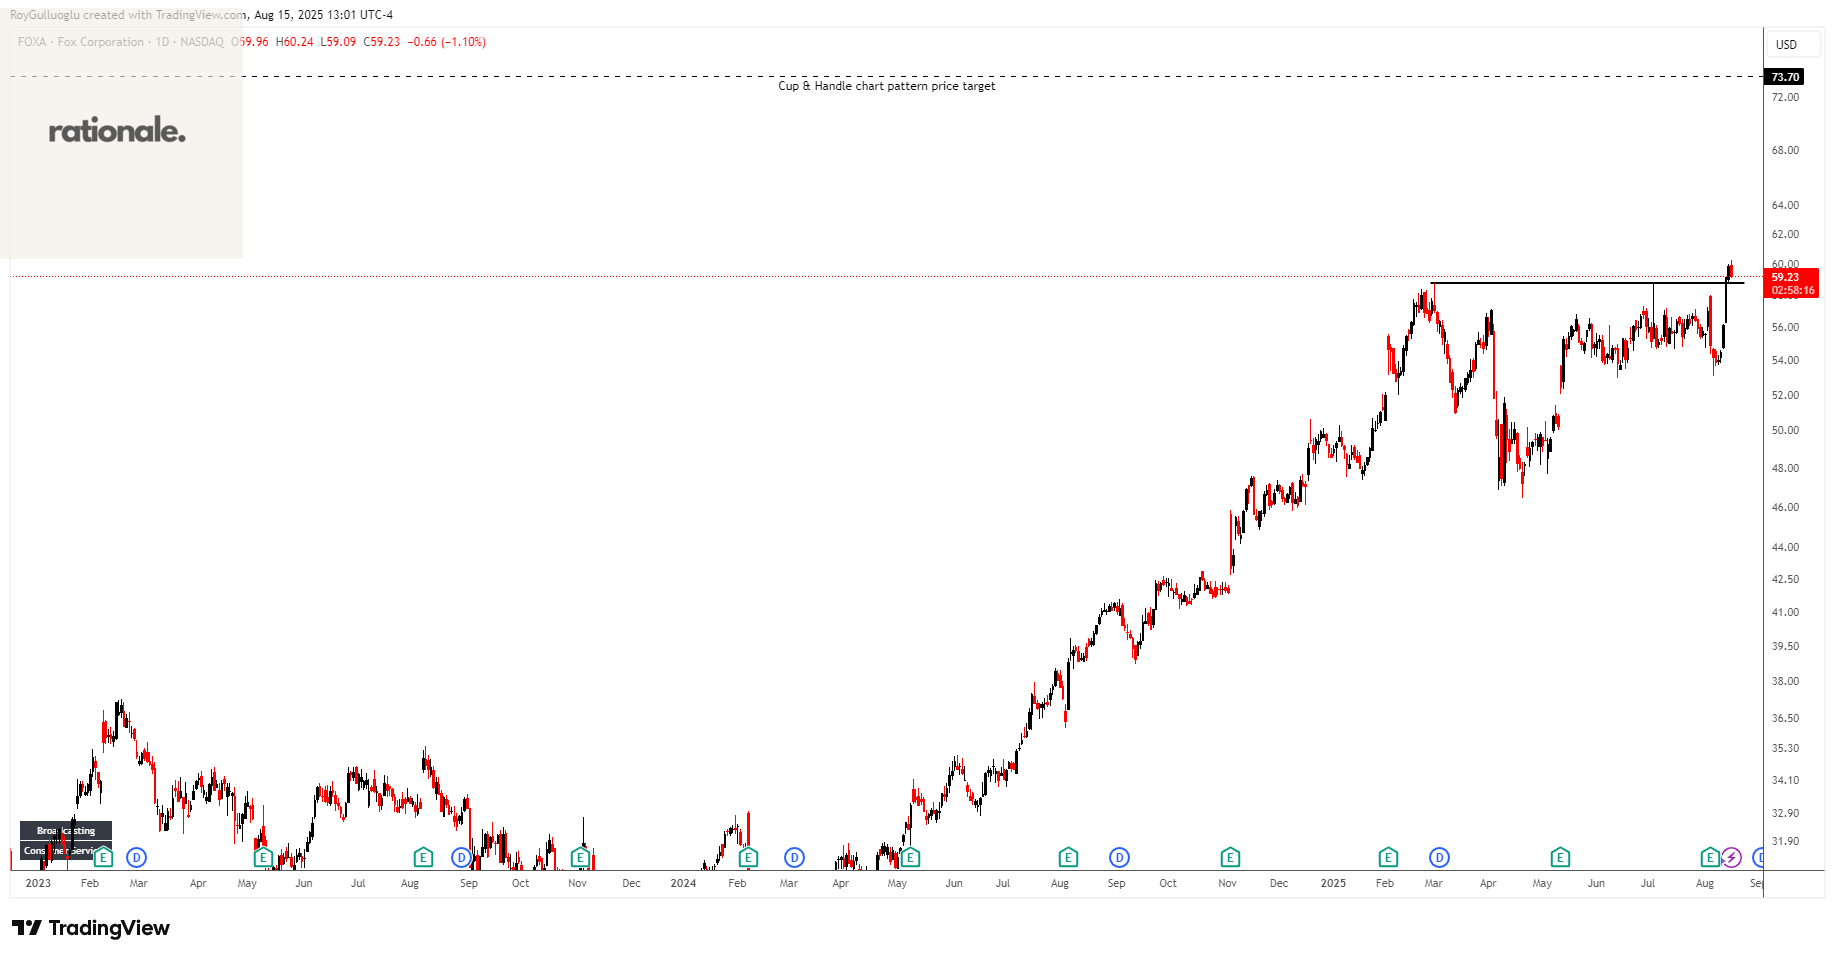
Fox Corporation.-(FOXA/NASDAQ)-Long Idea
Lands' End, Inc. operates as a digital retailer of apparel, swimwear, outerwear, accessories, footwear, home products, and uniforms in the United States, Europe, and internationally.
The above daily chart formed an approximately 4-month-long cup & handle chart pattern as a bullish continuation after an uptrend.
The horizontal boundary at 58.7 levels acts as a resistance within this pattern.
A daily close above 60.5 levels would validate the breakout from the 4-month-long cup & handle chart pattern.
Based on this chart pattern, the potential price target is 73.7 levels.
FOXA, classified under the "communication services" sector, falls under the “Large Cap - Growth” stock category.
Teşekkürler Roy