

Trade Ideas Equities
IIIN(NYSE), SVV(NYSE), ROKU(NASDAQ), PEUG(EURONEXT), RXL(EURONEXT)

Insteel Industries, Inc.-(IIIN/NYSE)-Long Idea
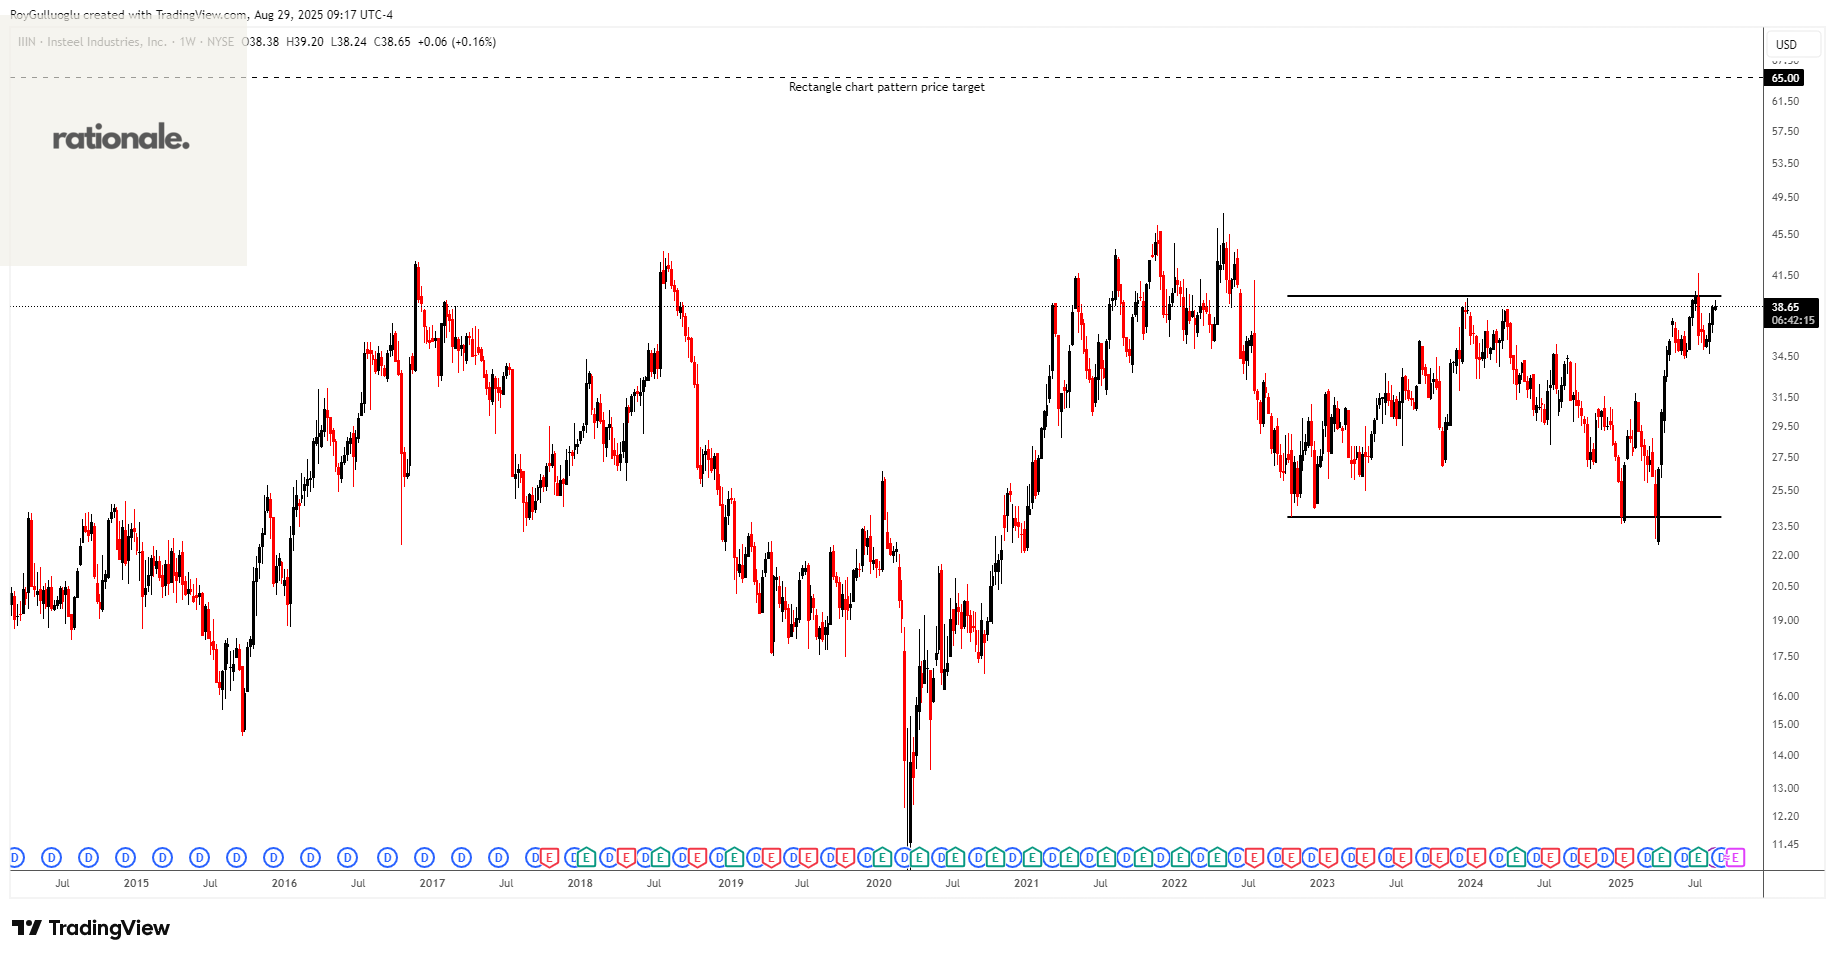
Insteel Industries, Inc., together with its subsidiaries, manufactures and markets steel wire reinforcing products for concrete construction applications.
The above weekly chart formed an approximately 37-month-long rectangle chart pattern as a bullish reversal after a downtrend.
The horizontal boundary at 40.75 levels acts as a resistance within this pattern.
A daily close above 42 levels would validate the breakout from the 37-month-long rectangle chart pattern.
Based on this chart pattern, the potential price target is 65 levels.
IIIN, classified under the "industrials" sector, falls under the “Small Cap - Value” stock category.
Savers Value Village, Inc.-(SVV/NYSE)-Long Idea
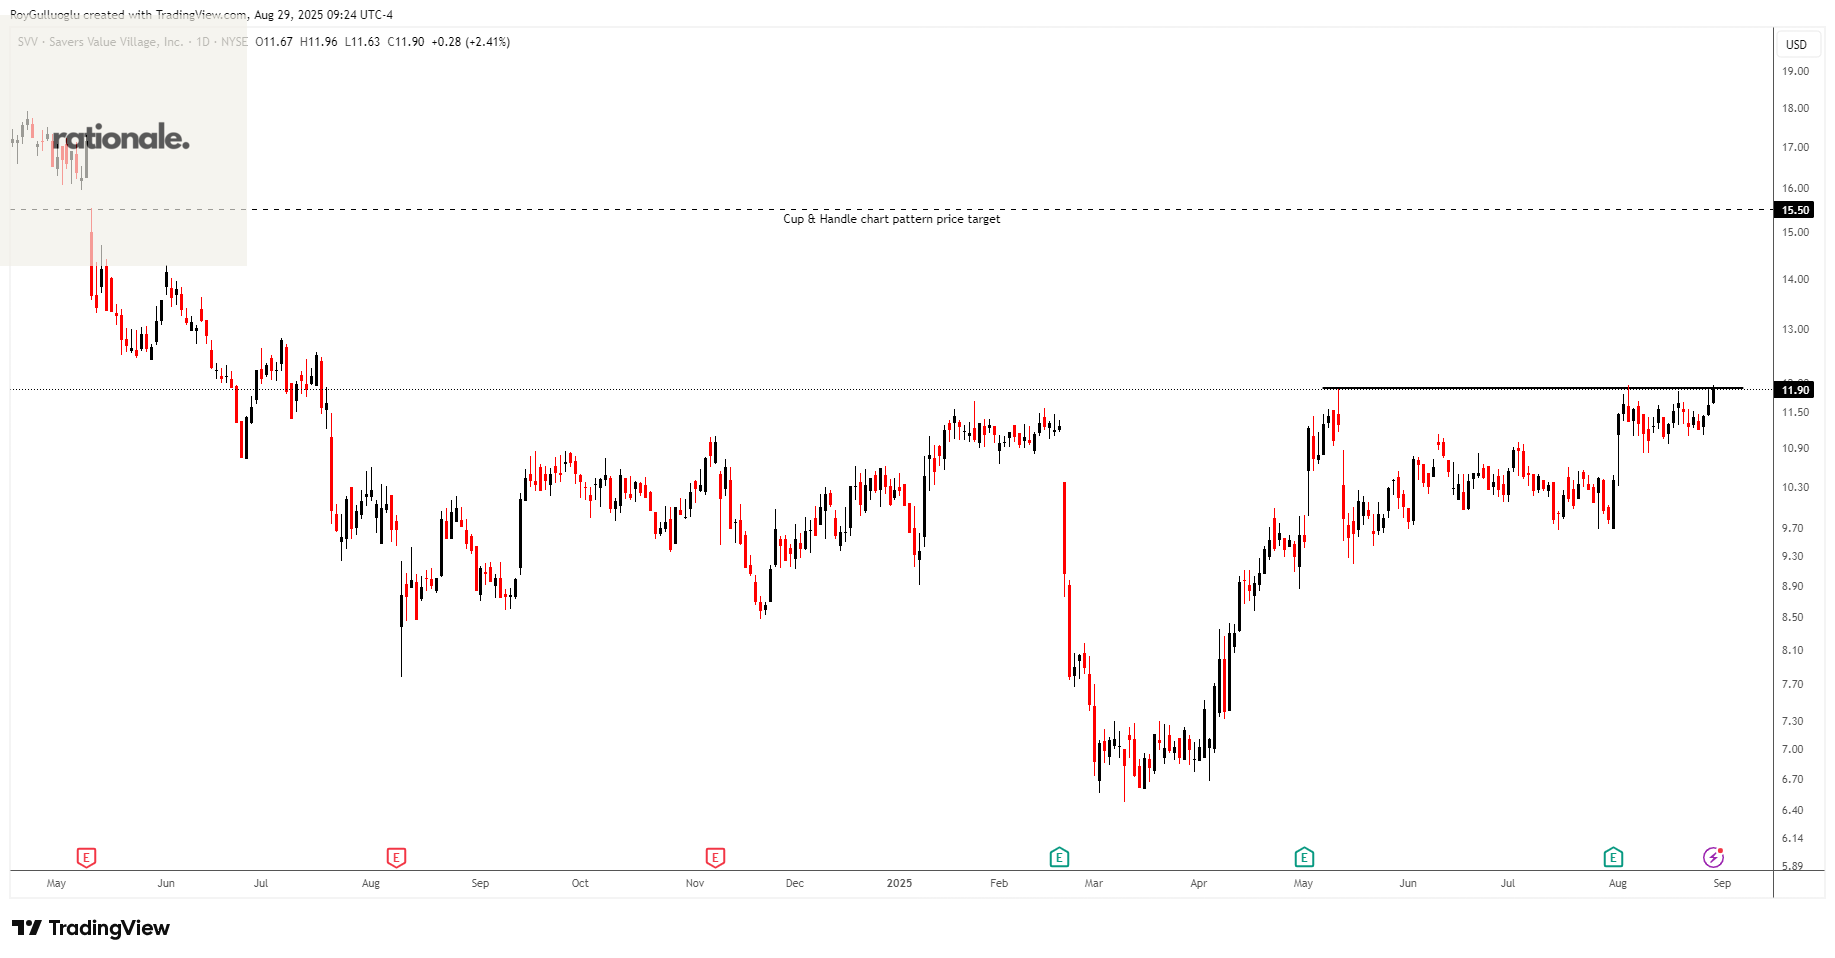
Savers Value Village, Inc. sells second-hand merchandise in retail stores in the United States, Canada, and Australia.
The above daily chart formed an approximately 3-month-long cup & handle chart pattern as a bullish continuation after an uptrend.
The horizontal boundary at 11.9 levels acts as a resistance within this pattern.
A daily close above 12.25 levels would validate the breakout from the 3-month-long cup & handle chart pattern.
Based on this chart pattern, the potential price target is 15.5 levels.
SVV, classified under the "consumer cyclical" sector, falls under the “Growth Cap - Small” stock category.
Roku, Inc.-(ROKU/NASDAQ)-Long Idea
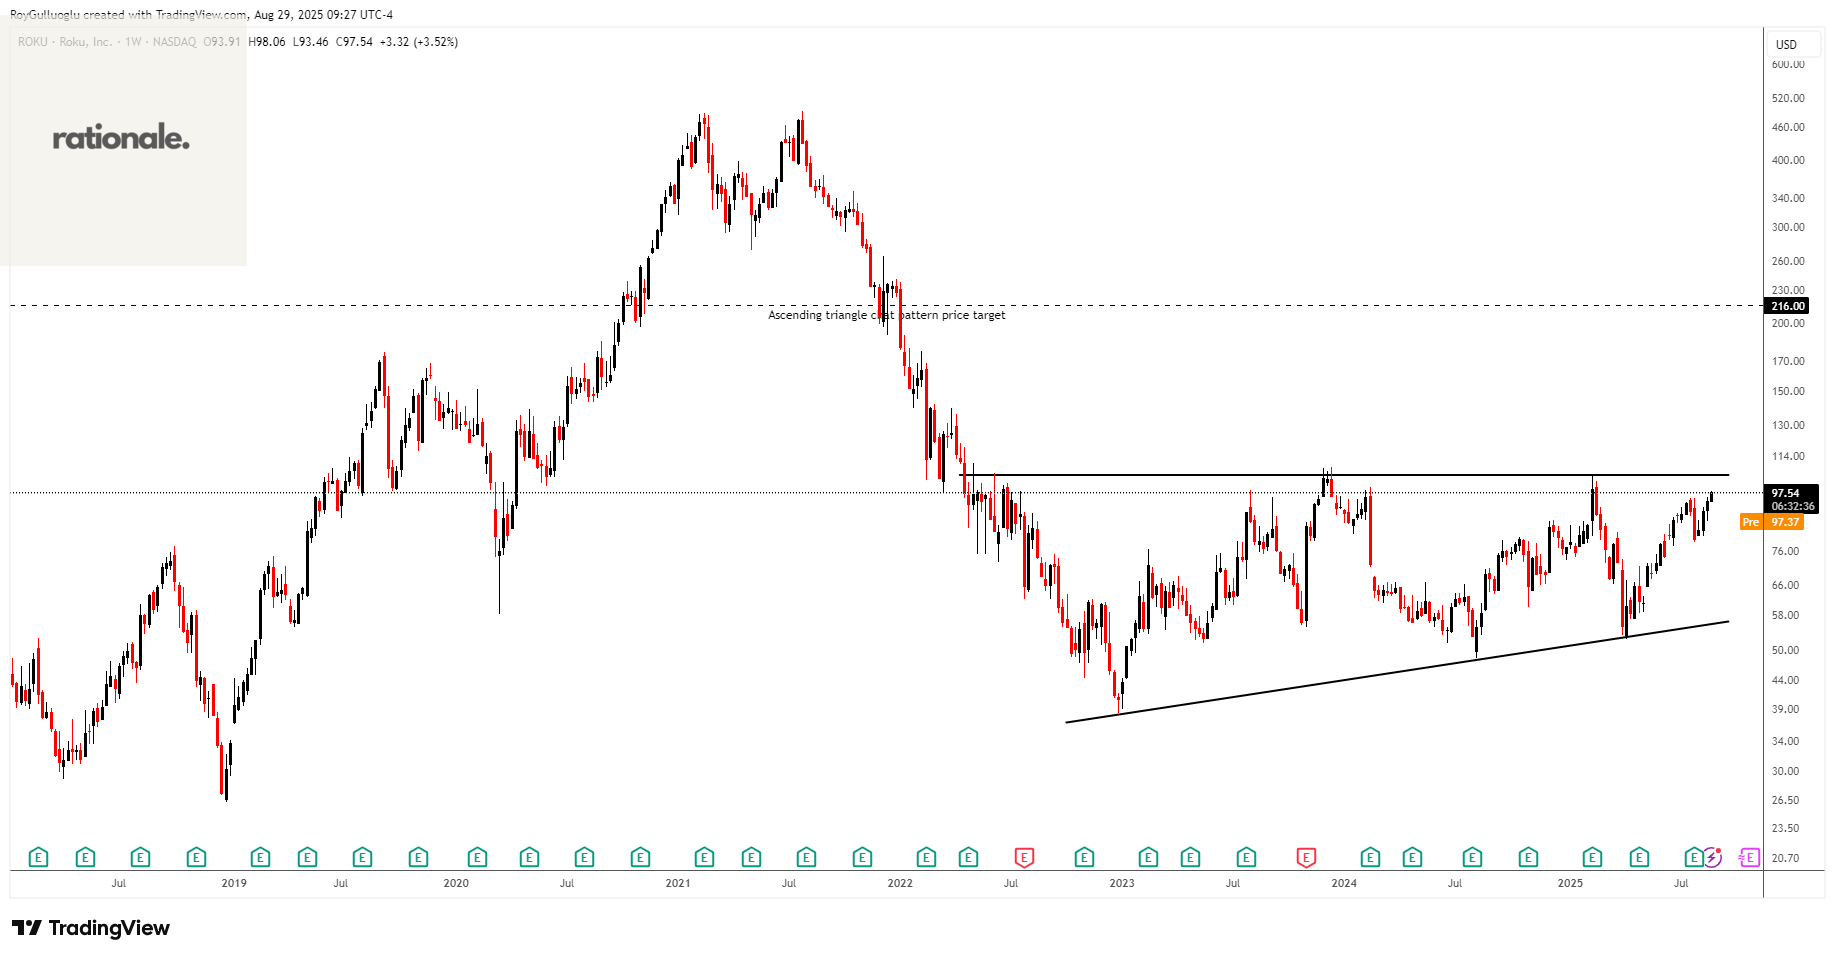
Roku, Inc., together with its subsidiaries, operates a TV streaming platform in the United States and internationally.
The above weekly chart formed an approximately 35-month-long ascending triangle chart pattern as a bullish reversal after a downtrend.
The horizontal boundary at 105 levels acts as a resistance within this pattern.
A daily close above 108.15 levels would validate the breakout from the 35-month-long ascending triangle chart pattern.
Based on this chart pattern, the potential price target is 216 levels.
ROKU, classified under the "communication services" sector, falls under the “Large Cap - Growth” stock category.
Peugeot Invest SA-(PEUG/EURONEXT)-Long Idea
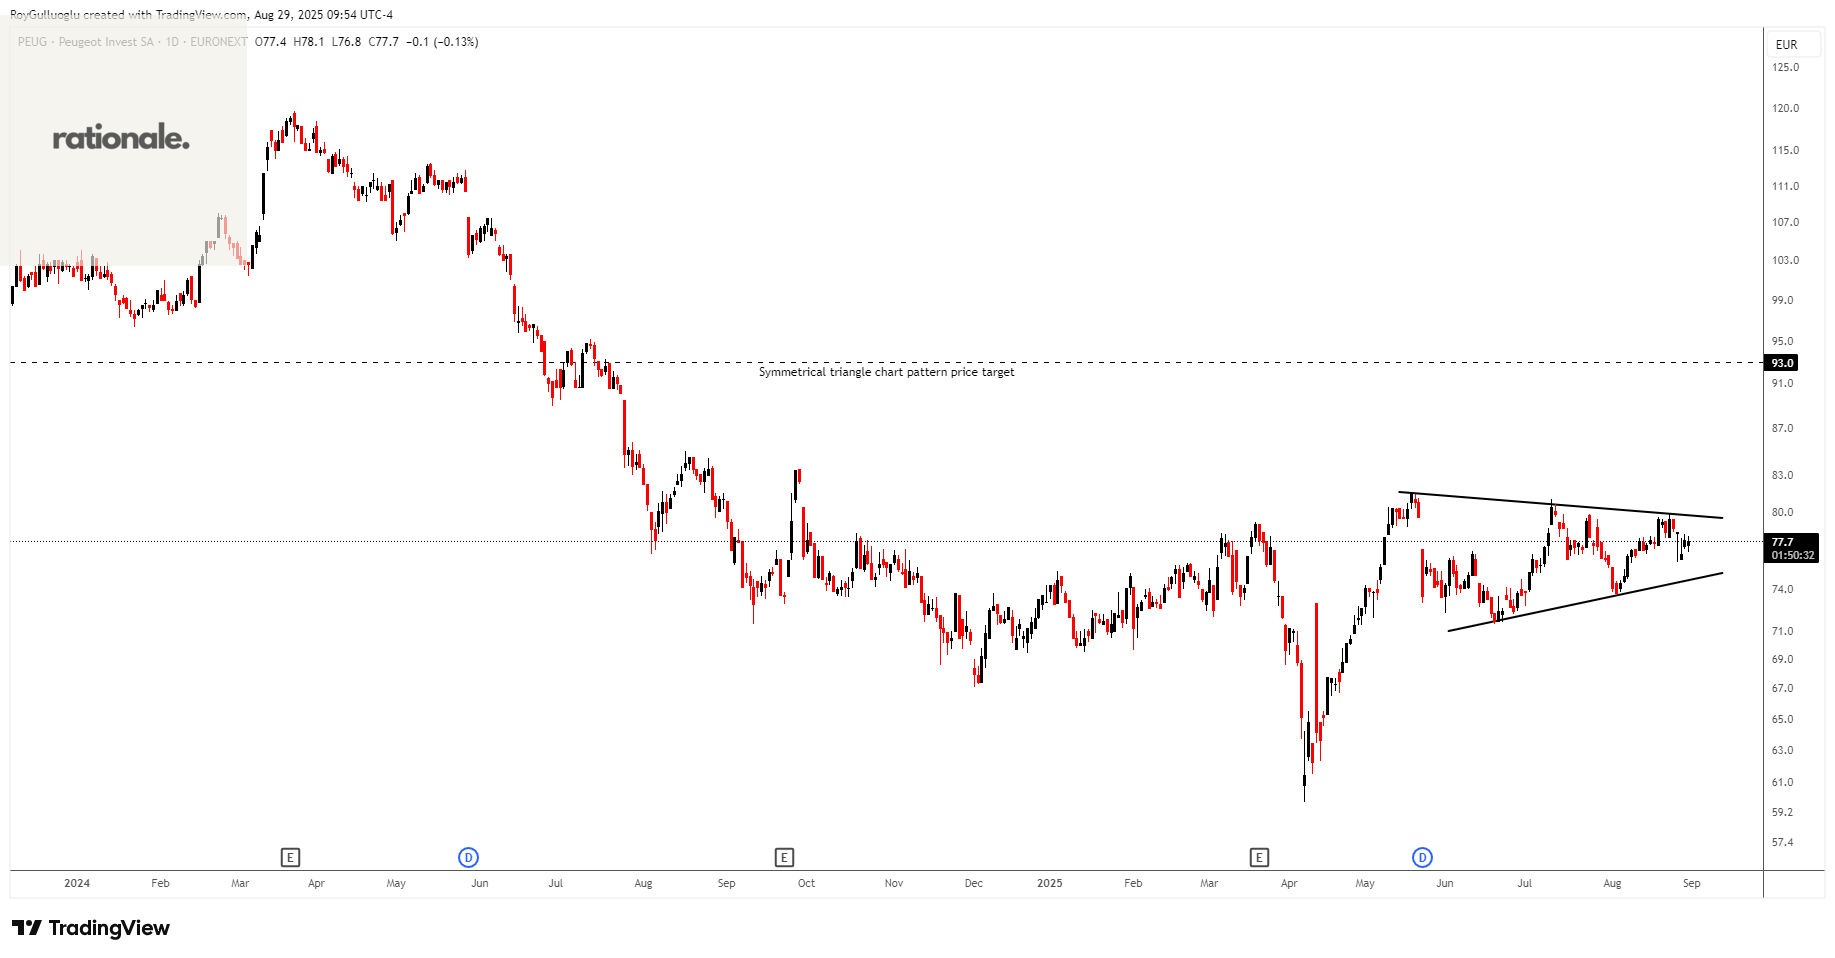
Peugeot Invest operates as an investment firm, with a focus on private equity, real estate funds, and strategic equity stakes in companies
The above daily chart formed an approximately 3-month-long symmetrical triangle chart pattern as a bullish continuation after an uptrend.
The horizontal boundary at 79.9 levels acts as a resistance within this pattern.
A daily close above 82.3 levels would validate the breakout from the 6-month-long H&S bottom chart pattern.
Based on this chart pattern, the potential price target is 93 levels.
Rexel S.A.-(RXL/EURONEXT)-Long Idea
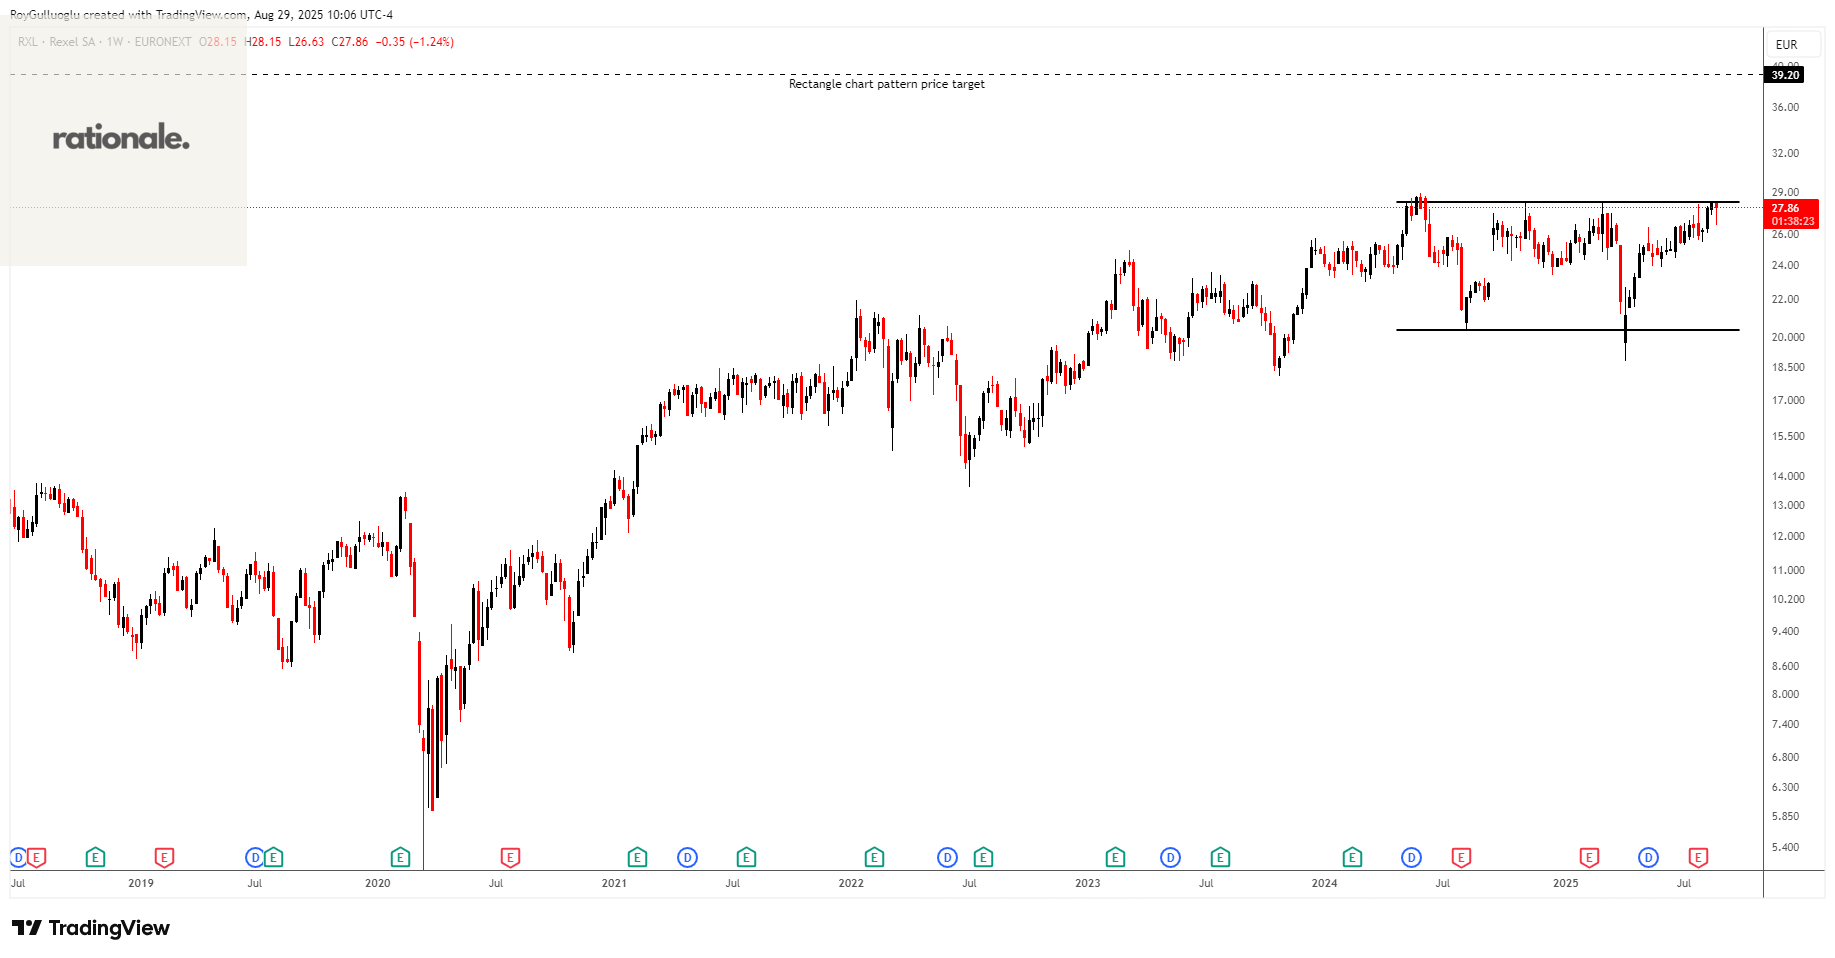
Rexel S.A., together with its subsidiaries, engages in the distribution of low and ultra-low voltage electrical products for the residential, commercial, and industrial markets in France, rest of Europe, North America, and the Asia-Pacific.
The above weekly chart formed an approximately 16-month-long rectangle chart pattern as a bullish continuation after an uptrend.
The horizontal boundary at 28.25 levels acts as a resistance within this pattern.
A daily close above 29 levels would validate the breakout from the 16-month-long rectangle chart pattern.
Based on this chart pattern, the potential price target is 39.2 levels.