

Trade Ideas Fx-Futures-Etf-Crypto
AL1!(COMEX), NIFTY1!(NSEIX), EMLC(ARCA), IWS(ARCA), DBC(ARCA)

AL1!(Aluminum Futures)-Long Idea
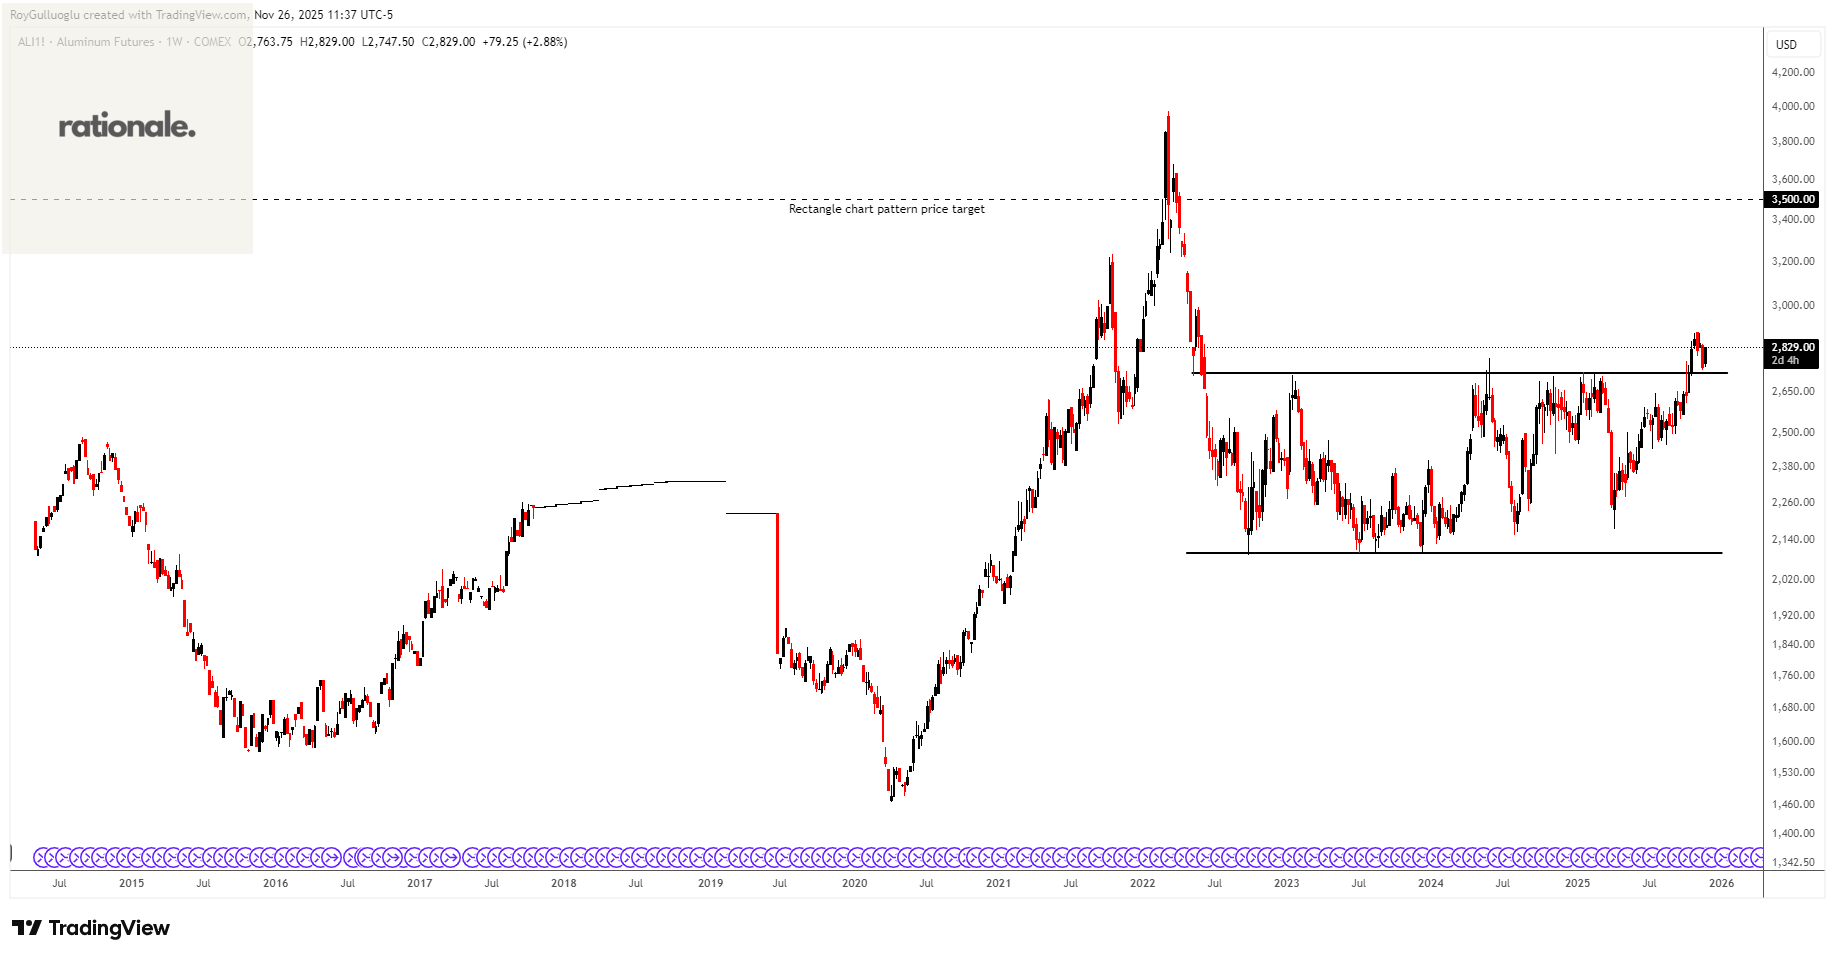
The above weekly chart formed an approximately 37-month-long rectangle chart pattern as a bullish reversal after a downtrend.
The horizontal boundary at 2724 levels acted as a resistance within this pattern.
A daily close above 2805 levels validated the breakout from the 37-month-long rectangle chart pattern.
Based on this chart pattern, the potential price target is approximately 3500 levels.
NIFTY1!(NIFTY 50 Index Futures)-Long Idea
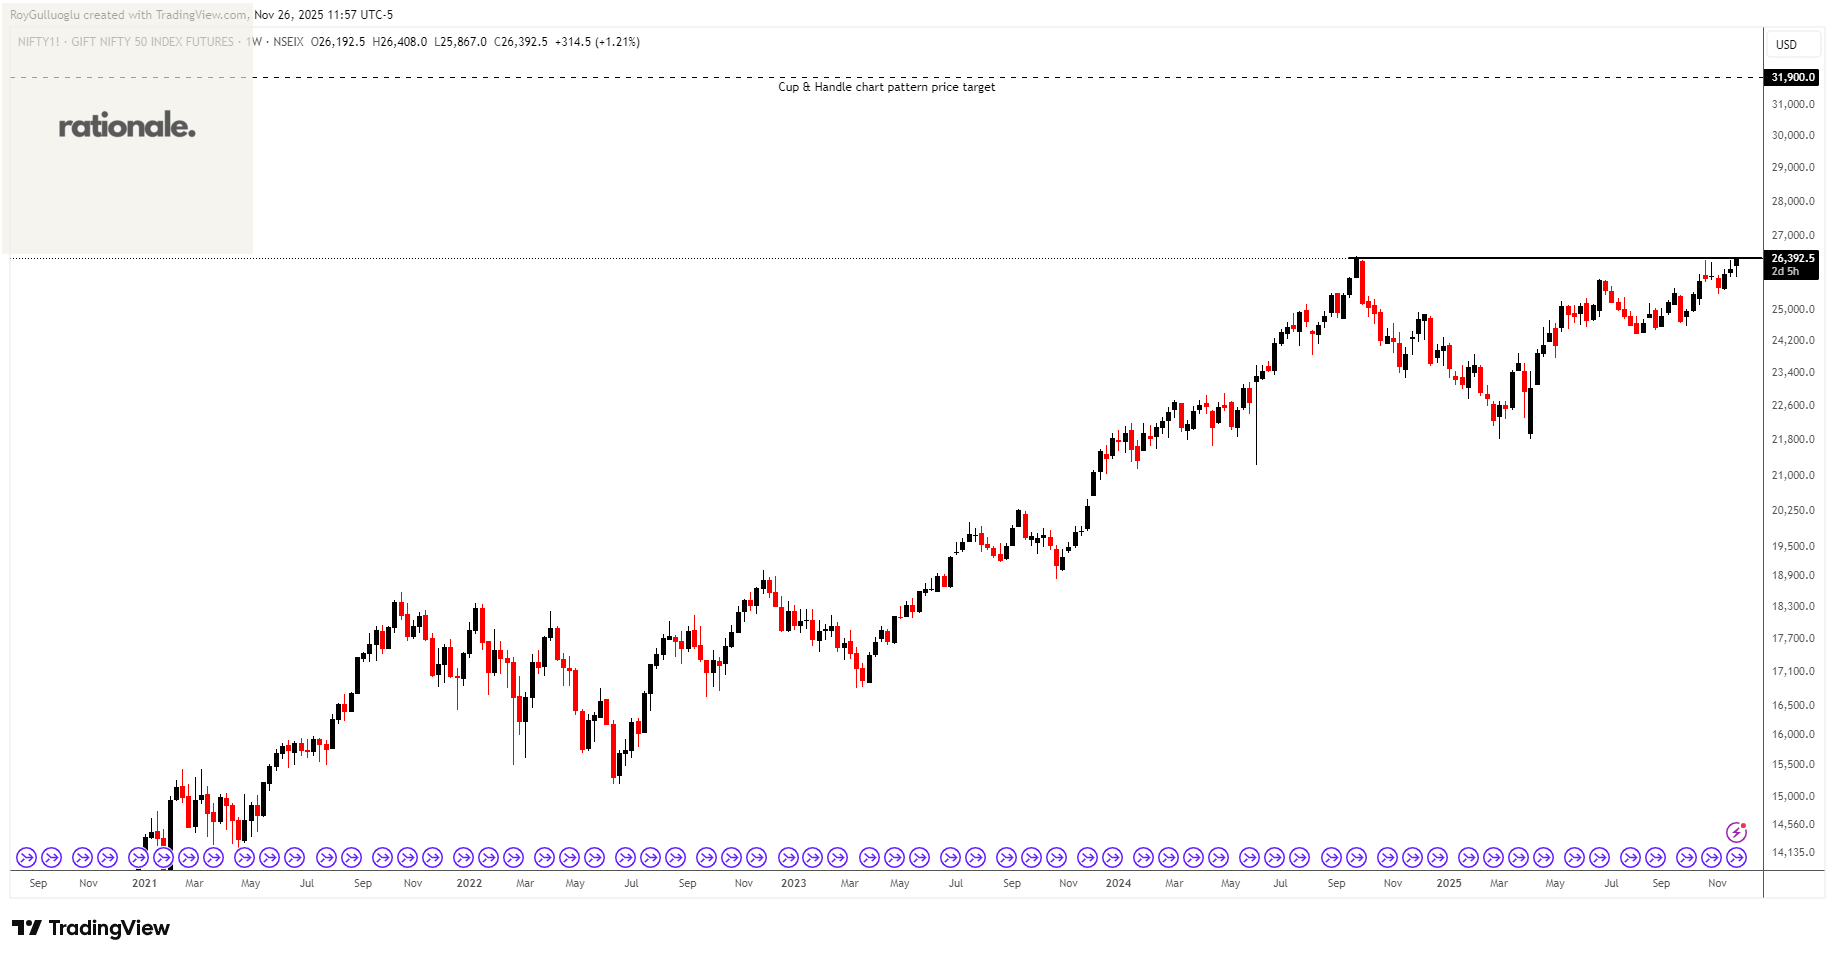
The above weekly chart formed an approximately 15-month-long cup & handle chart pattern as a bullish continuation after an uptrend.
The horizontal boundary at 26406 levels acts as a resistance within this pattern.
A daily close above 27198 levels would validate the breakout from the 15-month-long cup & handle chart pattern.
Based on this chart pattern, the potential price target is approximately 31900 levels.
VanEck J.P. Morgan EM Local Currency Bond ETF-(EMLC/ARCA)-Long Idea
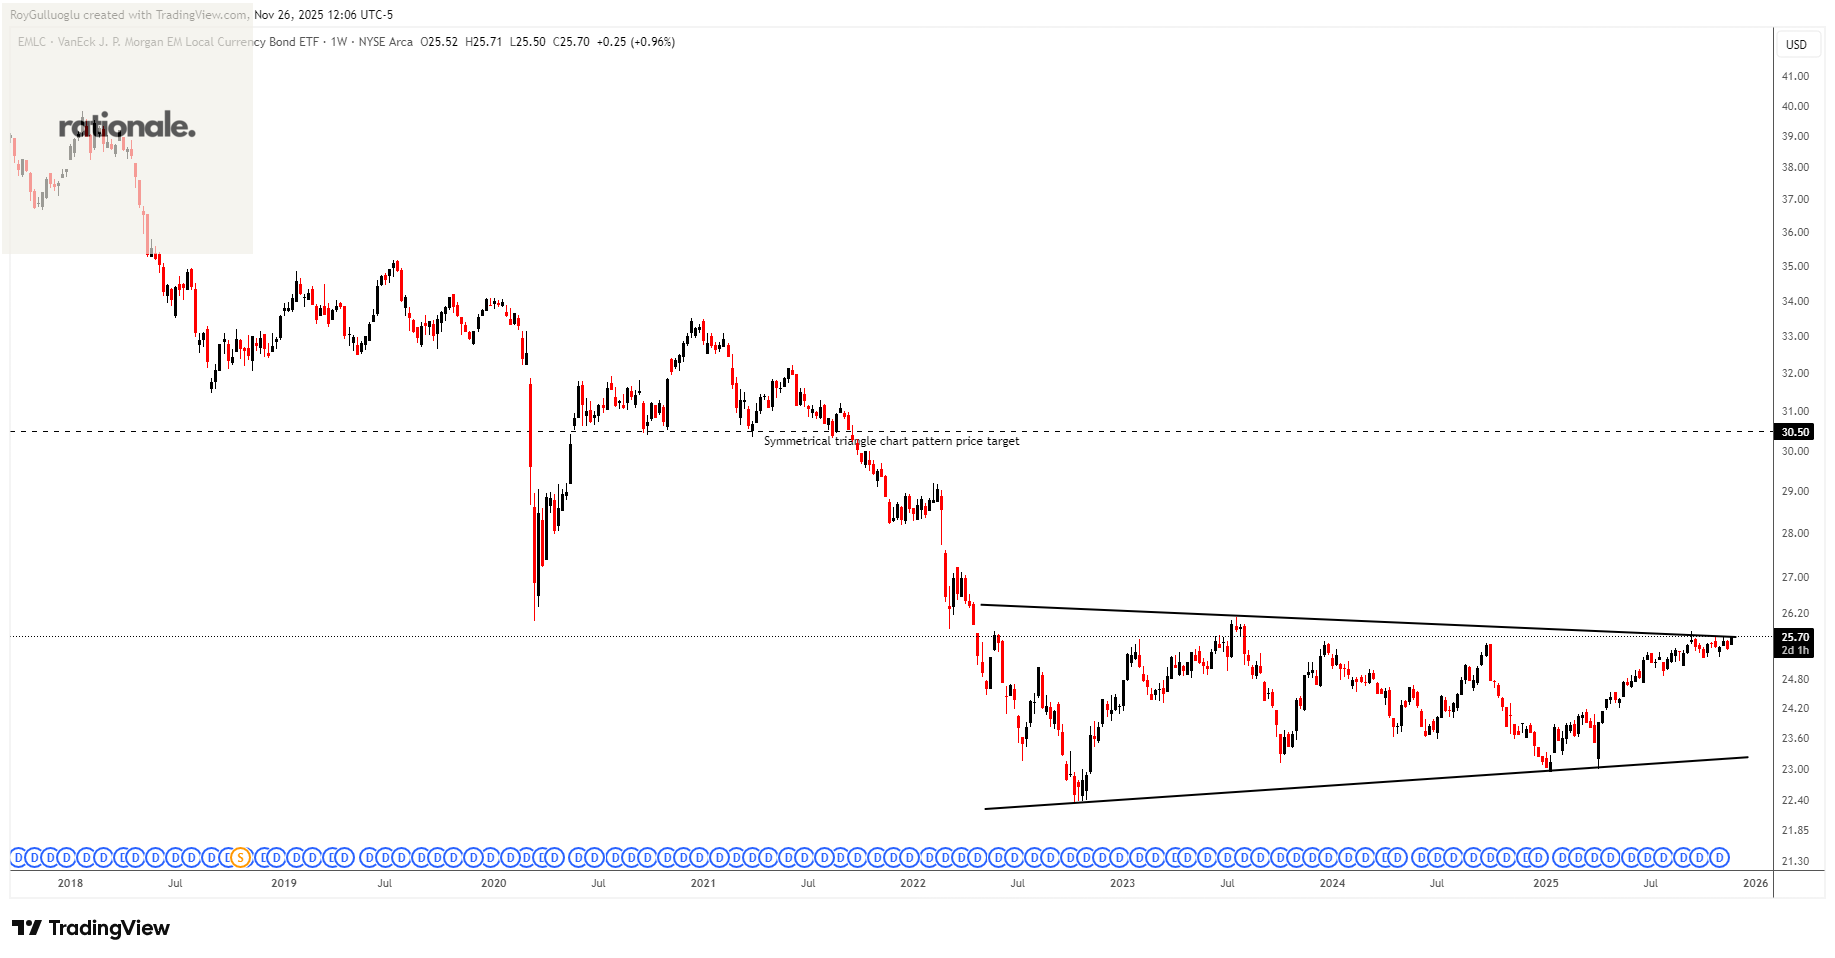
The above weekly chart formed an approximately 37-month-long symmetrical triangle chart pattern as a bullish reversal after a downtrend.
A daily close above 26.5 levels would validate the breakout from the 37-month-long symmetrical triangle chart pattern.
Based on this chart pattern, the potential price target is approximately 30.5 levels.
iShares Russell Mid-Cap Value ETF-(IWS/ARCA)-Long Idea
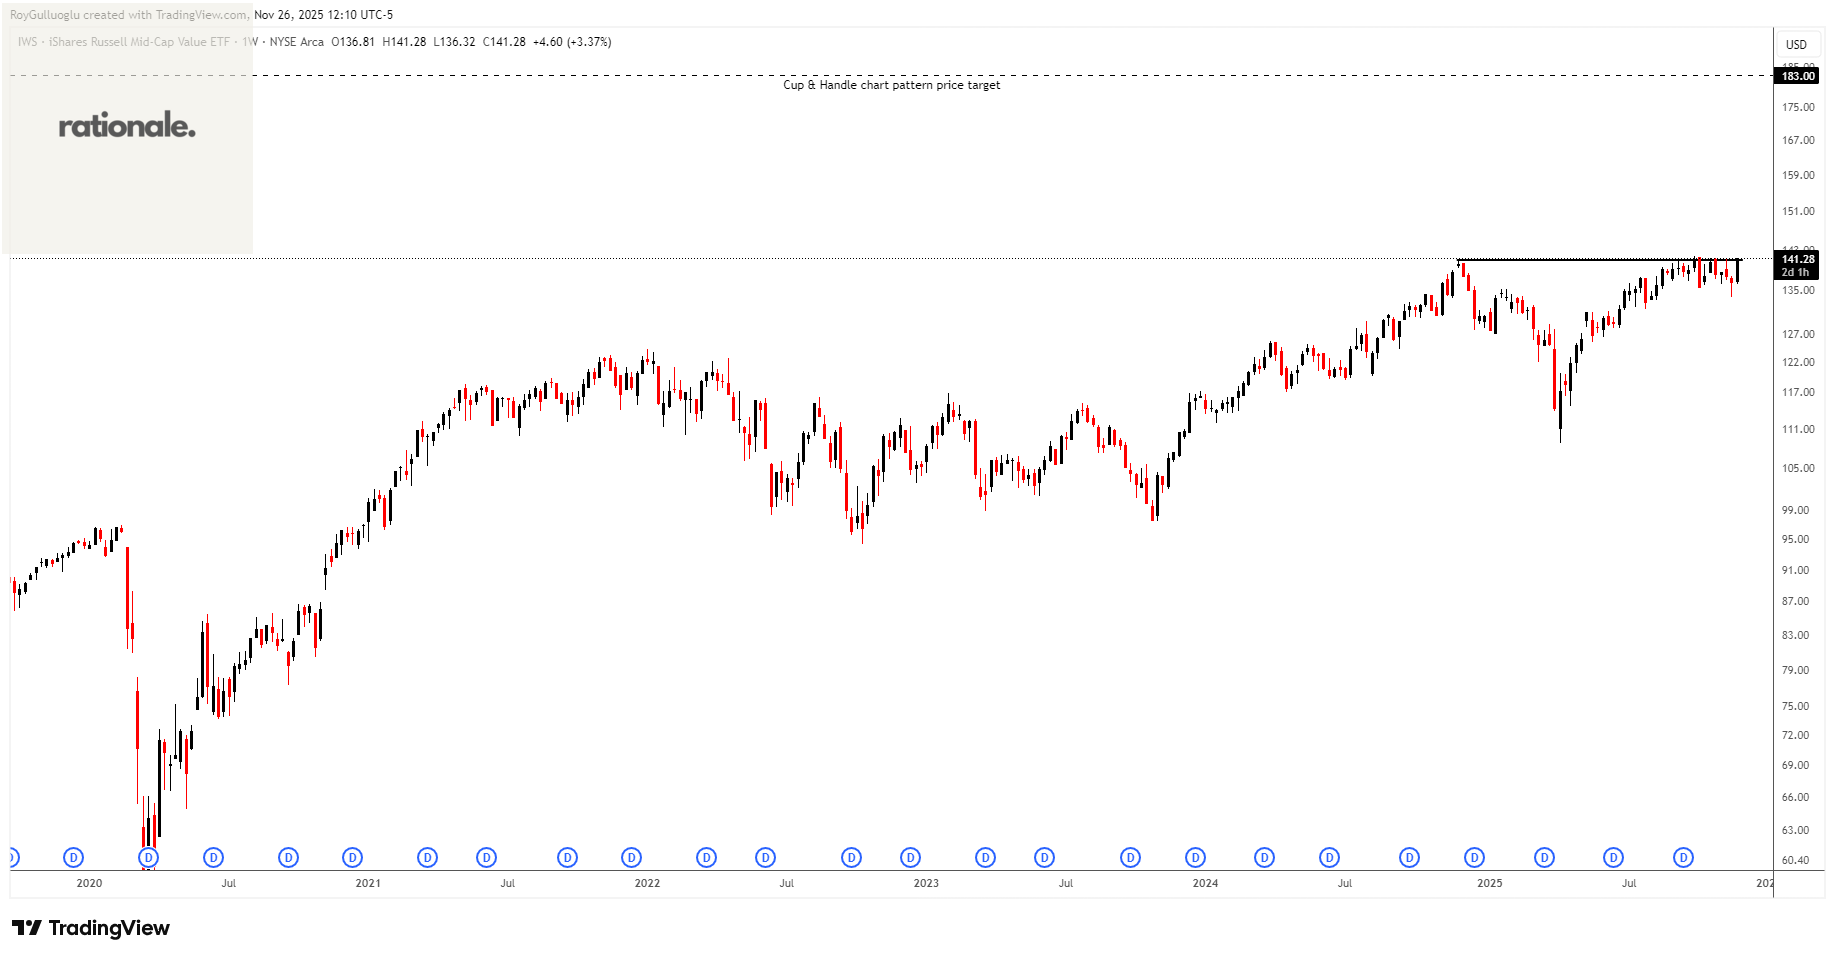
The above weekly chart formed an approximately 12-month-long cup & handle chart pattern as a bullish continuation after an uptrend.
The horizontal boundary at 140.95 levels acts as a resistance within this pattern.
A daily close above 145.17 levels would validate the breakout from the 12-month-long cup & handle chart pattern.
Based on this chart pattern, the potential price target is approximately 183 levels.
Invesco DB Commodity Index Tracking Fund-(DBC/ARCA)-Long Idea
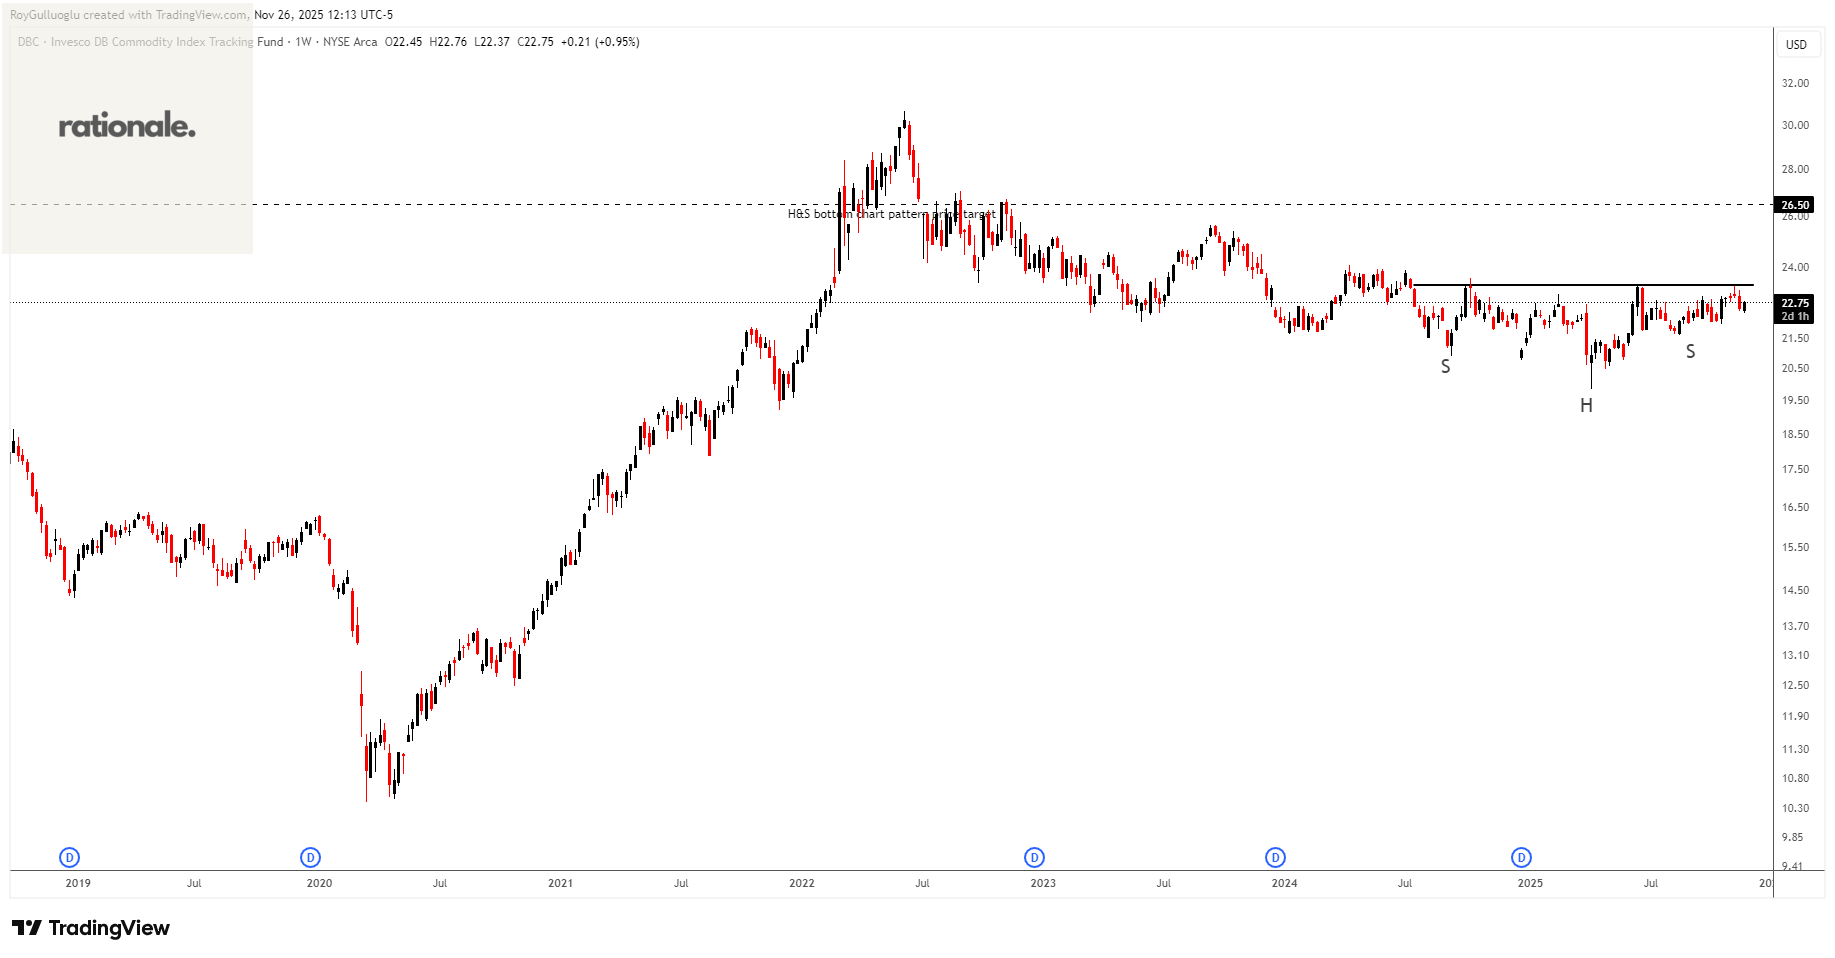
The above weekly chart formed an approximately 18-month-long H&S bottom chart pattern as a bullish reversal after a downtrend.
The horizontal boundary at 23.35 levels acts as a resistance within this pattern.
A daily close above 24 levels would validate the breakout from the 18-month-long H&S bottom chart pattern.
Based on this chart pattern, the potential price target is approximately 26.5 levels.