

Trade Ideas Equities
AA(NYSE), ALLY(NYSE), ACGL(NASDAQ), MCO(NYSE), EIX(NYSE), CB(NYSE)

Alcoa Corporation-(AA/NYSE)-Long Idea
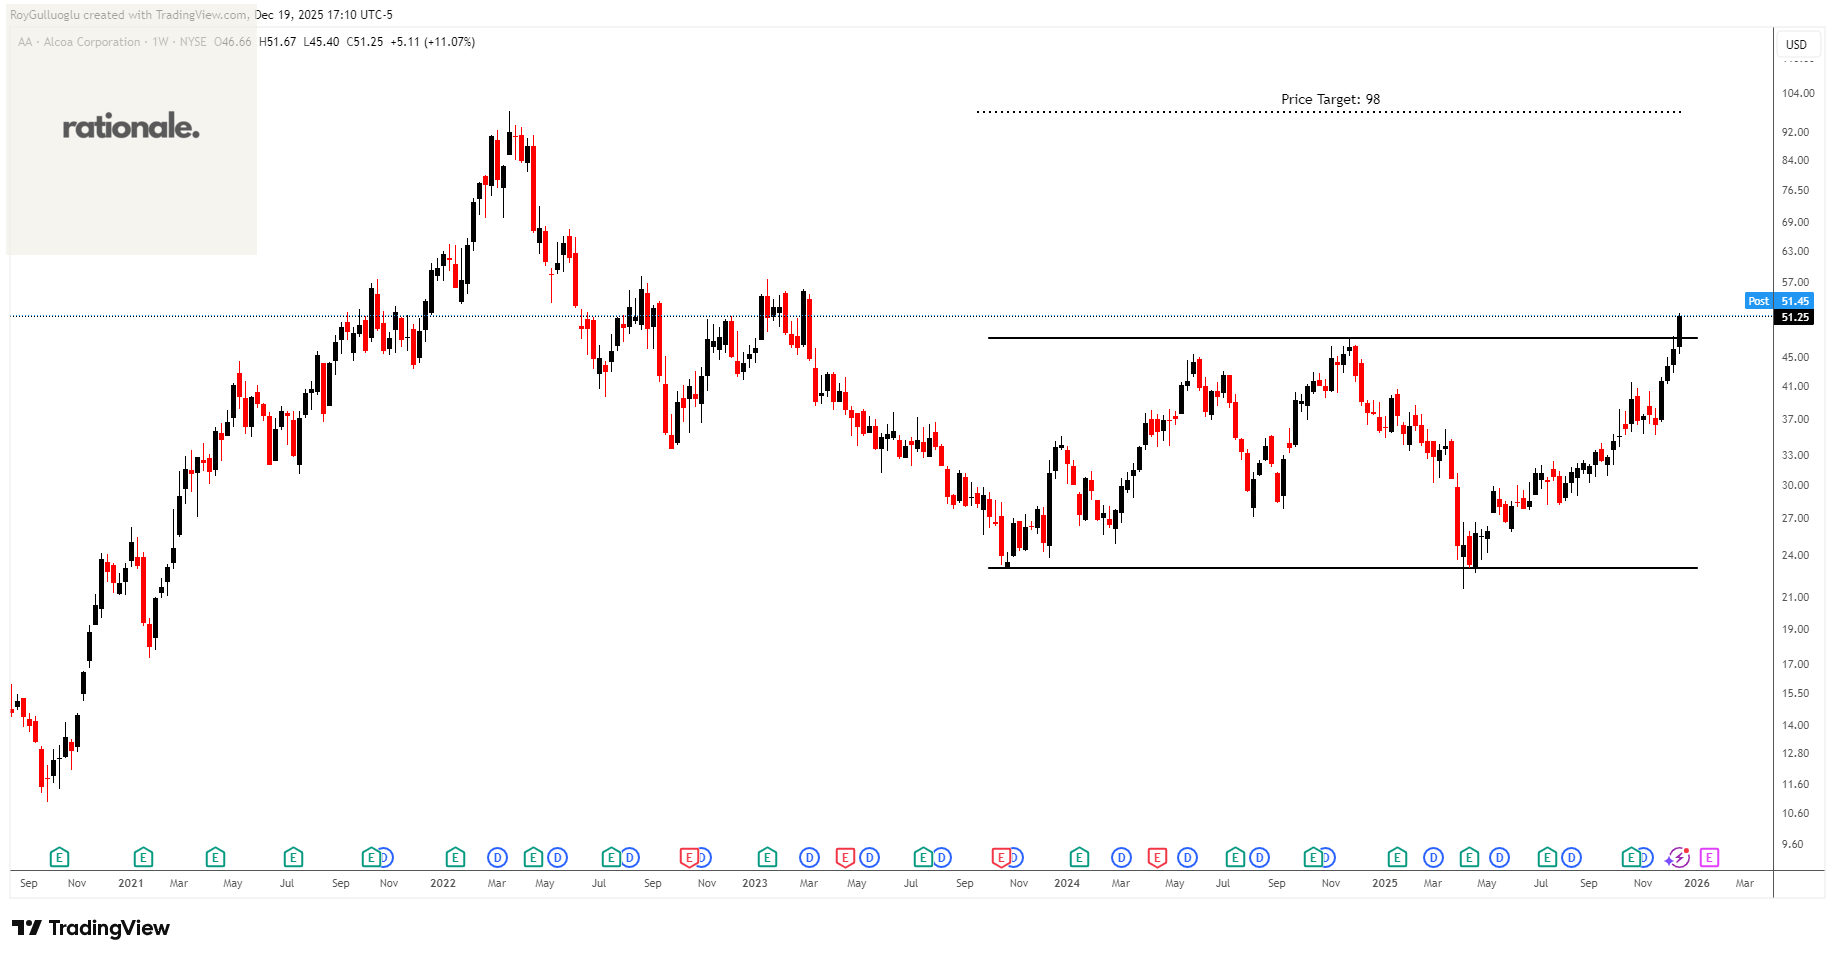
Alcoa Corporation, together with its subsidiaries, engages in the bauxite mining, alumina refining, aluminum production, and energy generation business in Australia, Brazil, Canada, Iceland, Norway, Spain, the United States, and internationally.
The above daily chart formed an approximately 28-month-long rectangle chart pattern as a bullish reversal after a downtrend.
The horizontal boundary at 47.77 levels acted as a resistance within this pattern.
A daily close above 49.2 levels validated the breakdown from the 28-month-long rectangle chart pattern.
Based on this chart pattern, the potential price target is 98 levels.
Ally Financial Inc.-(ALLY/NYSE)-Long Idea
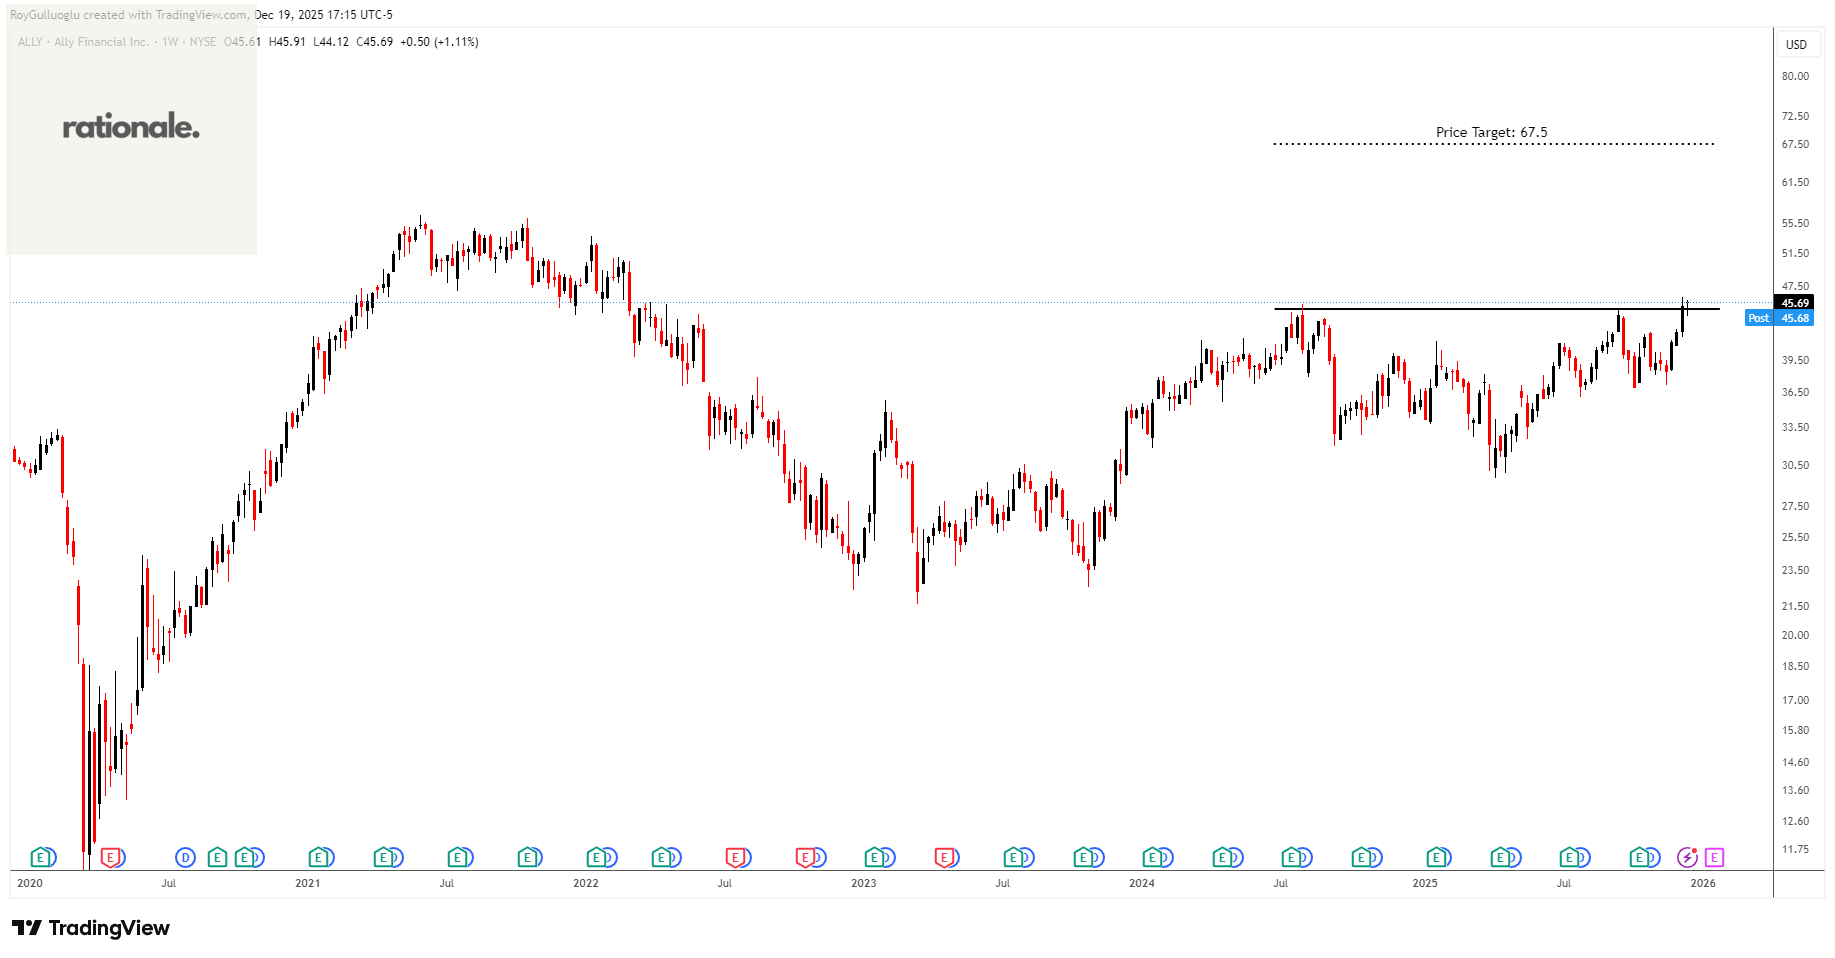
Ally Financial Inc., a digital financial-services company, provides various digital financial products and services in the United States, Canada, and Bermuda.
The above weekly chart formed an approximately 17-month-long cup & handle chart pattern as a bullish continuation after an uptrend.
The horizontal boundary at 44.83 levels acts as a resistance within this pattern.
A daily close above 46.18 levels would validate the breakout from the 17-month-long cup & handle chart pattern.
Based on this chart pattern, the potential price target is 67.5 levels.
Arch Capital Group Ltd.-(ACGL/NASDAQ)-Long Idea
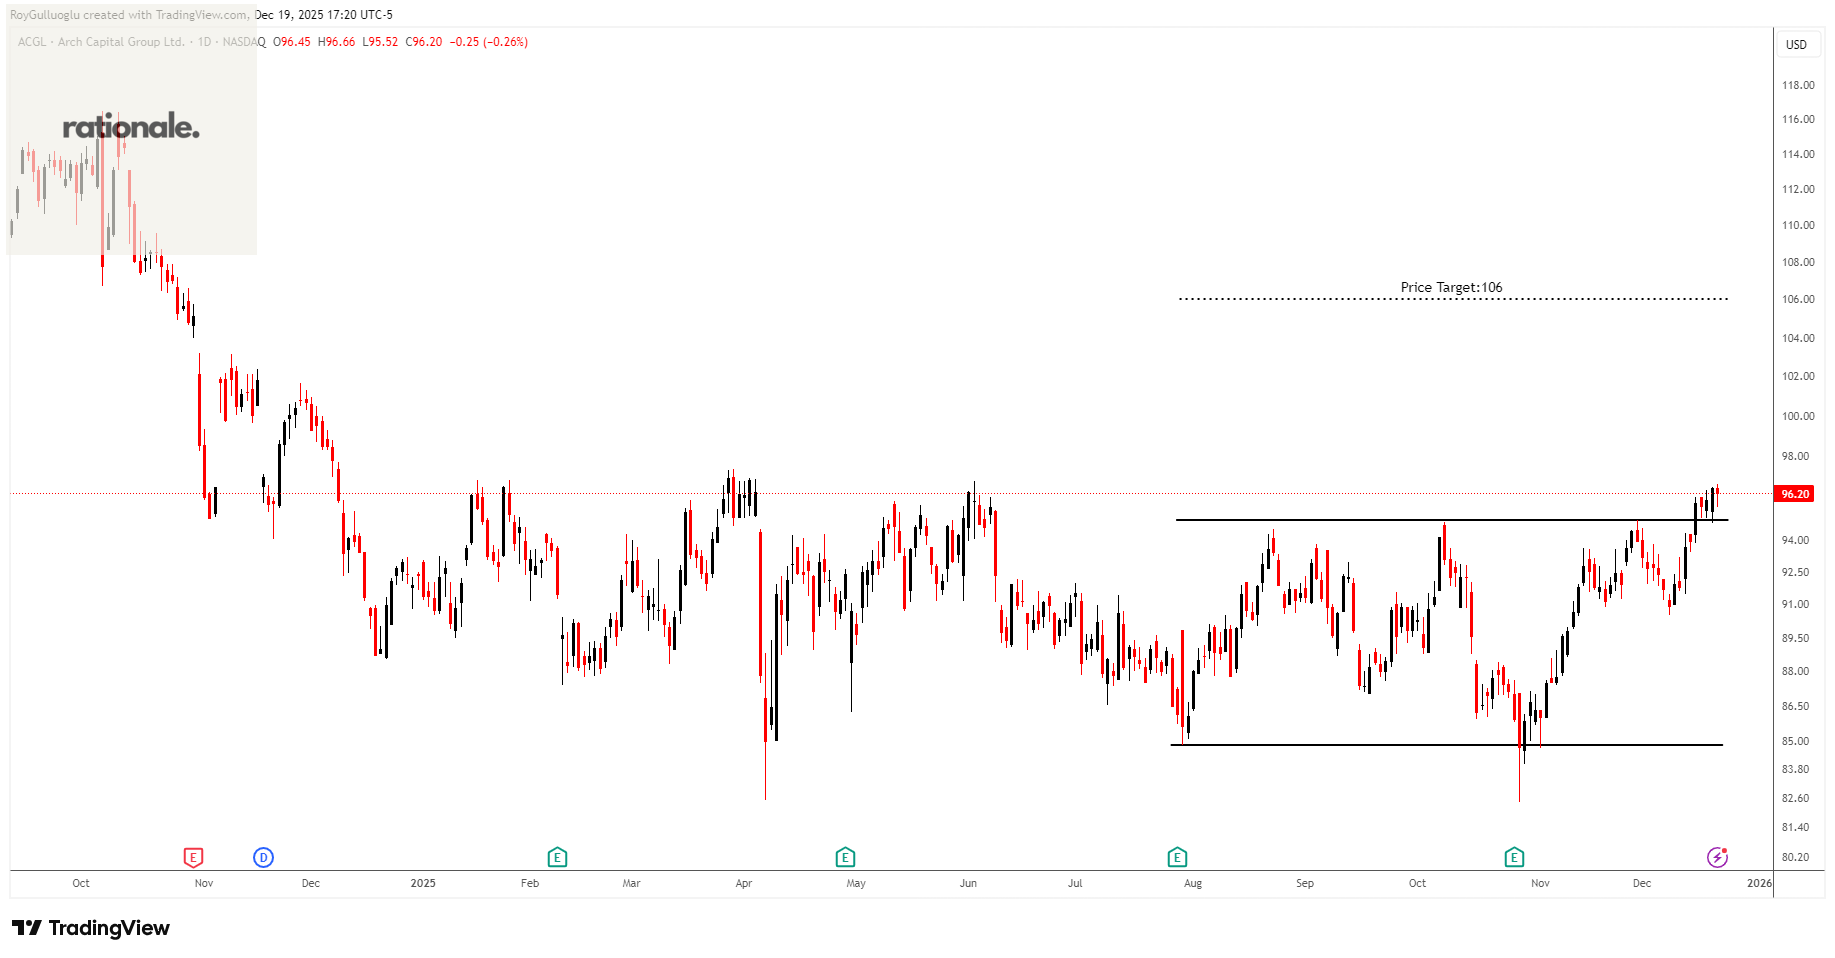
Arch Capital Group Ltd., together with its subsidiaries, provides insurance, reinsurance, and mortgage insurance products in the United States, Canada, Bermuda, the United Kingdom, Europe, and Australia.
The above daily chart formed an approximately 3-month-long rectangle chart pattern as a bullish reversal after a downtrend.
The horizontal boundary at 94.94 levels acted as a resistance within this pattern.
A daily close above 97.78 levels validated the breakout from the 3-month-long rectangle chart pattern.
Based on this chart pattern, the potential price target is 106 levels.
Moody’s Corporation-(MCO/NYSE)-Long Idea
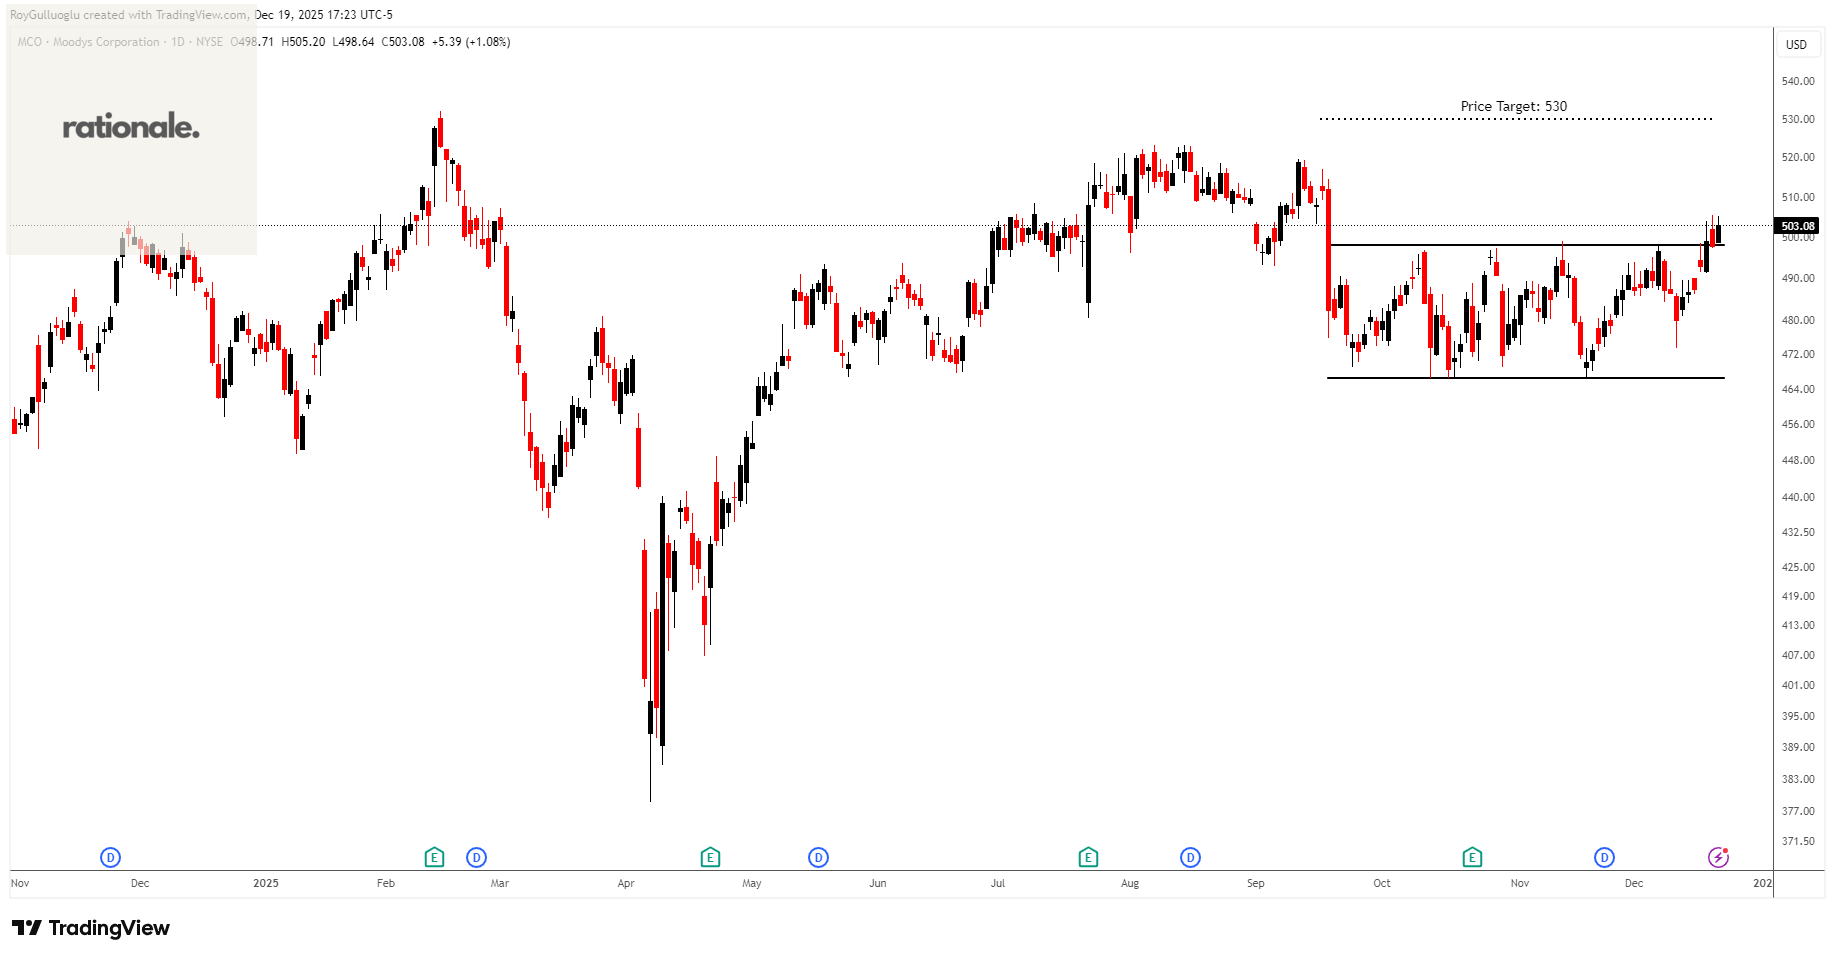
Moody’s Corporation operates as an integrated risk assessment firm worldwide. It operates in two segments, Moody’s Analytics and Moody’s Investors Services.
The above daily chart formed an approximately 2-month-long rectangle chart pattern as a bullish reversal after a downtrend.
The horizontal boundary at 498 levels acted as a resistance within this pattern.
A daily close above 502.5 levels validated the breakout from the 2-month-long rectangle chart pattern.
Based on this chart pattern, the potential price target is 530 levels.
Edison International-(EIX/NYSE)-Long Idea
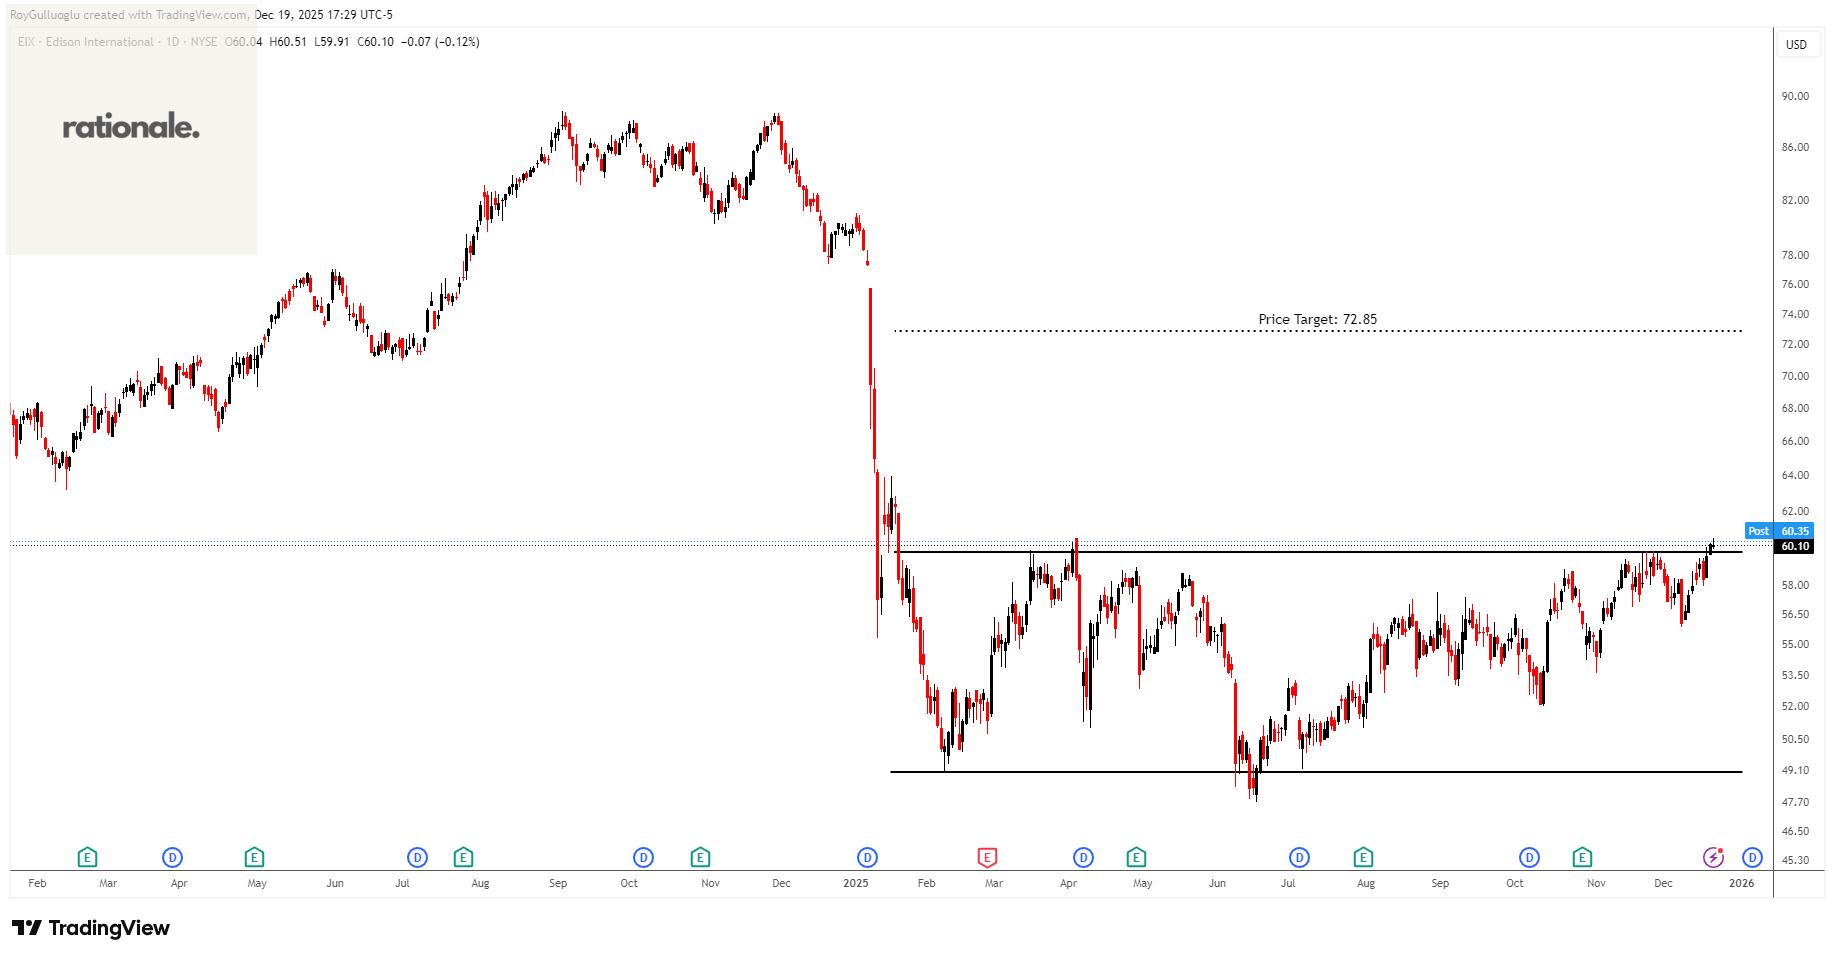
Edison International, through its subsidiaries, engages in the generation and distribution of electric power.
The above daily chart formed an approximately 7-month-long rectangle chart pattern as a bullish reversal after a downtrend.
The horizontal boundary at 59.73 levels acts as a resistance within this pattern.
A daily close above 61.5 levels validated the breakout from the 7-month-long rectangle chart pattern.
Based on this chart pattern, the potential price target is 72.85 levels.
Chubb Limited-(CB/NYSE)-Long Idea
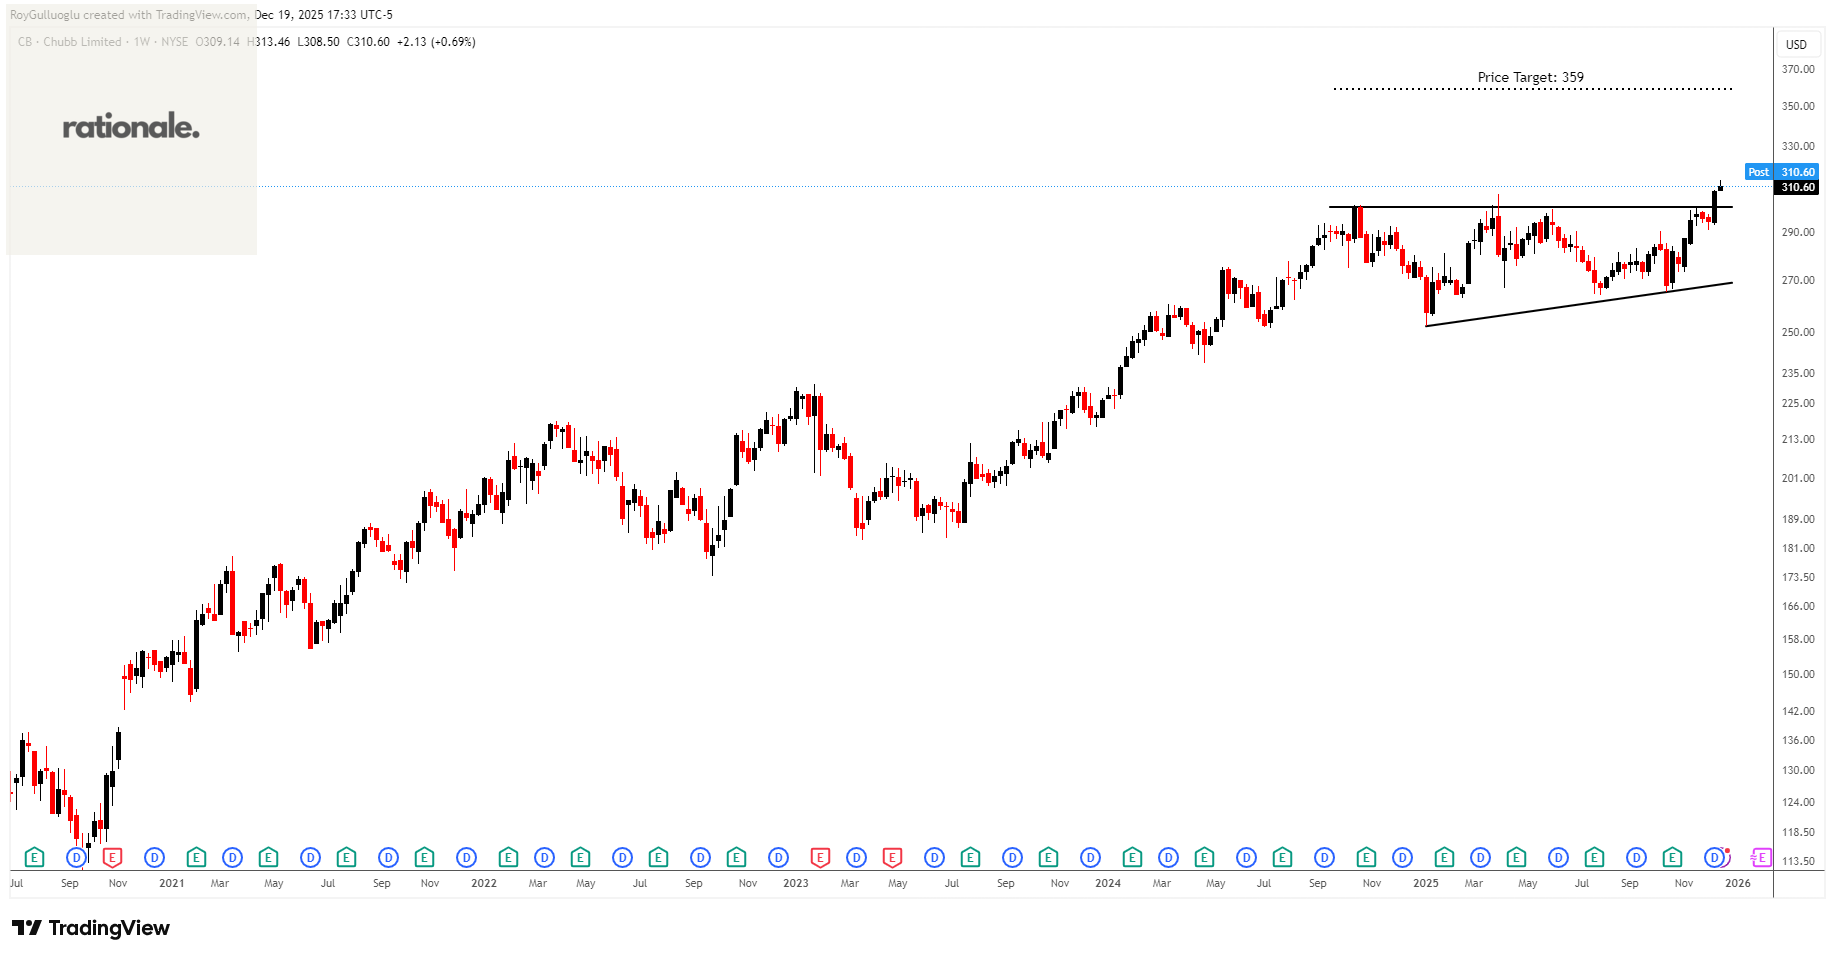
Chubb Limited provides insurance and reinsurance products worldwide.
The above daily chart formed an approximately 15-month-long ascending triangle chart pattern as a bullish continuation after an uptrend.
The horizontal boundary at 301 levels acted as a resistance within this pattern.
A daily close above 310 levels validated the breakout from the 15-month-long ascending triangle chart pattern.
Based on this chart pattern, the potential price target is 359 levels.
Teşekkürler Roy