


EBND(SPDR Bloomberg Emerging Markets Local Bond ETF)-Long Idea
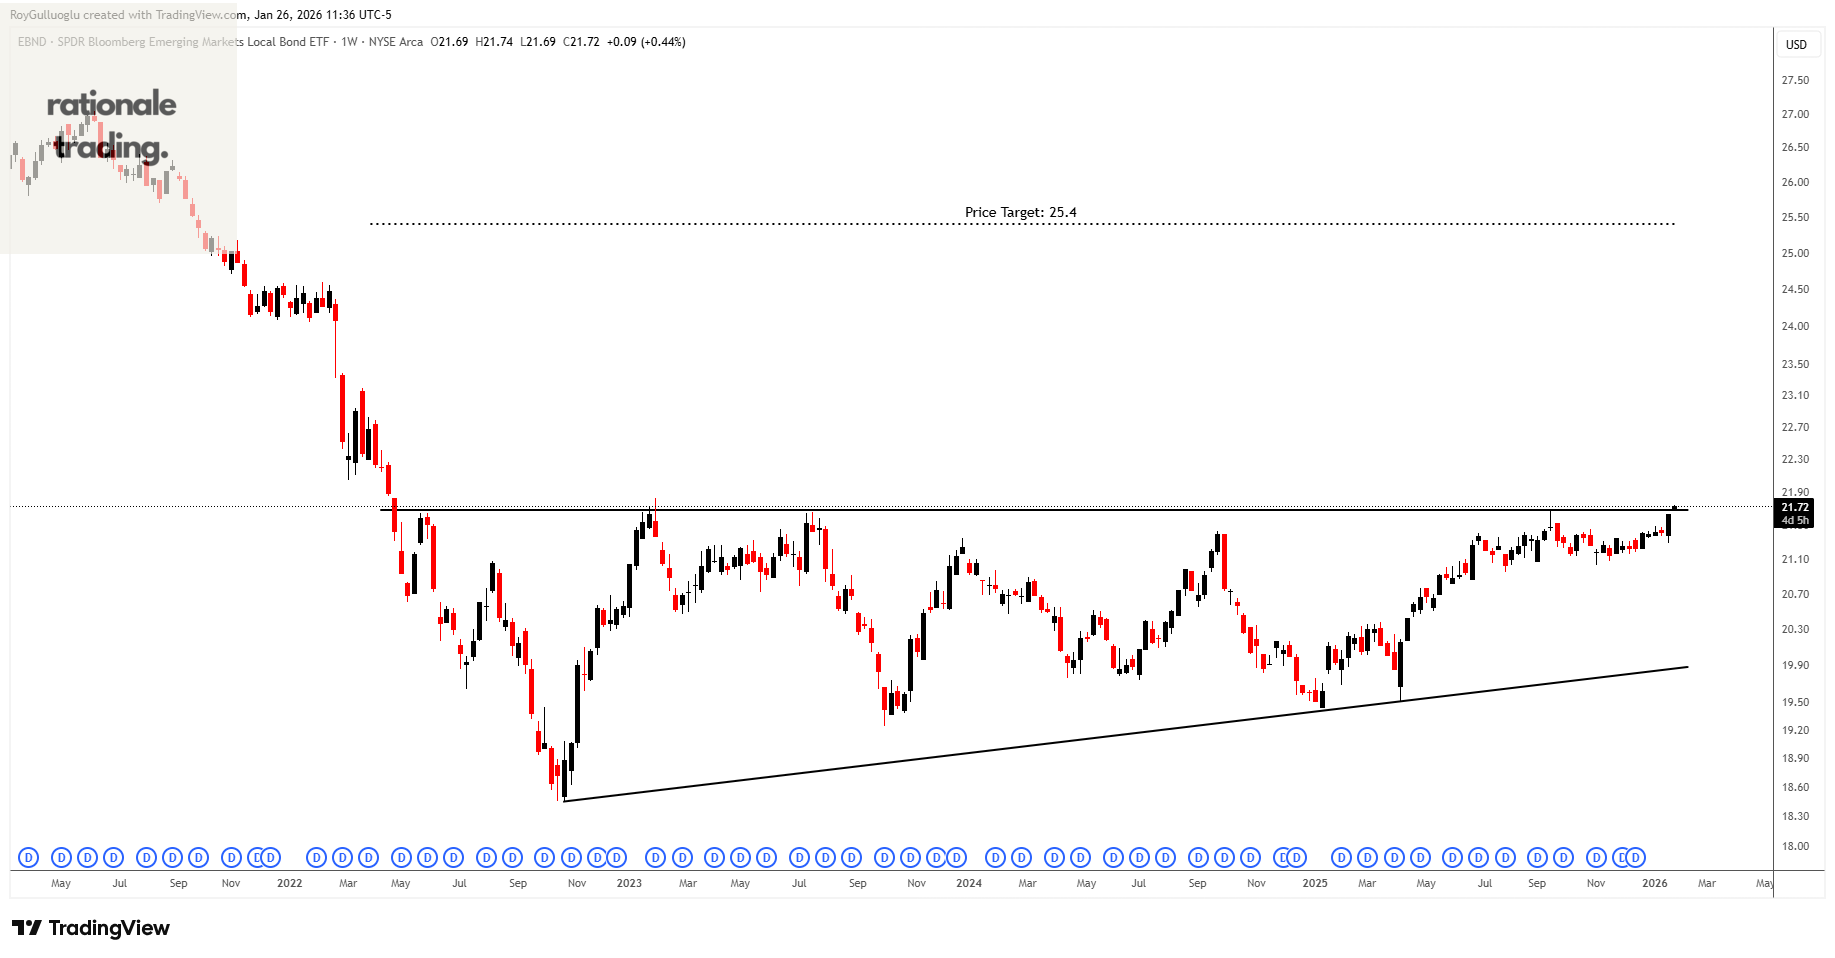
EBND tracks a market-value-weighted index of fixed-rate, local-currency sovereign debt from emerging-market countries.
The above weekly chart formed an approximately 30-month-long ascending triangle chart pattern as a bullish reversal after a downtrend.
The horizontal boundary at 21.68 levels acts as a resistance within this pattern.
A daily close above 21.9 levels would validate the breakout from the 30-month-long ascending triangle chart pattern.
Based on this chart pattern, the potential price target is approximately 25.4 levels.
Improving fiscal discipline in key EM countries: Countries such as Brazil and Mexico have shown improved fiscal credibility and tighter budget discipline, reducing sovereign risk premiums.
Risks to monitor: Renewed US dollar strength reversing FX gains
PGJ(Invesco Golden Dragon China ETF)-Long Idea
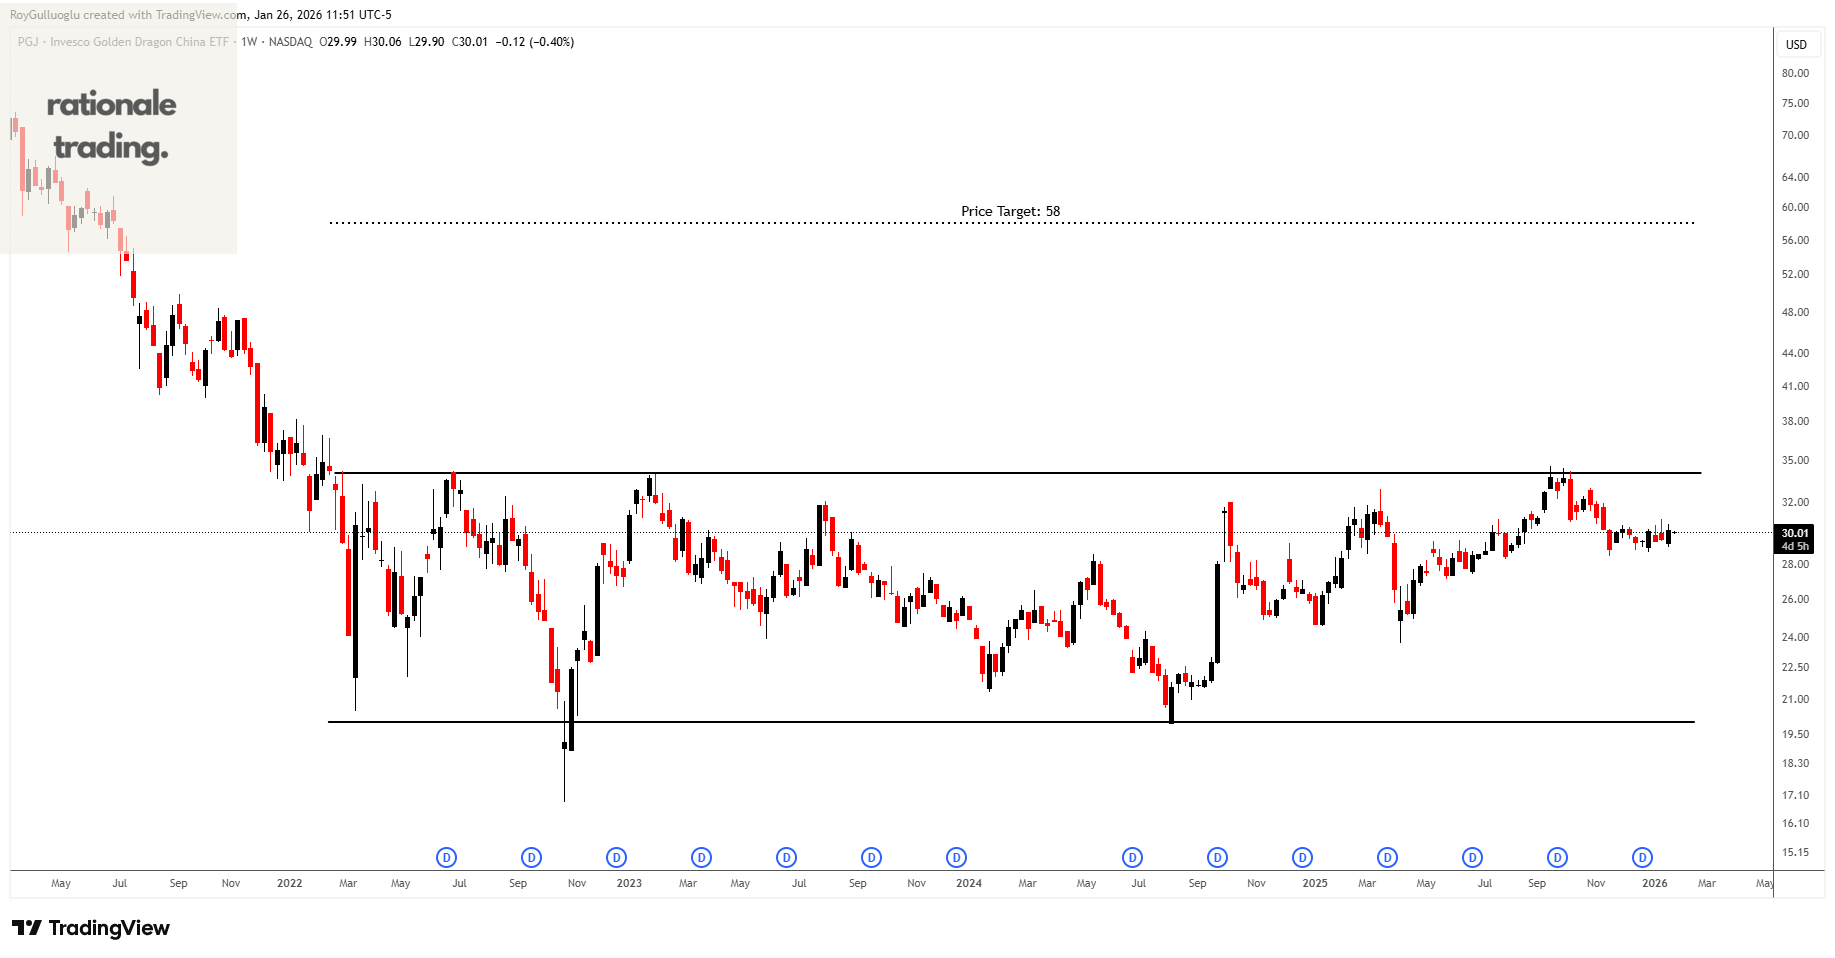
PGJ tracks a market-cap-weighted index of Chinese stocks.
The above weekly chart formed an approximately 31-month-long rectangle chart pattern as a bullish reversal after a downtrend.
The horizontal boundary at 34 levels acts as a resistance within this pattern.
A daily close above 35 levels would validate the breakout from the 31-month-long rectangle chart pattern.
Based on this chart pattern, the potential price target is approximately 58 levels.
Chinese authorities are taking steps to support growth and improve market confidence. With positioning still very low, even small policy actions can have a strong positive impact.
CL1!(Light Crude Oil Futures)-Long Idea
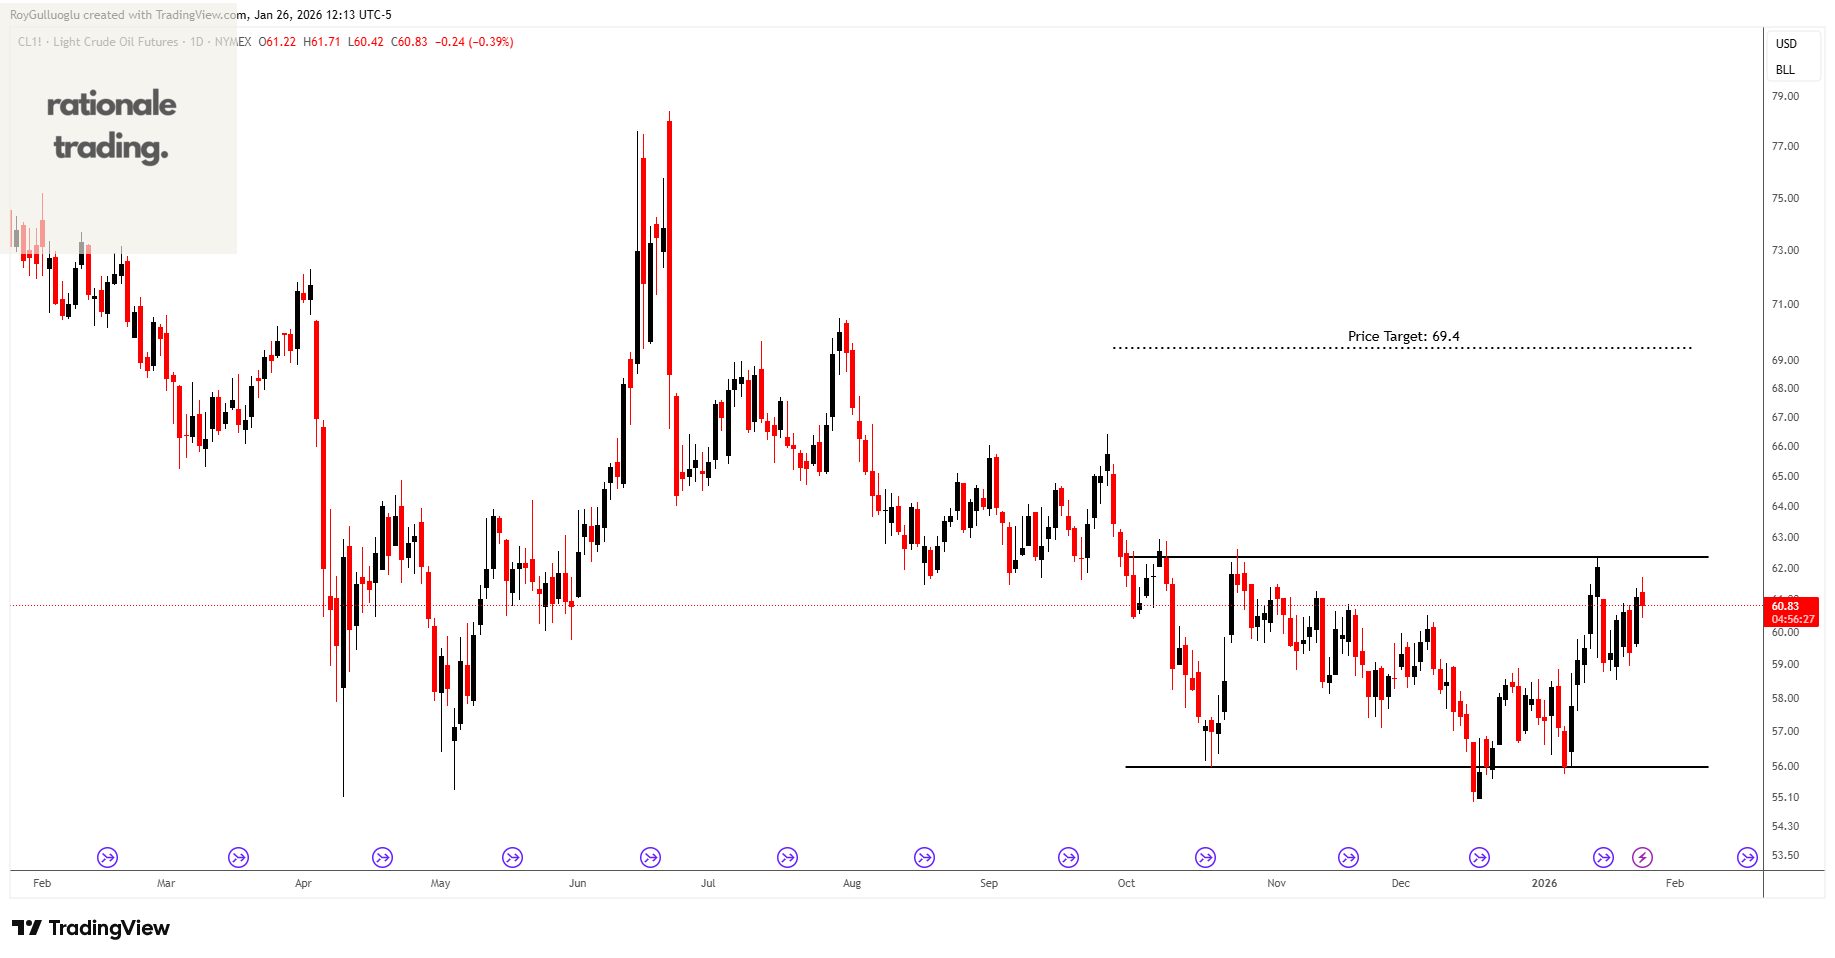
The above daily chart formed an approximately 3-month-long rectangle chart pattern as a bullish reversal after a downtrend.
The horizontal boundary at 62.36 levels acts as a resistance within this pattern.
A daily close above 63 levels would validate the breakout from the 3-month-long rectangle chart pattern.
Based on this chart pattern, the potential price target is approximately 69.4 levels.
CT1!(Cotton No:2 Futures)-Short Idea
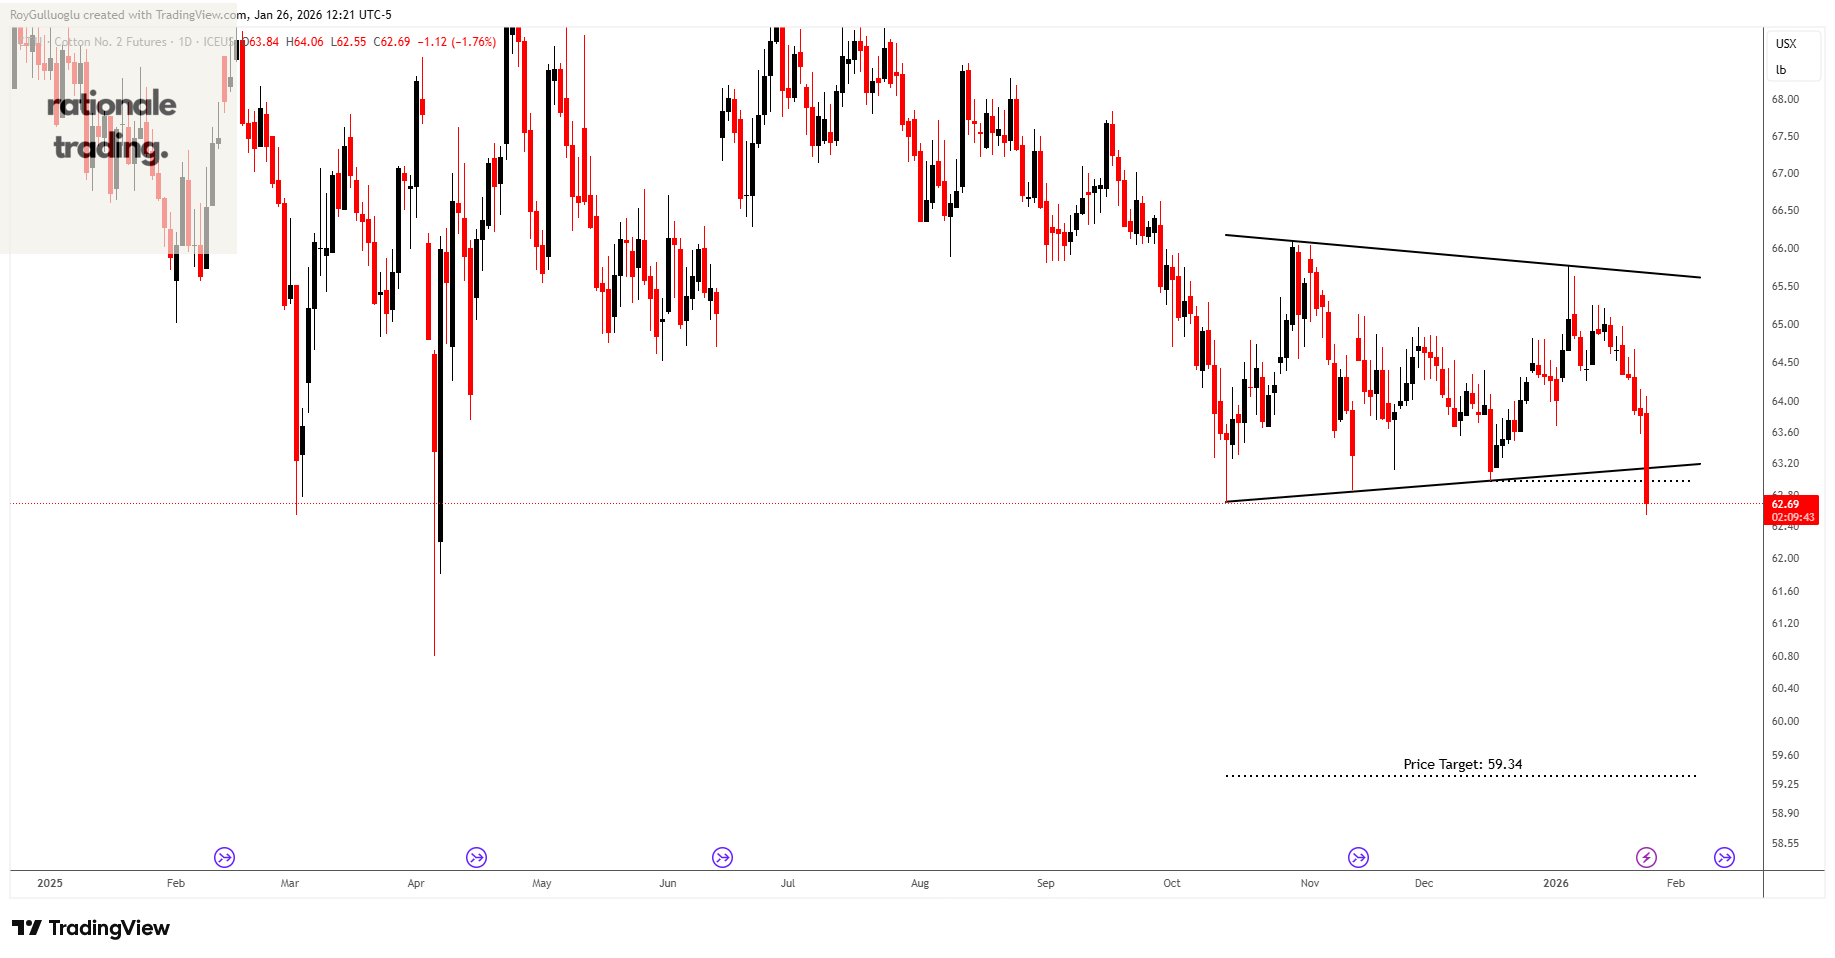
The above daily chart formed an approximately 3-month-long symmetrical triangle chart pattern as a bearish continuation after a downtrend.
The horizontal boundary at 62.36 levels acts as a resistance within this pattern.
A daily close below 62.35 levels would validate the breakout from the 3-month-long symmetrical triangle chart pattern .
Based on this chart pattern, the potential price target is approximately 59.34