


GXO Logistics, Inc.-(GXO/NYSE)-Long Idea
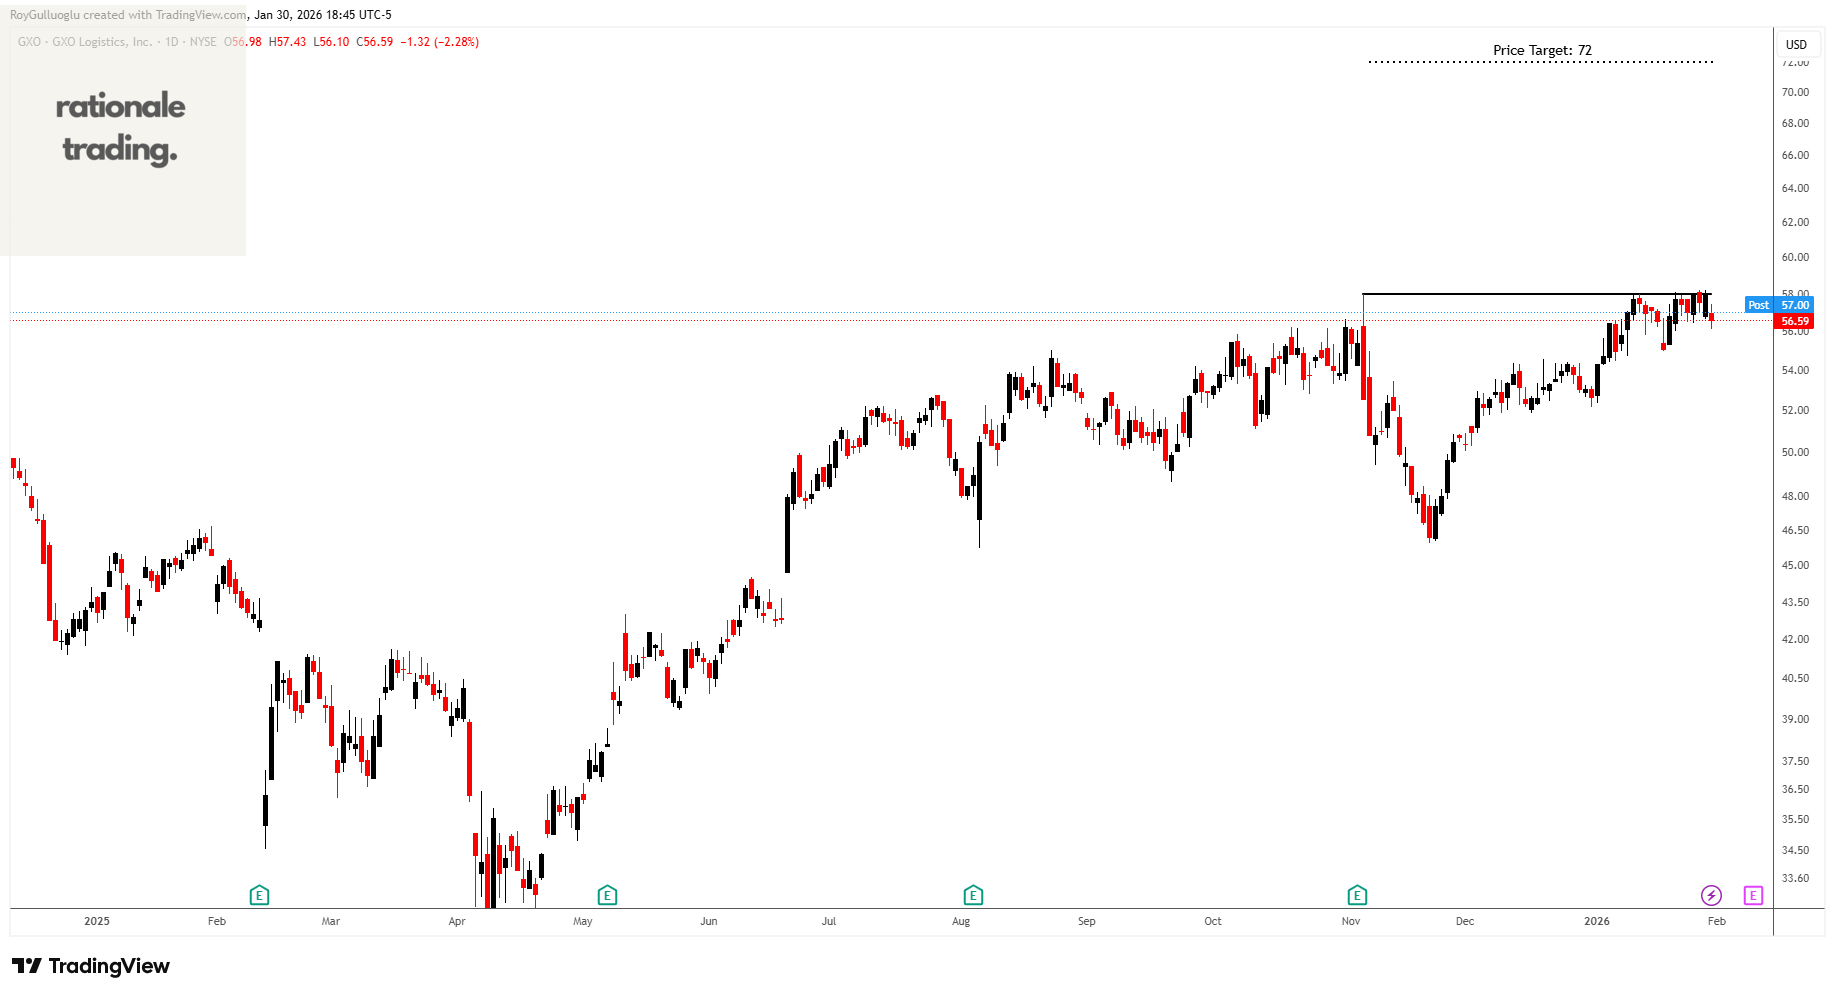
GXO Logistics, Inc., together with its subsidiaries, provides logistics services worldwide.
The above daily chart formed an approximately 2-month-long Cup & Handle chart pattern as a bullish continuation after an uptrend.
The horizontal boundary at 58 levels acts as a resistance within this pattern.
A daily close above 59.74 levels would validate the breakout from the 2-month-long Cup & Handle chart pattern.
Based on this chart pattern, the potential price target is 72 levels.
ESCO Technologies Inc.-(ESE/NYSE)-Long Idea
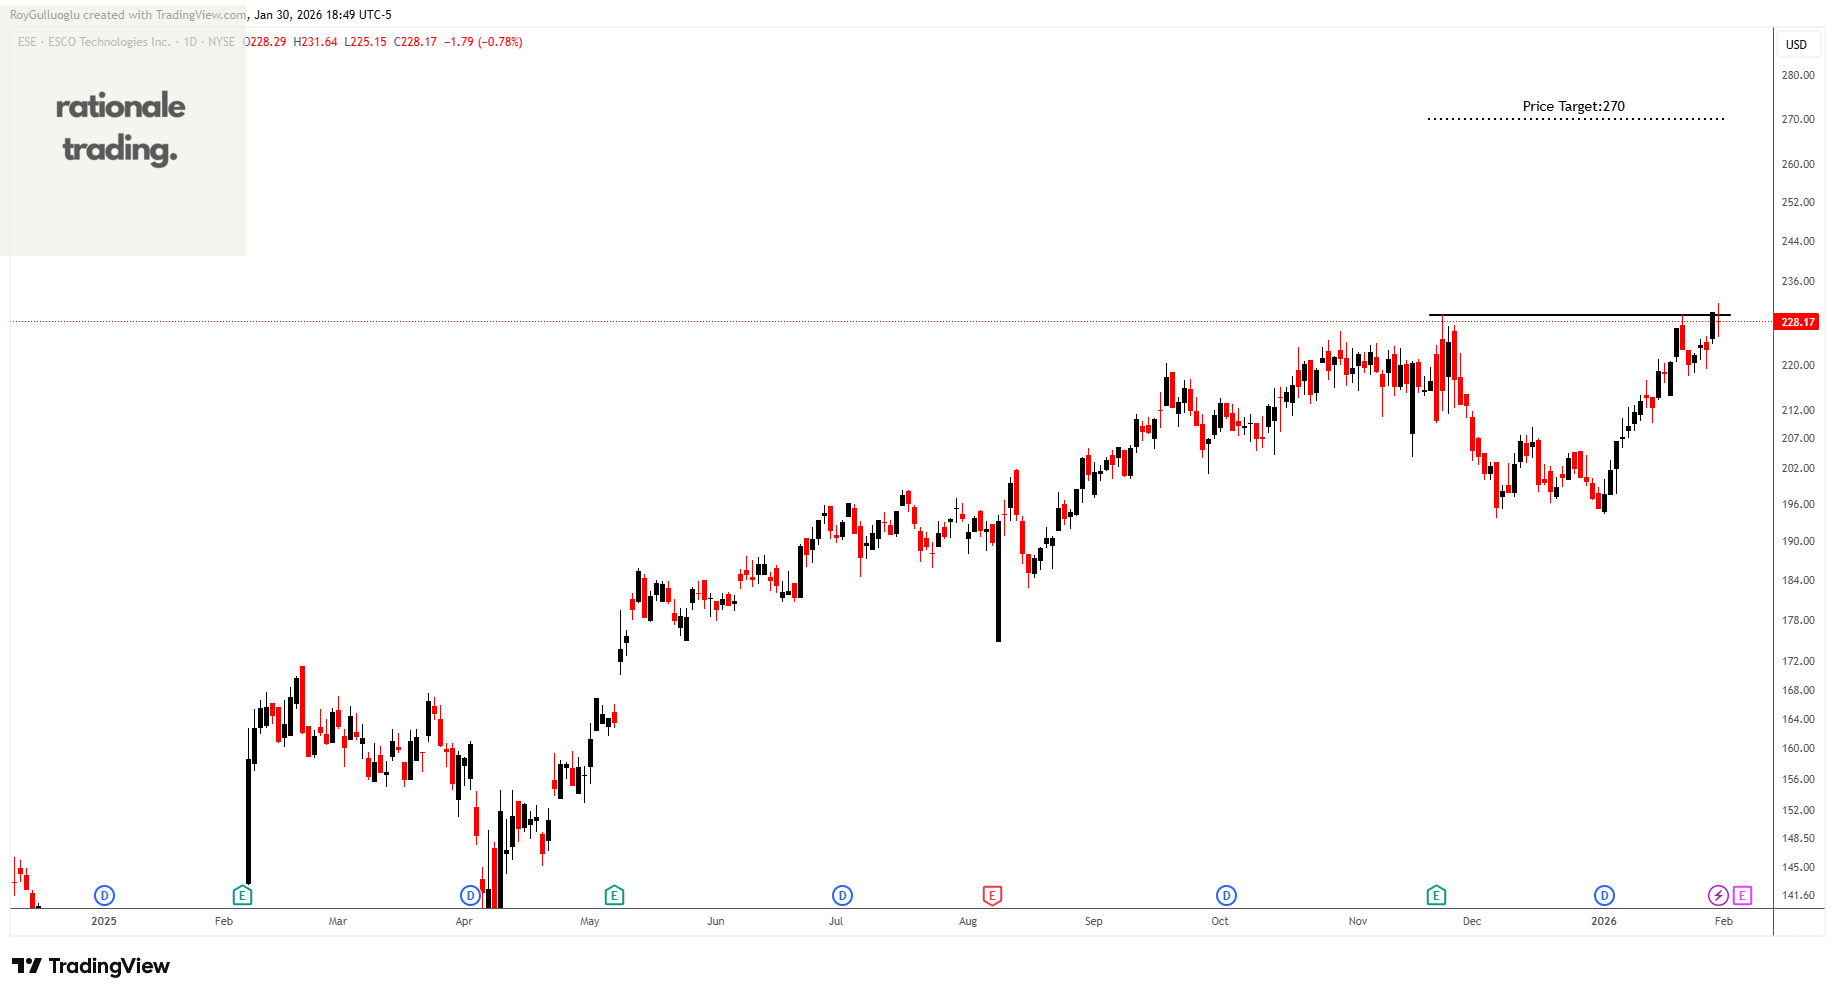
ESCO Technologies Inc. provides engineered components and systems for aviation, navy, defense, and industrial customers.
The above daily chart formed an approximately 2-month-long Cup & Handle chart pattern as a bullish continuation after an uptrend.
The horizontal boundary at 229.4 levels acts as a resistance within this pattern.
A daily close above 236.3 levels would validate the breakout from the 2-month-long Cup & Handle chart pattern.
Based on this chart pattern, the potential price target is 270 levels.
BWX Technologies, Inc.-(BWXT/NYSE)-Long Idea
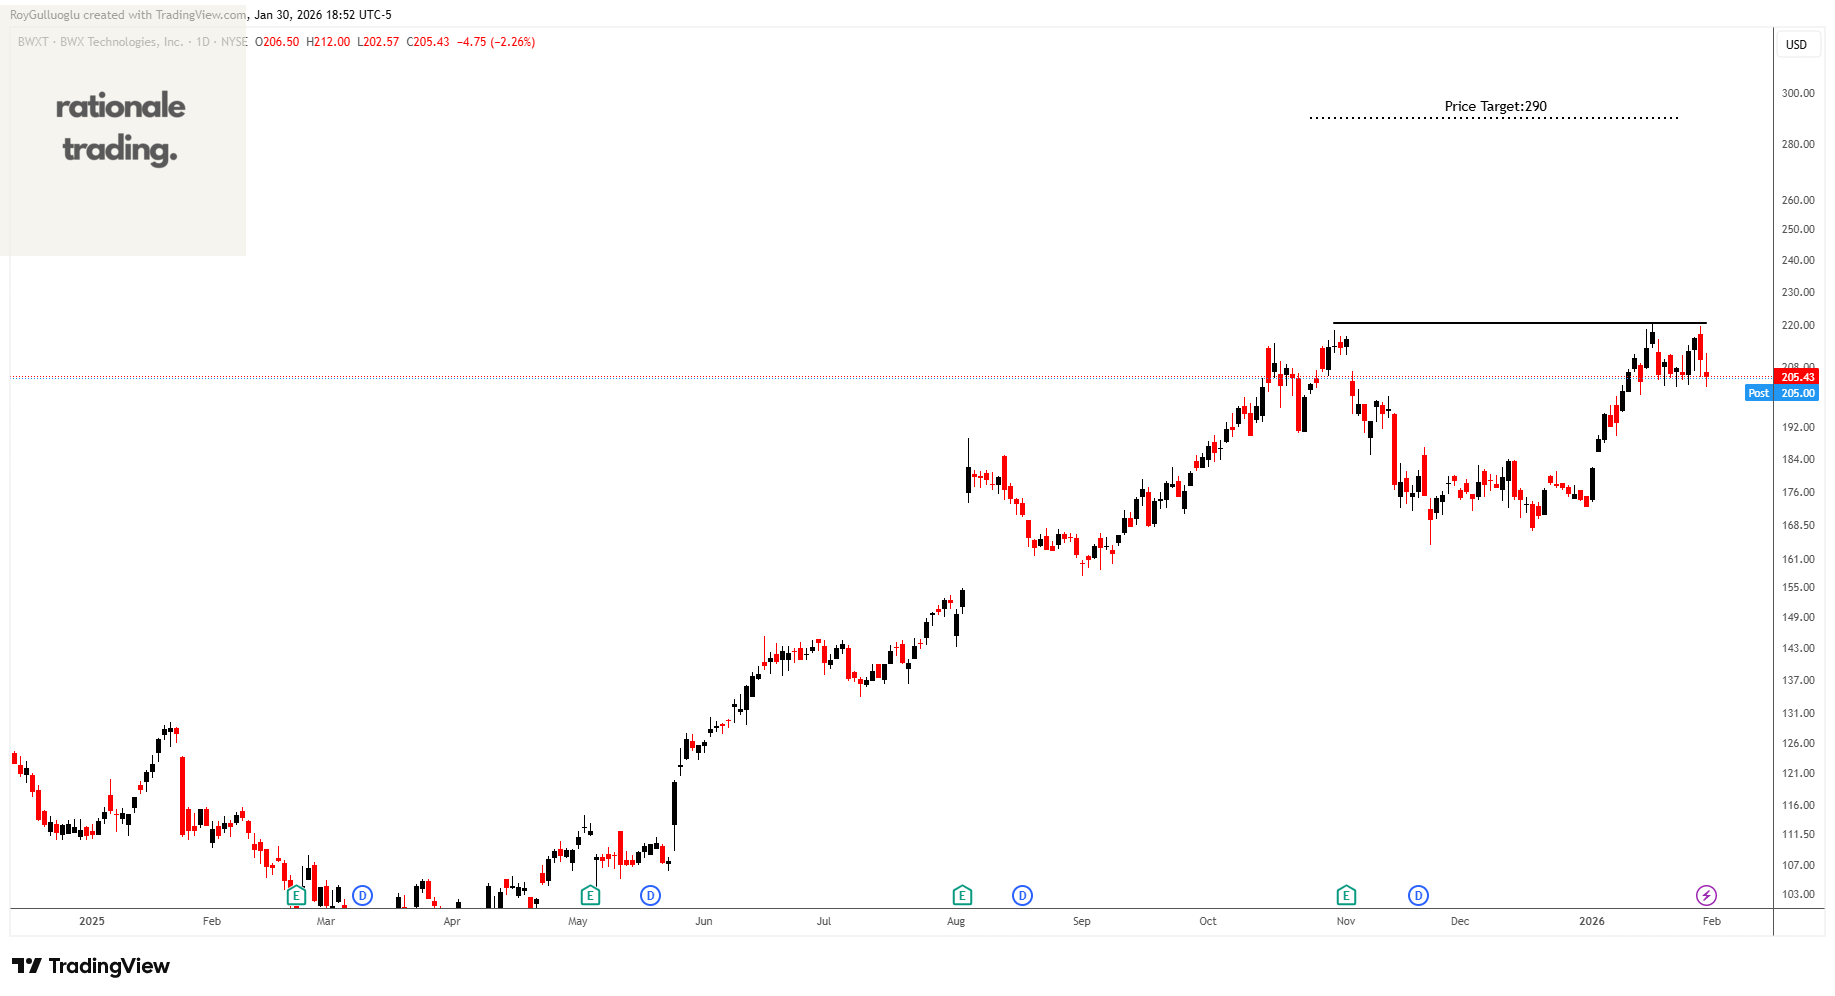
BWX Technologies, Inc. manufactures and sells nuclear components in the United States, Canada, and internationally.
The above daily chart formed an approximately 2-month-long Cup & Handle chart pattern as a bullish continuation after an uptrend.
The horizontal boundary at 220.57 levels acts as a resistance within this pattern.
A daily close above 227.18 levels would validate the breakout from the 2-month-long Cup & Handle chart pattern.
Based on this chart pattern, the potential price target is 290 levels.
Opendoor Technologies Inc.-(OPEN/NASDAQ)-Short Idea
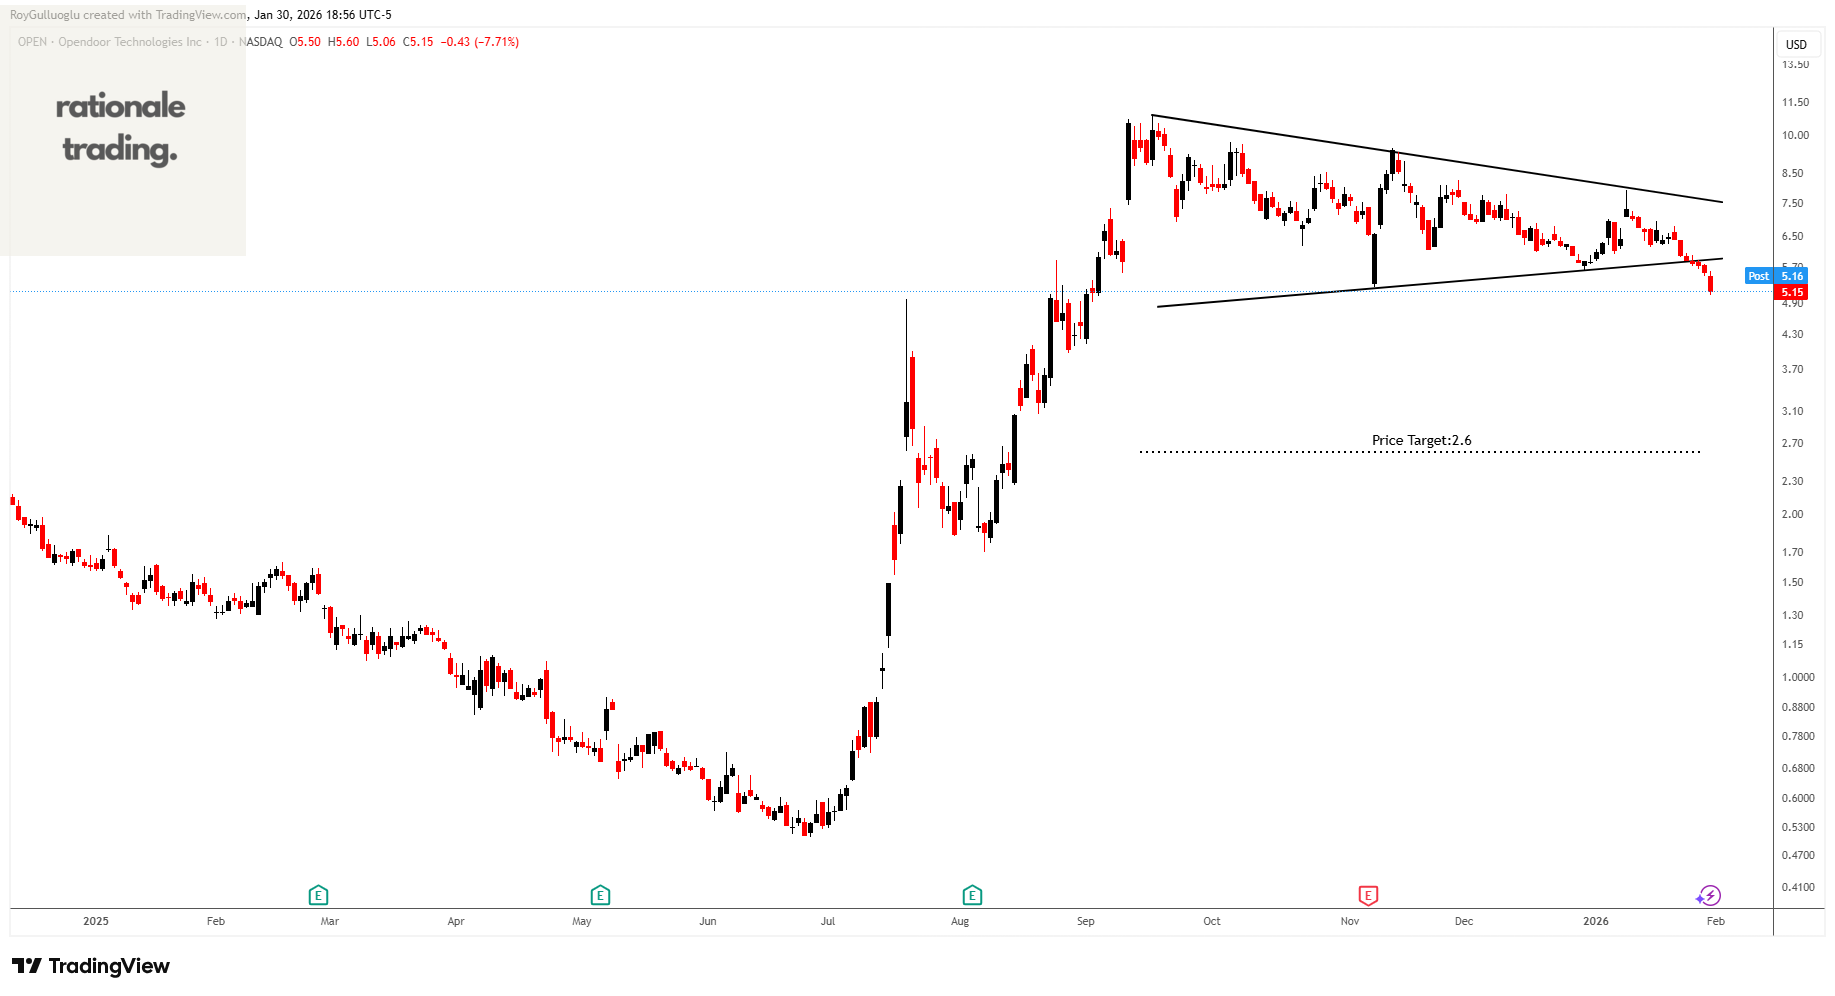
Opendoor Technologies Inc. operates a digital platform for residential real estate transactions in the United States.
The above daily chart formed an approximately 3-month-long symetrical triangle chart pattern as a bearish reversal after an uptrend.
A daily close below 5.47 levels validated the breakout from the 3-month-long symetrical triangle chart pattern.
Based on this chart pattern, the potential price target is 2.6 levels.
Erbosan Erciyas Boru Sanayii ve Ticaret A.S.-(ERBOS/BIST)-Long Idea
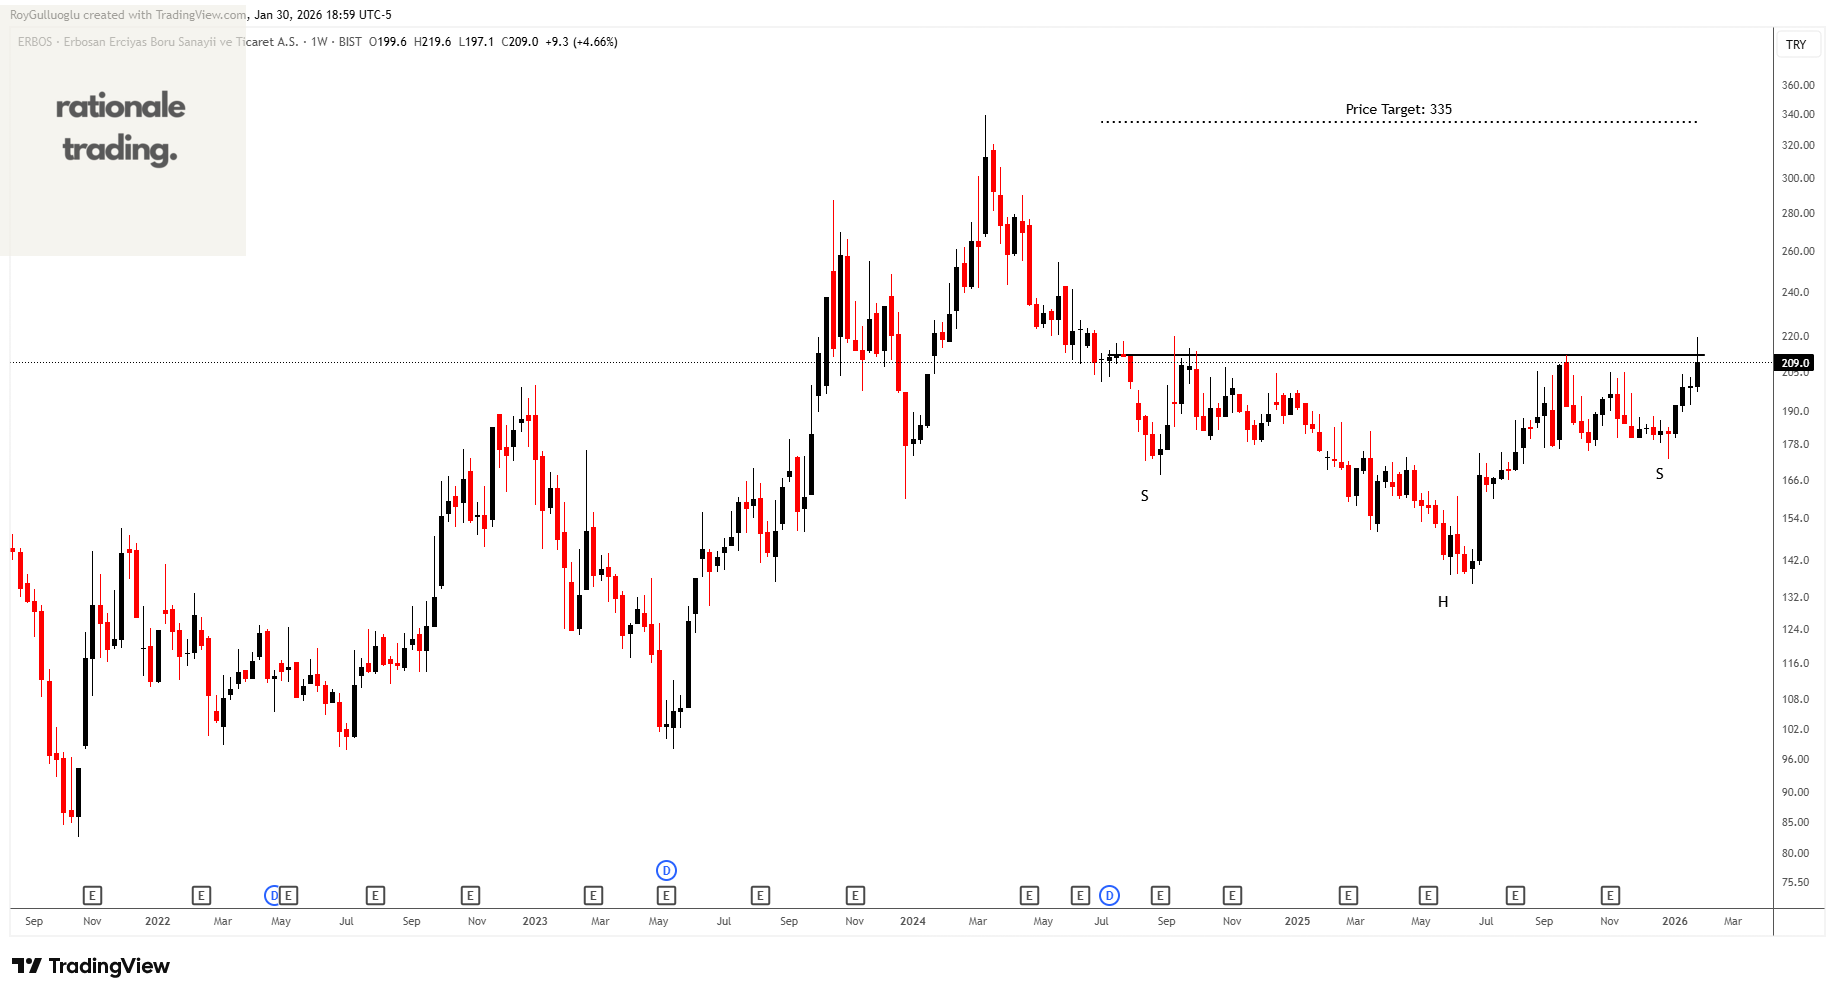
Erbosan Erciyas Boru Sanayii ve Ticaret A.S. produces and trades in carbon steel tubes and pipes in Turkey.
The above weekly chart formed an approximately 20-month-long H&S bottom chart pattern as a bullish reversal after a downtrend.
The horizontal boundary at 212.2 levels acts as a resistance within this pattern.
A daily close above 218.5 levels would validate the breakout from the 20-month-long H&S bottom chart pattern.
Based on this chart pattern, the potential price target is 335 levels.